 AI PPT Maker
 Templates
 PPT Bundles
 Design Services
 Business PPTs
 Business Plan
 Management
 Strategy
 Introduction PPT
 Roadmap
 Self Introduction
 Timelines
 Process
 Marketing
 Agenda
 Technology
 Medical
 Startup Business Plan
 Cyber Security
 Dashboards
 SWOT
SWOT Proposals
 Education
 Pitch Deck
 Digital Marketing
 KPIs
KPIs Project Management
 Product Management
 Artificial Intelligence
 Target Market
 Communication
 Supply Chain
 Google Slides
 Research Services
 One Pagers
 All Categories
Dashboards and kpis PowerPoint Presentation Templates and Google Slides
SHOW
- 60
- 120
- 180
DISPLAYING: 60 of 344 Item(s)
Page


Presenting this set of slides with name financial assets management kpi and dashboard ppt powerpoint presentation complete deck with slides. The topics discussed in these slides are pipeline projects, financial forecast, work forecast. This is a completely editable PowerPoint presentation and is available for immediate download. Download now and impress your audience.


Induce strategic thinking by presenting this complete deck. Enthrall your audience by deploying this thought provoking PPT deck. It can be downloaded in both standard and widescreen aspect ratios, thus making it a complete package to use and deploy. Convey your thoughts and actions using the twenty two slides presented in this complete deck. Additionally, feel free to alter its components like color, graphics, design, etc, to create a great first impression. Grab it now by clicking on the download button below.


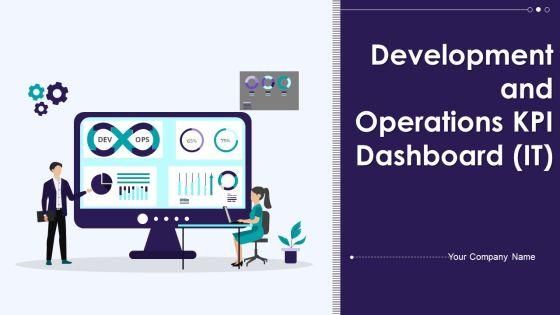
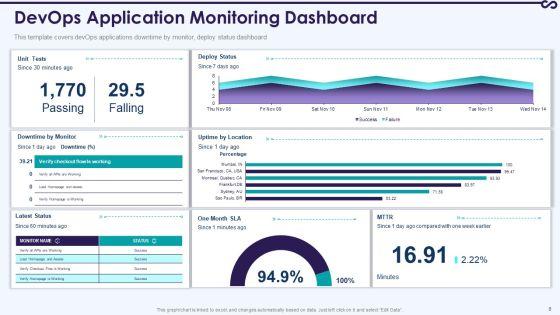
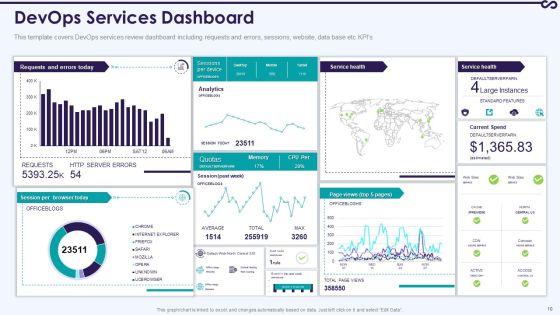
If designing a presentation takes a lot of your time and resources and you are looking for a better alternative, then this Development And Operations KPI Dashboard Ppt PowerPoint Presentation Complete Deck With Slides is the right fit for you. This is a prefabricated set that can help you deliver a great presentation on the topic. All the twelve slides included in this sample template can be used to present a birds-eye view of the topic. These slides are also fully editable, giving you enough freedom to add specific details to make this layout more suited to your business setting. Apart from the content, all other elements like color, design, theme are also replaceable and editable. This helps in designing a variety of presentations with a single layout. Not only this, you can use this PPT design in formats like PDF, PNG, and JPG once downloaded. Therefore, without any further ado, download and utilize this sample presentation as per your liking.
Presenting this set of slides with name healthcare management kpi dashboard showing incidents severity and consequences ppt powerpoint presentation icon structure. The topics discussed in these slides are incidents, severity, injury consequence, management, marketing. This is a completely editable PowerPoint presentation and is available for immediate download. Download now and impress your audience.
Presenting this set of slides with name healthcare management kpi dashboard showing incidents severity and consequences ppt powerpoint presentation icon model. The topics discussed in these slides are finance, marketing, management, investment, analysis. This is a completely editable PowerPoint presentation and is available for immediate download. Download now and impress your audience.


Presenting this set of slides with name healthcare management kpi dashboard showing incidents severity and consequences ppt powerpoint presentation ideas sample. The topics discussed in these slides are business, planning, strategy, marketing, management. This is a completely editable PowerPoint presentation and is available for immediate download. Download now and impress your audience.


Presenting this set of slides with name healthcare management kpi dashboard showing incidents severity and consequences ppt powerpoint presentation inspiration example file. The topics discussed in these slides are finance, marketing, management, investment, analysis. This is a completely editable PowerPoint presentation and is available for immediate download. Download now and impress your audience.


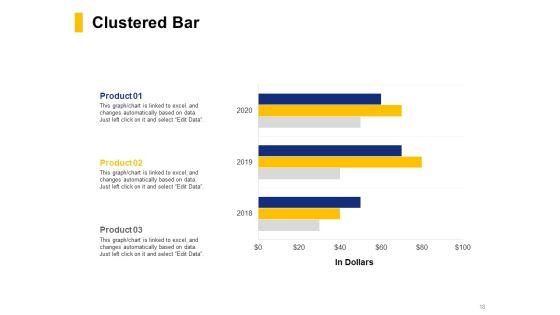
Presenting this set of slides with name healthcare management kpi dashboard showing incidents severity and consequences ppt powerpoint presentation inspiration summary. The topics discussed in these slides are bar graph, finance, marketing, analysis, investment. This is a completely editable PowerPoint presentation and is available for immediate download. Download now and impress your audience.


This slide showcases the KPIs that would help our business organization to evaluate improvements with the new financial strategy implementation. It includes total income, total expenses, accounts receivable, etc. The best PPT templates are a great way to save time, energy, and resources. Slidegeeks have 100 percent editable powerpoint slides making them incredibly versatile. With these quality presentation templates, you can create a captivating and memorable presentation by combining visually appealing slides and effectively communicating your message. Download Adjusting Financial Strategies And Planning KPI Dashboard To Analyze Financial Improvements Inspiration PDF from Slidegeeks and deliver a wonderful presentation.

The following slide outlines a comprehensive visual representation of customer satisfaction CSAT that can assist companies to measure how happy are customers wit the brand. The kpis covered are net promoter score NPS, customer effort score CES, product quality, pricing, etc. Retrieve professionally designed Market Analysis Overview And Different Categories KPI Dashboard To Analyze Customer Satisfaction Elements PDF to effectively convey your message and captivate your listeners. Save time by selecting pre made slideshows that are appropriate for various topics, from business to educational purposes. These themes come in many different styles, from creative to corporate, and all of them are easily adjustable and can be edited quickly. Access them as PowerPoint templates or as Google Slides themes. You do not have to go on a hunt for the perfect presentation because Slidegeeks got you covered from everywhere.


The following slide outlines key performance indicator KPI dashboard that can assist marketers to evaluate brand performance on social media channels. The metrics covered are age group, gender, brand perception, branding themes, celebrity analysis, etc. Present like a pro with Market Analysis Overview And Different Categories Brand Analytics Kpi Dashboard For Organization Rules PDF Create beautiful presentations together with your team, using our easy to use presentation slides. Share your ideas in real time and make changes on the fly by downloading our templates. So whether you are in the office, on the go, or in a remote location, you can stay in sync with your team and present your ideas with confidence. With Slidegeeks presentation got a whole lot easier. Grab these presentations today.


Mentioned slide shows the KPI dashboard that can be used to track win and lost sales opportunities. It includes metrics namely won opportunities, lost opportunities, pipeline by territory, total opportunities. Get a simple yet stunning designed Strategic Plan To Establish And Promote Brand Awareness Kpi Dashboard To Monitor Sales Opportunities Background PDF. It is the best one to establish the tone in your meetings. It is an excellent way to make your presentations highly effective. So, download this PPT today from Slidegeeks and see the positive impacts. Our easy to edit Strategic Plan To Establish And Promote Brand Awareness Kpi Dashboard To Monitor Sales Opportunities Background PDF can be your go to option for all upcoming conferences and meetings. So, what are you waiting for Grab this template today.


In this business intelligence dashboard is displayed to help company in real time monitoring and reporting of relevant details. It includes KPIs such as visits, average session duration, bounce rate, page views, traffic sources, etc. Showcasing this set of slides titled Business Intelligence And Web Analytics Dashboard To Track Marketing Kpis Inspiration PDF. The topics addressed in these templates are Goal Conversion, Track Marketing Kpis, Web Analytics Dashboard. All the content presented in this PPT design is completely editable. Download it and make adjustments in color, background, font etc. as per your unique business setting.


This slide covers the dashboard for analyzing campaign results. It includes metrics such as revenue, profit, profit per acquisition, cost per acquisition, leads, acquisition, and returns on investment. Formulating a presentation can take up a lot of effort and time, so the content and message should always be the primary focus. The visuals of the PowerPoint can enhance the presenters message, so our Marketing Campaign Dashboard To Track Cost And Revenue Kpis Ppt Infographics Good PDF was created to help save time. Instead of worrying about the design, the presenter can concentrate on the message while our designers work on creating the ideal templates for whatever situation is needed. Slidegeeks has experts for everything from amazing designs to valuable content, we have put everything into Marketing Campaign Dashboard To Track Cost And Revenue Kpis Ppt Infographics Good PDF.


Mentioned slide outlines a comprehensive dashboard outlining the results of customer churn prevention strategies. The key performance indicators KPIs covered in the slide are net promoter score NPS, loyal customer rate, customer lifetime value CLV, revenue churn, net retention rate, etc. Boost your pitch with our creative Measuring Net Retention And Revenue Churn With Kpi Dashboard Ppt PowerPoint Presentation File Backgrounds PDF. Deliver an awe inspiring pitch that will mesmerize everyone. Using these presentation templates you will surely catch everyones attention. You can browse the ppts collection on our website. We have researchers who are experts at creating the right content for the templates. So you do not have to invest time in any additional work. Just grab the template now and use them.
This slide covers the dashboard for analyzing customer loyalty with metrics such as NPS, loyal customer rate, premium users, CLV, customer churn, revenue churn, net retention, MRR growth, etc. Welcome to our selection of the Ultimate Guide To Improve Customer Support And Services Kpi Dashboard For Tracking Customer Retention Guidelines PDF. These are designed to help you showcase your creativity and bring your sphere to life. Planning and Innovation are essential for any business that is just starting out. This collection contains the designs that you need for your everyday presentations. All of our PowerPoints are 100 percent editable, so you can customize them to suit your needs. This multi purpose template can be used in various situations. Grab these presentation templates today.


Mentioned slide outlines a comprehensive dashboard outlining the results of customer churn prevention strategies. The key performance indicators KPIs covered in the slide are net promoter score NPS, loyal customer rate, customer lifetime value CLV, revenue churn, net retention rate, etc. The Measuring Net Retention And Revenue Churn With Kpi Dashboard Ideas PDF is a compilation of the most recent design trends as a series of slides. It is suitable for any subject or industry presentation, containing attractive visuals and photo spots for businesses to clearly express their messages. This template contains a variety of slides for the user to input data, such as structures to contrast two elements, bullet points, and slides for written information. Slidegeeks is prepared to create an impression.


This slide portrays key performance dashboard for measuring retail business performance. Kpis covered in the dashboards are average shopping time, shop visitors, average basket spend and customer retention. Explore a selection of the finest Optimizing And Managing Retail Kpi Dashboard For Retail Business Clipart PDF here. With a plethora of professionally designed and pre-made slide templates, you can quickly and easily find the right one for your upcoming presentation. You can use our Optimizing And Managing Retail Kpi Dashboard For Retail Business Clipart PDF to effectively convey your message to a wider audience. Slidegeeks has done a lot of research before preparing these presentation templates. The content can be personalized and the slides are highly editable. Grab templates today from Slidegeeks.


This slide shows the KPI dashboard of training and development workshop. It includes KPIs such as number of participants, train9ng duration, training type, etc. Showcasing this set of slides titled KPI Dashboard Of Strategic Training And Development Workshop Rules PDF. The topics addressed in these templates are Actual Cost, Training Type, Training Budget, Cost Per Participant. All the content presented in this PPT design is completely editable. Download it and make adjustments in color, background, font etc. as per your unique business setting.


This slide signifies key performance indicator dashboard to evaluate work accident. It includes information about total incident occurred by role and by department along with leave status. Pitch your topic with ease and precision using this KPI Dashboard To Measure Work Place Mishap And Workers Safety Inspiration PDF. This layout presents information on Accidents Role, Accidents Leave, Accidents Department. It is also available for immediate download and adjustment. So, changes can be made in the color, design, graphics or any other component to create a unique layout.


Following slide showcases dashboard for mergers and acquisitions to measure effects of milestones to confirm integration plan accordingly. It presents information related to deals by types, country, etc. Pitch your topic with ease and precision using this KPI Dashboard To Assess Deals In Mergers And Acquisitions Strategy Rules PDF. This layout presents information on Status, Strategy, Minority Equity Stake. It is also available for immediate download and adjustment. So, changes can be made in the color, design, graphics or any other component to create a unique layout.


This slide brings forth and e commerce KPI dashboard to track the process of placed orders and sales during the month. The key performing indicators are total sales, net sales, sales break down, total orders, item sold, etc. Showcasing this set of slides titled E Commerce KPI Dashboard To Track Order Request And Sales Introduction PDF. The topics addressed in these templates are Total Sales, Net Sales, Sales Break Down. All the content presented in this PPT design is completely editable. Download it and make adjustments in color, background, font etc. as per your unique business setting.


The following slide showcases employee engagement and satisfaction key performance indicators to encourage healthy team relationships. It includes key elements such as net promotor score, retention and absenteeism rate etc. From laying roadmaps to briefing everything in detail, our templates are perfect for you. You can set the stage with your presentation slides. All you have to do is download these easy to edit and customizable templates. Effective Workforce Participation Action Planning Employee Engagement And Satisfaction Kpi Dashboard Themes PDF will help you deliver an outstanding performance that everyone would remember and praise you for. Do download this presentation today.

The purpose of this slide is to outline key performance indicator KPI dashboard showcasing the results post resolving organizational conflicts. The metrics covered in this slide are conflicts by departments, conflicts logged by gender etc. Welcome to our selection of the Methods For Handling Stress And Disputes Kpi Metrics Dashboard Post Resolving Workplace Themes PDF These are designed to help you showcase your creativity and bring your sphere to life. Planning and Innovation are essential for any business that is just starting out. This collection contains the designs that you need for your everyday presentations. All of our PowerPoints are 100 percent editable, so you can customize them to suit your needs. This multi-purpose template can be used in various situations. Grab these presentation templates today.


This slide represents the key metrics dashboard representing the management of credit risks by the organization. It includes details related to key risk indicators, exposure by credit rating, sectors etc. Present like a pro with Operational Risk Assessment And Management Plan Credit Risk Management KPI Dashboard Guidelines PDF Create beautiful presentations together with your team, using our easy-to-use presentation slides. Share your ideas in real-time and make changes on the fly by downloading our templates. So whether you are in the office, on the go, or in a remote location, you can stay in sync with your team and present your ideas with confidence. With Slidegeeks presentation got a whole lot easier. Grab these presentations today.


This slide showcases the KPI dashboard of employee engagement and retention. It includes elements such as engagement score, response rate, engagement dimensions and net promoter score. Do you have to make sure that everyone on your team knows about any specific topic I yes, then you should give Engaging Employees Strategic Employee Engagement And Retention Kpi Dashboard Ideas PDF a try. Our experts have put a lot of knowledge and effort into creating this impeccable Engaging Employees Strategic Employee Engagement And Retention Kpi Dashboard Ideas PDF. You can use this template for your upcoming presentations, as the slides are perfect to represent even the tiniest detail. You can download these templates from the Slidegeeks website and these are easy to edit. So grab these today.


Following slide displays sales and orders performance monitoring dashboard. Key performance indicators covered in the slide are return reasons, perfect order rate, total orders, top seller by orders. Crafting an eye-catching presentation has never been more straightforward. Let your presentation shine with this tasteful yet straightforward Strategic Guide For Positioning Expanded Brand KPI Dashboard To Monitor Sales And Orders Performance Diagrams PDF template. It offers a minimalistic and classy look that is great for making a statement. The colors have been employed intelligently to add a bit of playfulness while still remaining professional. Construct the ideal Strategic Guide For Positioning Expanded Brand KPI Dashboard To Monitor Sales And Orders Performance Diagrams PDF that effortlessly grabs the attention of your audience Begin now and be certain to wow your customers.


Mentioned slide portrays KPI dashboard that can be used to monitor department wise security incidents. KPIs covered are new cases, total cases, resolved and pending cases. Presenting this PowerPoint presentation, titled Cyber Risks And Incident Response Playbook KPI Dashboard To Track Department Wise Security Incidents Mockup PDF, with topics curated by our researchers after extensive research. This editable presentation is available for immediate download and provides attractive features when used. Download now and captivate your audience. Presenting this Cyber Risks And Incident Response Playbook KPI Dashboard To Track Department Wise Security Incidents Mockup PDF. Our researchers have carefully researched and created these slides with all aspects taken into consideration. This is a completely customizable Cyber Risks And Incident Response Playbook KPI Dashboard To Track Department Wise Security Incidents Mockup PDF that is available for immediate downloading. Download now and make an impact on your audience. Highlight the attractive features available with our PPTs.
This slide covers project monitoring and control dashboard which can be used by PM. It provides information about metrics such as project health, actual budget, at risk project, start and finish date of the project. Showcasing this set of slides titled Performance Kpi Dashboard For Project Tracking And Control Pictures PDF. The topics addressed in these templates are Finance, Customer Support, Business Development. All the content presented in this PPT design is completely editable. Download it and make adjustments in color, background, font etc. as per your unique business setting.
Mentioned slide displays construction project monitoring and control KPI dashboard which can be used by construction manager to track various metrics. Construction manager can track metrics like project work status, projects by stages, project completion percentage, utilized duration, budget variance , workload etc. Showcasing this set of slides titled Construction Project Tracking And Control KPI Dashboard Summary PDF. The topics addressed in these templates are Budget Variance, Resources By Project, Utilized Duration. All the content presented in this PPT design is completely editable. Download it and make adjustments in color, background, font etc. as per your unique business setting.


This slide provides dashboard representing website development progress metrics with project performance status. It provides information regarding latency of product, pageviews by browser, pull requests and cost of cloud services. Showcasing this set of slides titled KPI Dashboard Showcasing Website Management Progress And Performance Status Structure PDF. The topics addressed in these templates are Pageview By Browser, Product, Average Latency. All the content presented in this PPT design is completely editable. Download it and make adjustments in color, background, font etc. as per your unique business setting.


Showcasing this set of slides titled Revenue And Expense Budget Deficit Analysis With KPI Dashboard Rules PDF. The topics addressed in these templates are Revenue And Expense, Budget Deficit Analysis. All the content presented in this PPT design is completely editable. Download it and make adjustments in color, background, font etc. as per your unique business setting.


The following slide depicts the yearly budget variance to compare projected and actual results. It includes elements such as net income, service revenues, profit margin, payroll cost, cost of goods sold etc. Showcasing this set of slides titled Annual Revenue And Cost Budget Deficit KPI Dashboard Ideas PDF. The topics addressed in these templates are Cost Budget, Deficit KPI Dashboard. All the content presented in this PPT design is completely editable. Download it and make adjustments in color, background, font etc. as per your unique business setting.
This slide depicts a dashboard for tracking the banking and financial activities of a business enterprise to measure the income and expenses. The key performing indicators are business accounts, paid, pending and cancelled transactions etc. Pitch your topic with ease and precision using this KPI Dashboard For Tracking Commercial Banking And Financial Activities Download PDF. This layout presents information on KPI Dashboard, Tracking Commercial Banking, Financial Activities. It is also available for immediate download and adjustment. So, changes can be made in the color, design, graphics or any other component to create a unique layout.


Following slide displays sales and orders performance monitoring dashboard. Key performance indicators covered in the slide are return reasons, perfect order rate, total orders, top seller by orders. Do you have an important presentation coming up Are you looking for something that will make your presentation stand out from the rest Look no further than Guide For Brand Kpi Dashboard To Monitor Sales And Orders Performance Brochure PDF. With our professional designs, you can trust that your presentation will pop and make delivering it a smooth process. And with Slidegeeks, you can trust that your presentation will be unique and memorable. So why wait Grab Guide For Brand Kpi Dashboard To Monitor Sales And Orders Performance Brochure PDF today and make your presentation stand out from the rest.


This slide depicts a dashboard to track the key performance metrics in sales and operations process of a manufacturing enterprise to analyze deviations in the actual and planned output. The key performing indicators are percentage deviation, dollar deviation, inventory in hand etc.Pitch your topic with ease and precision using this KPI Dashboard To Track Sales And Operations Process Of Manufacturing Enterprise Brochure PDF. This layout presents information on Planned Output, Yearly Growth, Inventory Hand. It is also available for immediate download and adjustment. So, changes can be made in the color, design, graphics or any other component to create a unique layout.
SHOW
- 60
- 120
- 180
DISPLAYING: 60 of 344 Item(s)
Page