- Sign up
- Sign In
 AI PPT Maker
 Templates
 PPT Bundles
 Design Services
 Business PPTs
 Business Plan
 Management
 Strategy
 Introduction PPT
 Roadmap
 Self Introduction
 Timelines
 Process
 Marketing
 Agenda
 Technology
 Medical
 Startup Business Plan
 Cyber Security
 Dashboards
 SWOT
SWOT Proposals
 Education
 Pitch Deck
 Digital Marketing
 KPIs
KPIs Project Management
 Product Management
 Artificial Intelligence
 Target Market
 Communication
 Supply Chain
 Google Slides
 Research Services
 One Pagers
 All Categories
Dashboard to evaluate PowerPoint Presentation Templates and Google Slides
SHOW
- 60
- 120
- 180
DISPLAYING: 60 of 88 Item(s)
Page


The following slide depicts email campaign performance analytical dashboard to connect with audience and gather real time insights. It includes elements such as emails sent, unique subscribers, opens, clicks, investment and revenue by campaign type etc. Create an editable Guide For Marketing Analytics To Improve Decisions Email Campaign Performance Evaluation KPI Dashboard Summary PDF that communicates your idea and engages your audience. Whether youre presenting a business or an educational presentation, pre designed presentation templates help save time. Guide For Marketing Analytics To Improve Decisions Email Campaign Performance Evaluation KPI Dashboard Summary PDF is highly customizable and very easy to edit, covering many different styles from creative to business presentations. Slidegeeks has creative team members who have crafted amazing templates. So, go and get them without any delay.


The purpose of this slide is to highlight key performance indicator KPI dashboard which will assist marketers to analyze company performance across social media platforms. The kpis outlined in slide are social media followers, page likes, etc. Make sure to capture your audiences attention in your business displays with our gratis customizable Direct Marketing Techniques To Enhance Business Presence Social Media Marketing Dashboard To Evaluate Rules PDF. These are great for business strategies, office conferences, capital raising or task suggestions. If you desire to acquire more customers for your tech business and ensure they stay satisfied, create your own sales presentation with these plain slides.
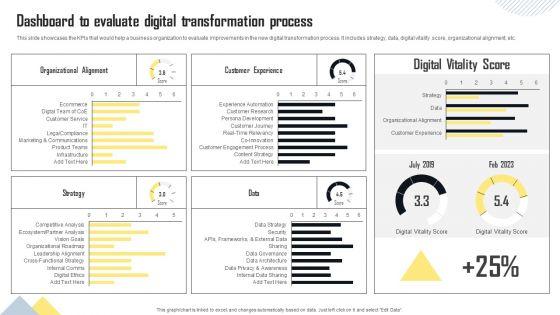
This slide showcases the KPIs that would help a business organization to evaluate improvements in the new digital transformation process. It includes strategy, data, digital vitality score, organizational alignment, etc. Here you can discover an assortment of the finest PowerPoint and Google Slides templates. With these templates, you can create presentations for a variety of purposes while simultaneously providing your audience with an eye catching visual experience. Download Dashboard To Evaluate Digital Transformation Process Graphics PDF to deliver an impeccable presentation. These templates will make your job of preparing presentations much quicker, yet still, maintain a high level of quality. Slidegeeks has experienced researchers who prepare these templates and write high quality content for you. Later on, you can personalize the content by editing the Dashboard To Evaluate Digital Transformation Process Graphics PDF.


This slide showcases the KPIs that would help a business organization to evaluate improvements in the new production planning and control system. It includes total production, defective production, production rate, average cycle duration, etc. Here you can discover an assortment of the finest PowerPoint and Google Slides templates. With these templates, you can create presentations for a variety of purposes while simultaneously providing your audience with an eye catching visual experience. Download Dashboard To Evaluate Manufacturing Quality In Organization Elements PDF to deliver an impeccable presentation. These templates will make your job of preparing presentations much quicker, yet still, maintain a high level of quality. Slidegeeks has experienced researchers who prepare these templates and write high quality content for you. Later on, you can personalize the content by editing the Dashboard To Evaluate Manufacturing Quality In Organization Elements PDF.


This slide showcases the KPIs that would help a business organization to evaluate improvements in the new recruitment and selection process. It includes hires per month, hires by department, etc. Here you can discover an assortment of the finest PowerPoint and Google Slides templates. With these templates, you can create presentations for a variety of purposes while simultaneously providing your audience with an eye catching visual experience. Download Aligning Human Resource Hiring Procedure Dashboard To Evaluate HR Recruitment Process Portrait PDF to deliver an impeccable presentation. These templates will make your job of preparing presentations much quicker, yet still, maintain a high level of quality. Slidegeeks has experienced researchers who prepare these templates and write high quality content for you. Later on, you can personalize the content by editing the Aligning Human Resource Hiring Procedure Dashboard To Evaluate HR Recruitment Process Portrait PDF.


The following slide depicts dashboard to measure energy utilization during the year at workplace to gain operational efficiency and develop smart ways to save for future. It includes elements such as progress by segment, transport, waste management, packaging, warehousing etc. Do you know about Slidesgeeks KPI Dashboard To Evaluate Energy Consumption Designs PDF These are perfect for delivering any kind od presentation. Using it, create PowerPoint presentations that communicate your ideas and engage audiences. Save time and effort by using our pre designed presentation templates that are perfect for a wide range of topic. Our vast selection of designs covers a range of styles, from creative to business, and are all highly customizable and easy to edit. Download as a PowerPoint template or use them as Google Slides themes.


This slide showcases dashboard that can help organization to evaluate key changes in financial KPIs post fundraising. Its key components are net profit margin, revenue, gross profit margin, debt to equity and return on equity. Do you have to make sure that everyone on your team knows about any specific topic I yes, then you should give Financial Kpi Dashboard To Evaluate Fundraising Impact Topics PDF a try. Our experts have put a lot of knowledge and effort into creating this impeccable Financial Kpi Dashboard To Evaluate Fundraising Impact Topics PDF. You can use this template for your upcoming presentations, as the slides are perfect to represent even the tiniest detail. You can download these templates from the Slidegeeks website and these are easy to edit. So grab these today.


This slide covers dashboard to track affiliate marketing program performance. It involves details such as affiliate licenses, solution licenses and program performance. Find a pre-designed and impeccable Dashboard To Evaluate Effectiveness Of Affiliate Marketing Program Background PDF. The templates can ace your presentation without additional effort. You can download these easy-to-edit presentation templates to make your presentation stand out from others. So, what are you waiting for Download the template from Slidegeeks today and give a unique touch to your presentation.


This slide provides an overview of the dashboard used to assess the status of risks involved in a project. The dashboard includes time, tasks, workload, progress, cost, etc. Get a simple yet stunning designed Risk Assessment Dashboard To Evaluate Status Of Project Risks Diagrams PDF. It is the best one to establish the tone in your meetings. It is an excellent way to make your presentations highly effective. So, download this PPT today from Slidegeeks and see the positive impacts. Our easy to edit Risk Assessment Dashboard To Evaluate Status Of Project Risks Diagrams PDF can be your go to option for all upcoming conferences and meetings. So, what are you waiting for Grab this template today.


This slide showcases the KPIs that would help a business organization to evaluate improvements in the new production planning and control system. It includes total production, defective production, production rate, average cycle duration, etc. This modern and well arranged Manufacturing Quality Assurance And Control Measures Dashboard To Evaluate Manufacturing Quality Infographics PDF provides lots of creative possibilities. It is very simple to customize and edit with the Powerpoint Software. Just drag and drop your pictures into the shapes. All facets of this template can be edited with Powerpoint, no extra software is necessary. Add your own material, put your images in the places assigned for them, adjust the colors, and then you can show your slides to the world, with an animated slide included.
The purpose of this slide is to outline mobile search engine optimization SEO reporting dashboard. It covers different metrics such as web traffic overview, total views, content overview, goal value and conversion etc. Get a simple yet stunning designed Introduction To Mobile SEM SEO Reporting Dashboard To Evaluate Website Rank Portrait PDF. It is the best one to establish the tone in your meetings. It is an excellent way to make your presentations highly effective. So, download this PPT today from Slidegeeks and see the positive impacts. Our easy to edit Introduction To Mobile SEM SEO Reporting Dashboard To Evaluate Website Rank Portrait PDF can be your go to option for all upcoming conferences and meetings. So, what are you waiting for Grab this template today.


This slide provides a dashboard to assess the rate of conversion and cost of display advertising campaign by different sources. It includes source, average cost of marketing, conversion, click, revenue, impression by source. Crafting an eye-catching presentation has never been more straightforward. Let your presentation shine with this tasteful yet straightforward Complete Guide For Display Dashboard To Evaluate Display Advertising Source Conversion Rules PDF template. It offers a minimalistic and classy look that is great for making a statement. The colors have been employed intelligently to add a bit of playfulness while still remaining professional. Construct the ideal Complete Guide For Display Dashboard To Evaluate Display Advertising Source Conversion Rules PDF that effortlessly grabs the attention of your audience Begin now and be certain to wow your customers.


The following slide showcases performance key performance indicator KPI dashboard through which marketing team can measure social media campaign performance. The KPIs highlighted are YouTube channel views, Facebook daily reach, LinkedIn clicks and likes, etc. Explore a selection of the finest Comprehensive Guide To Build Marketing Marketing Analytics Dashboard To Evaluate Structure PDF here. With a plethora of professionally designed and pre-made slide templates, you can quickly and easily find the right one for your upcoming presentation. You can use our Comprehensive Guide To Build Marketing Marketing Analytics Dashboard To Evaluate Structure PDF to effectively convey your message to a wider audience. Slidegeeks has done a lot of research before preparing these presentation templates. The content can be personalized and the slides are highly editable. Grab templates today from Slidegeeks.


This slide represents talent management dashboards. It includes average time to hire, cost per hire, training cost, talent turnover rate, talent satisfaction etc. Whether you have daily or monthly meetings, a brilliant presentation is necessary. Dashboard To Evaluate Talent Management Metrics Professional PDF can be your best option for delivering a presentation. Represent everything in detail using Dashboard To Evaluate Talent Management Metrics Professional PDF and make yourself stand out in meetings. The template is versatile and follows a structure that will cater to your requirements. All the templates prepared by Slidegeeks are easy to download and edit. Our research experts have taken care of the corporate themes as well. So, give it a try and see the results.
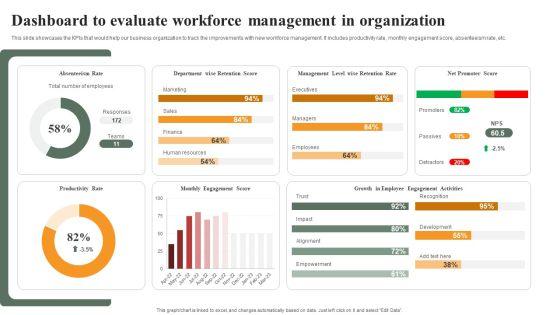
This slide showcases the KPIs that would help our business organization to track the improvements with new workforce management. It includes productivity rate, monthly engagement score, absenteeism rate, etc. Do you have to make sure that everyone on your team knows about any specific topic I yes, then you should give Optimizing Human Capital Alignment Dashboard To Evaluate Workforce Management In Organization Mockup PDF a try. Our experts have put a lot of knowledge and effort into creating this impeccable Optimizing Human Capital Alignment Dashboard To Evaluate Workforce Management In Organization Mockup PDF. You can use this template for your upcoming presentations, as the slides are perfect to represent even the tiniest detail. You can download these templates from the Slidegeeks website and these are easy to edit. So grab these today.


The following slide showcases KPI dashboard which can be used by finance managers to evaluate financial health of company. Revenue, expenses, net profit, bills receivable, bills payable, quick ratio, current ratio are some of the major metrics which are outlined in the slide. Do you have an important presentation coming up Are you looking for something that will make your presentation stand out from the rest Look no further than Market Evaluation Of IT Industry Financial Dashboard To Track Organization Expenses Clipart PDF. With our professional designs, you can trust that your presentation will pop and make delivering it a smooth process. And with Slidegeeks, you can trust that your presentation will be unique and memorable. So why wait Grab Market Evaluation Of IT Industry Financial Dashboard To Track Organization Expenses Clipart PDF today and make your presentation stand out from the rest.


The following slide outlines a comprehensive KPI dashboard which can be used to analyze the performance of Facebook video campaign. It provides information about page video views, page video views organic etc. Formulating a presentation can take up a lot of effort and time, so the content and message should always be the primary focus. The visuals of the PowerPoint can enhance the presenters message, so our KPI Metrics Dashboard To Evaluate Facebook Video Campaign Performance Introduction PDF was created to help save time. Instead of worrying about the design, the presenter can concentrate on the message while our designers work on creating the ideal templates for whatever situation is needed. Slidegeeks has experts for everything from amazing designs to valuable content, we have put everything into KPI Metrics Dashboard To Evaluate Facebook Video Campaign Performance Introduction PDF.


This slide showcases the KPIs that would help our business organization to evaluate improvements in the consumer adoption process. It includes repeat purchase ratio per purchase frequency, conversions over time, customer adoption rate, customer churn rate, etc. Do you have an important presentation coming up Are you looking for something that will make your presentation stand out from the rest Look no further than Implementing Client Onboarding Process Dashboard To Evaluate Consumer Adoption In Organization Diagrams PDF. With our professional designs, you can trust that your presentation will pop and make delivering it a smooth process. And with Slidegeeks, you can trust that your presentation will be unique and memorable. So why wait Grab Implementing Client Onboarding Process Dashboard To Evaluate Consumer Adoption In Organization Diagrams PDF today and make your presentation stand out from the rest.
The purpose of this slide is to outline mobile search engine optimization SEO reporting dashboard. It covers different metrics such as web traffic overview, total views, content overview, goal value and conversion etc. If you are looking for a format to display your unique thoughts, then the professionally designed Top SEO Techniques Seo Reporting Dashboard To Evaluate Website Rank Ideas PDF is the one for you. You can use it as a Google Slides template or a PowerPoint template. Incorporate impressive visuals, symbols, images, and other charts. Modify or reorganize the text boxes as you desire. Experiment with shade schemes and font pairings. Alter, share or cooperate with other people on your work. Download Top SEO Techniques Seo Reporting Dashboard To Evaluate Website Rank Ideas PDF and find out how to give a successful presentation. Present a perfect display to your team and make your presentation unforgettable.
The purpose of this slide is to outline mobile search engine optimization SEO reporting dashboard. It covers different metrics such as web traffic overview, total views, content overview, goal value and conversion etc. There are so many reasons you need a Mobile Search Engine Optimization Plan SEO Reporting Dashboard To Evaluate Website Rank Structure PDF. The first reason is you can not spend time making everything from scratch, Thus, Slidegeeks has made presentation templates for you too. You can easily download these templates from our website easily.


The following slide outlines a comprehensive KPI dashboard which can be used to analyze the performance of Facebook video campaign. It provides information about page video views, page video views organic etc. Whether you have daily or monthly meetings, a brilliant presentation is necessary. Kpi Metrics Dashboard To Evaluate Facebook Video Campaign Performance Information PDF can be your best option for delivering a presentation. Represent everything in detail using Kpi Metrics Dashboard To Evaluate Facebook Video Campaign Performance Information PDF and make yourself stand out in meetings. The template is versatile and follows a structure that will cater to your requirements. All the templates prepared by Slidegeeks are easy to download and edit. Our research experts have taken care of the corporate themes as well. So, give it a try and see the results.


The following slide outlines a performance Key performance indicator dashboard that can be used by the company to analyze the digital marketing campaign performance. The key metrics covered in the slide are total sales, revenue, profit, cost, up-sell and crop sell, incremental sales, etc. Want to ace your presentation in front of a live audience Our Marketing Tactics To Increase KPI Dashboard To Evaluate Online Marketing Campaign Infographics PDF can help you do that by engaging all the users towards you. Slidegeeks experts have put their efforts and expertise into creating these impeccable powerpoint presentations so that you can communicate your ideas clearly. Moreover, all the templates are customizable, and easy-to-edit and downloadable. Use these for both personal and commercial use.


This slide represents talent management dashboards. It includes average time to hire, cost per hire, training cost, talent turnover rate, talent satisfaction etc. There are so many reasons you need a Talent Management Optimization With Workforce Staffing Dashboard To Evaluate Talent Management Metrics Summary PDF. The first reason is you can not spend time making everything from scratch, Thus, Slidegeeks has made presentation templates for you too. You can easily download these templates from our website easily.


The following slide showcases dashboard enabling organizations to create baseline to plan, implement and ensure progress. It presents information related to problem management, incidents by priority, etc. Pitch your topic with ease and precision using this ITIL Evaluation Dashboard To Meet Set Targets Summary PDF. This layout presents information on Incidents By Priority, Service Requester. It is also available for immediate download and adjustment. So, changes can be made in the color, design, graphics or any other component to create a unique layout.


Pitch your topic with ease and precision using this Dashboard For Competitor Price Evaluation To Compare Product Performance Portrait PDF. This layout presents information on Competitor Price Evaluation, Compare Product. It is also available for immediate download and adjustment. So, changes can be made in the color, design, graphics or any other component to create a unique layout.


The following slide outlines the key performance indicator dashboard used by the marketing manager to find out the success rate of the advertising campaign. The major KPIs are total cost, clicks, impressions, conversions, AD impressions etc. Do you have to make sure that everyone on your team knows about any specific topic I yes, then you should give KPI Dashboard To Evaluate Effectiveness Of Digital Advertisement Campaign Pictures PDF a try. Our experts have put a lot of knowledge and effort into creating this impeccable KPI Dashboard To Evaluate Effectiveness Of Digital Advertisement Campaign Pictures PDF. You can use this template for your upcoming presentations, as the slides are perfect to represent even the tiniest detail. You can download these templates from the Slidegeeks website and these are easy to edit. So grab these today.


This slide contains KPI dashboard which can be used by company to track e-commerce sales. It includes kpis such as total orders, order quantity, sales quantity, sales by location, etc. Pitch your topic with ease and precision using this KPI Dashboard To Evaluate Corporate Sales Introduction PDF. This layout presents information on KPI Dashboard, Evaluate Corporate Sales. It is also available for immediate download and adjustment. So, changes can be made in the color, design, graphics or any other component to create a unique layout.


The following slide outlines key performance indicator KPI dashboard which can be used to track the social media marketing campaign performance, post implementing automation. It covers information about the social media followers, page impressions, instagram overview, etc. Retrieve professionally designed Introducing AI Tools Performance KPI Dashboard To Evaluate Social Media Marketing Ideas PDF to effectively convey your message and captivate your listeners. Save time by selecting pre-made slideshows that are appropriate for various topics, from business to educational purposes. These themes come in many different styles, from creative to corporate, and all of them are easily adjustable and can be edited quickly. Access them as PowerPoint templates or as Google Slides themes. You dont have to go on a hunt for the perfect presentation because Slidegeeks got you covered from everywhere.


The following slide showcases key performance indicator dashboard which can be used to measure the performance of new store. It covers information about net sales, sales per square foot, average basket size ABS, total visitors count etc.Create an editable Kpi Dashboard To Evaluate The New Retail Store Performance Opening Retail Store In Untapped Download PDF that communicates your idea and engages your audience. Whether you are presenting a business or an educational presentation, pre-designed presentation templates help save time. Kpi Dashboard To Evaluate The New Retail Store Performance Opening Retail Store In Untapped Download PDF is highly customizable and very easy to edit, covering many different styles from creative to business presentations. Slidegeeks has creative team members who have crafted amazing templates. So, go and get them without any delay.


Mentioned slide showcases KPI dashboard that can be used to check the financial performance of a brand. Metrics covered in the dashboard are return on assets, working capital ratio, return on equity etc.Coming up with a presentation necessitates that the majority of the effort goes into the content and the message you intend to convey. The visuals of a PowerPoint presentation can only be effective if it supplements and supports the story that is being told. Keeping this in mind our experts created Financial KPI Dashboard To Measure Brand Performance Brand And Equity Evaluation Techniques Elements PDF to reduce the time that goes into designing the presentation. This way, you can concentrate on the message while our designers take care of providing you with the right template for the situation.


This slide represents the KPI dashboard to measure sales pipeline reporting for increasing customer conversion rate. It includes activity by representative, forecast by month and monthly growth. Pitch your topic with ease and precision using this KPI Dashboard To Evaluate Growth In Sales Funnel Reporting Topics PDF. This layout presents information on Pipeline Requirement, Key Activities, Pipeline Closed Date. It is also available for immediate download and adjustment. So, changes can be made in the color, design, graphics or any other component to create a unique layout.


The following slide outlines a comprehensive KPI dashboard which can be used to analyze the performance of Facebook video campaign. It provides information about page video views, page video views organic etc. Coming up with a presentation necessitates that the majority of the effort goes into the content and the message you intend to convey. The visuals of a PowerPoint presentation can only be effective if it supplements and supports the story that is being told. Keeping this in mind our experts created Executing Video Promotional KPI Metrics Dashboard To Evaluate Facebook Video Campaign Summary PDF to reduce the time that goes into designing the presentation. This way, you can concentrate on the message while our designers take care of providing you with the right template for the situation.


This slide showcases dashboard that can help organization to evaluate key changes in financial kpis post fundraising. Its key components are net profit margin, revenue, gross profit margin, debt to equity and return on equity. This Assessing Debt And Equity Fundraising Alternatives For Business Growth Financial KPI Dashboard To Evaluate Infographics PDF is perfect for any presentation, be it in front of clients or colleagues. It is a versatile and stylish solution for organizing your meetings. TheAssessing Debt And Equity Fundraising Alternatives For Business Growth Financial KPI Dashboard To Evaluate Infographics PDF features a modern design for your presentation meetings. The adjustable and customizable slides provide unlimited possibilities for acing up your presentation. Slidegeeks has done all the homework before launching the product for you. So, do not wait, grab the presentation templates today


This slide showcases dashboard that can help organization to calculate the internal rate of return on invested capital. Company can use it to communicate the return on investment to investors. Create an editable Assessing Debt And Equity Fundraising Alternatives For Business Growth Financial Dashboard To Evaluate Internal Designs PDF that communicates your idea and engages your audience. Whether you are presenting a business or an educational presentation, pre designed presentation templates help save time.Assessing Debt And Equity Fundraising Alternatives For Business Growth Financial Dashboard To Evaluate Internal Designs PDF is highly customizable and very easy to edit, covering many different styles from creative to business presentations. Slidegeeks has creative team members who have crafted amazing templates. So, go and get them without any delay.


This slide covers the project management dashboard which includes status of project phases such as planning, designing, development and testing that also focuses on launch date of project, overdue tasks with date, deadline, etc. and workload on employees. Coming up with a presentation necessitates that the majority of the effort goes into the content and the message you intend to convey. The visuals of a PowerPoint presentation can only be effective if it supplements and supports the story that is being told. Keeping this in mind our experts created Project Time Management Execution Strategies Project Management Dashboard To Evaluate Performance Template PDF to reduce the time that goes into designing the presentation. This way, you can concentrate on the message while our designers take care of providing you with the right template for the situation.


The following slide outlines a comprehensive key performance indicator KPI dashboard highlighting different financial metrics. The KPIs are quick and current ratio, cash balance, days sales outstanding etc. The best PPT templates are a great way to save time, energy, and resources. Slidegeeks have 100 percent editable powerpoint slides making them incredibly versatile. With these quality presentation templates, you can create a captivating and memorable presentation by combining visually appealing slides and effectively communicating your message. Download Monetary Planning And Evaluation Guide Performance KPI Dashboard To Measure Financial Position Of Organization Ppt File Slides PDF from Slidegeeks and deliver a wonderful presentation.


Performance KPI Dashboard To Evaluate Social Media Marketing Performance Post Automation Formats PDF
The following slide outlines key performance indicator KPI dashboard which can be used to track the social media marketing campaign performance, post implementing automation. It covers information about the social media followers, page impressions, instagram overview, etc. Slidegeeks is here to make your presentations a breeze with Performance KPI Dashboard To Evaluate Social Media Marketing Performance Post Automation Formats PDF With our easy to use and customizable templates, you can focus on delivering your ideas rather than worrying about formatting. With a variety of designs to choose from, you are sure to find one that suits your needs. And with animations and unique photos, illustrations, and fonts, you can make your presentation pop. So whether you are giving a sales pitch or presenting to the board, make sure to check out Slidegeeks first.


The following slide outlines a comprehensive KPI dashboard which can be used to analyze the performance of Facebook video campaign. It provides information about page video views, page video views organic etc. The best PPT templates are a great way to save time, energy, and resources. Slidegeeks have 100 percent editable powerpoint slides making them incredibly versatile. With these quality presentation templates, you can create a captivating and memorable presentation by combining visually appealing slides and effectively communicating your message. Download Video Promotion Techniques KPI Metrics Dashboard To Evaluate Facebook Video Introduction PDF from Slidegeeks and deliver a wonderful presentation.
The purpose of this slide is to outline mobile search engine optimization SEO reporting dashboard. It covers different metrics such as web traffic overview, total views, content overview, goal value and conversion etc. The SEO Reporting Dashboard To Evaluate Website Rank Performing Mobile SEO Audit To Analyze Web Traffic Inspiration PDF is a compilation of the most recent design trends as a series of slides. It is suitable for any subject or industry presentation, containing attractive visuals and photo spots for businesses to clearly express their messages. This template contains a variety of slides for the user to input data, such as structures to contrast two elements, bullet points, and slides for written information. Slidegeeks is prepared to create an impression.


The following slide showcases dashboard which can be used by the healthcare professionals to measure the performance of operational department. The KPIs covered in the slide are total patients, operational cost, available staff per division etc. There are so many reasons you need a Healthcare Management Overview Trends Stats And Operational Areas Dashboard To Evaluate The Hospital Operations Performance Pictures PDF. The first reason is you can not spend time making everything from scratch, Thus, Slidegeeks has made presentation templates for you too. You can easily download these templates from our website easily.


This slide showcases dashboard that can help organization to evaluate key changes in financial KPIs post fundraising. Its key components are net profit margin, revenue, gross profit margin, debt to equity and return on equity. From laying roadmaps to briefing everything in detail, our templates are perfect for you. You can set the stage with your presentation slides. All you have to do is download these easy-to-edit and customizable templates. Financial Kpi Dashboard To Evaluate Fundraising Impact Developing Fundraising Techniques Diagrams PDF will help you deliver an outstanding performance that everyone would remember and praise you for. Do download this presentation today.


Financial Dashboard To Evaluate Internal Rate Of Return Developing Fundraising Techniques Themes PDF
This slide showcases returns that can be expected by investing capital into business. Its key components are year, total investment, returns, internal rate of return and return on investment.There are so many reasons you need a Financial Dashboard To Evaluate Internal Rate Of Return Developing Fundraising Techniques Themes PDF. The first reason is you can not spend time making everything from scratch, Thus, Slidegeeks has made presentation templates for you too. You can easily download these templates from our website easily.


This slide showcases dashboard that can help organization to evaluate key changes in financial KPIs post fundraising. Its key components are net profit margin, revenue, gross profit margin, debt to equity and return on equity. There are so many reasons you need a Strategic Fund Acquisition Plan For Business Opertions Expansion Financial KPI Dashboard To Evaluate Fundraising Impact Guidelines PDF. The first reason is you can not spend time making everything from scratch, Thus, Slidegeeks has made presentation templates for you too. You can easily download these templates from our website easily.


This slide showcases dashboard that can help organization to calculate the internal rate rate of return on invested capital. Company can use it to communicate the return on investment to investors. Create an editable Financial Dashboard To Evaluate Internal Rate Of Return Diagrams PDF that communicates your idea and engages your audience. Whether youre presenting a business or an educational presentation, pre designed presentation templates help save time. Financial Dashboard To Evaluate Internal Rate Of Return Diagrams PDF is highly customizable and very easy to edit, covering many different styles from creative to business presentations. Slidegeeks has creative team members who have crafted amazing templates. So, go and get them without any delay.
The purpose of this slide is to outline mobile search engine optimization SEO reporting dashboard. It covers different metrics such as web traffic overview, total views, content overview, goal value and conversion etc. This Seo Reporting Dashboard To Evaluate Website Rank Search Engine Optimization Services To Minimize Template PDF is perfect for any presentation, be it in front of clients or colleagues. It is a versatile and stylish solution for organizing your meetings. The Seo Reporting Dashboard To Evaluate Website Rank Search Engine Optimization Services To Minimize Template PDF features a modern design for your presentation meetings. The adjustable and customizable slides provide unlimited possibilities for acing up your presentation. Slidegeeks has done all the homework before launching the product for you. So, do not wait, grab the presentation templates today.
The purpose of this slide is to outline mobile search engine optimization SEO reporting dashboard. It covers different metrics such as web traffic overview, total views, content overview, goal value and conversion etc. The best PPT templates are a great way to save time, energy, and resources. Slidegeeks have 100 precent editable powerpoint slides making them incredibly versatile. With these quality presentation templates, you can create a captivating and memorable presentation by combining visually appealing slides and effectively communicating your message. Download SEO Reporting Dashboard To Evaluate Website Rank Mobile Search Engine Optimization Guide Mockup PDF from Slidegeeks and deliver a wonderful presentation.
The following slide outlines a comprehensive KPI dashboard which can be used to analyze the performance of facebook video campaign. It provides information about page video views, page video views organic etc. Retrieve professionally designed KPI Metrics Dashboard To Evaluate Facebook Video Campaign Performance Icons PDF to effectively convey your message and captivate your listeners. Save time by selecting pre-made slideshows that are appropriate for various topics, from business to educational purposes. These themes come in many different styles, from creative to corporate, and all of them are easily adjustable and can be edited quickly. Access them as PowerPoint templates or as Google Slides themes. You do not have to go on a hunt for the perfect presentation because Slidegeeks got you covered from everywhere.


This slide represents talent management dashboards. It includes average time to hire, cost per hire, training cost, talent turnover rate, talent satisfaction etc.Presenting this PowerPoint presentation, titled Dashboard To Evaluate Talent Management Metrics Employee Performance Management Tactics Themes PDF, with topics curated by our researchers after extensive research. This editable presentation is available for immediate download and provides attractive features when used. Download now and captivate your audience. Presenting this Dashboard To Evaluate Talent Management Metrics Employee Performance Management Tactics Themes PDF. Our researchers have carefully researched and created these slides with all aspects taken into consideration. This is a completely customizable Dashboard To Evaluate Talent Management Metrics Employee Performance Management Tactics Themes PDF that is available for immediate downloading. Download now and make an impact on your audience. Highlight the attractive features available with our PPTs.
The purpose of this slide is to outline mobile search engine optimization SEO reporting dashboard. It covers different metrics such as web traffic overview, total views, content overview, goal value and conversion etc. Take your projects to the next level with our ultimate collection of Utilizing SEO To Boost Customer SEO Reporting Dashboard To Evaluate Website Rank Background PDF. Slidegeeks has designed a range of layouts that are perfect for representing task or activity duration, keeping track of all your deadlines at a glance. Tailor these designs to your exact needs and give them a truly corporate look with your own brand colors theyll make your projects stand out from the rest.


This slide represents dashboard to evaluate marketing campaign performance. It includes revenue, sales, total orders, order value, conversion rate etc.Do you have to make sure that everyone on your team knows about any specific topic I yes, then you should give Dashboard To Evaluate Marketing Campaign Performance Ecommerce Marketing Plan To Enhance Microsoft PDF a try. Our experts have put a lot of knowledge and effort into creating this impeccable Dashboard To Evaluate Marketing Campaign Performance Ecommerce Marketing Plan To Enhance Microsoft PDF. You can use this template for your upcoming presentations, as the slides are perfect to represent even the tiniest detail. You can download these templates from the Slidegeeks website and these are easy to edit. So grab these today.


This slide represents talent management dashboards. It includes average time to hire, cost per hire, training cost, talent turnover rate, talent satisfaction etc. Boost your pitch with our creative Dashboard To Evaluate Talent Management Metrics Topics PDF. Deliver an awe inspiring pitch that will mesmerize everyone. Using these presentation templates you will surely catch everyones attention. You can browse the ppts collection on our website. We have researchers who are experts at creating the right content for the templates. So you do not have to invest time in any additional work. Just grab the template now and use them.


Following slide illustrates KPI dashboard to measure brand value. KPIs covered are brand value and percentage change, brand value over time, most followed brands on social media.Take your projects to the next level with our ultimate collection of Brand Value Measuring KPI Dashboard Guide To Understand Evaluate And Enhance Brand Value Slides PDF. Slidegeeks has designed a range of layouts that are perfect for representing task or activity duration, keeping track of all your deadlines at a glance. Tailor these designs to your exact needs and give them a truly corporate look with your own brand colors they all make your projects stand out from the rest


This slide signifies the construction project management projection plan. It covers information regarding to the estimate ID, Task, effort hours, resource quantity, performance factor and duration evaluation. Pitch your topic with ease and precision using this Project KPI Dashboard To Monitor Financial Evaluation Background PDF. This layout presents information on Actual Expenses, Payable Account, Budget Allocated. It is also available for immediate download and adjustment. So, changes can be made in the color, design, graphics or any other component to create a unique layout.


This slide signifies the key performance indicator dashboard to evaluate financial estimation. It covers information regarding to expense, payable account and monthly performance. Showcasing this set of slides titled Project KPI Dashboard To Monitor Financial Budget Evaluation Demonstration PDF. The topics addressed in these templates are Project KPI Dashboard, Monitor Financial Budget Evaluation. All the content presented in this PPT design is completely editable. Download it and make adjustments in color, background, font etc. as per your unique business setting.


The following slide outlines key performance indicator KPI dashboard which can be used to track the social media marketing campaign performance, post implementing automation. It covers information about the social media followers, page impressions, instagram overview, etc.Deliver an awe inspiring pitch with this creative Performance KPI Dashboard To Evaluate Social Media Marketing Performance Post Automation Ideas PDF bundle. Topics like Page Impressions, Twitter Favorites, Instagram Overview can be discussed with this completely editable template. It is available for immediate download depending on the needs and requirements of the user.


This slide represents website promotion dashboard. It covers total visits, average session duration, bounce rate, page views etc.Deliver and pitch your topic in the best possible manner with this Email Promotion Campaign Dashboard For Performance Evaluation Introduce Promotion Plan To Enhance Formats PDF. Use them to share invaluable insights on Investment Revenue, Clicks Campaign, Mails Delivered and impress your audience. This template can be altered and modified as per your expectations. So, grab it now.


This slide represents brand promotion dashboard. It includes sales quantity, return quantity, cost of goods, return amount etc.Deliver an awe inspiring pitch with this creative Brand Promotion Metric Dashboard For Performance Evaluation Brand Promotion Techniques To Enhance Download PDF bundle. Topics like Return Quantity, Net Quantity, Return Amount can be discussed with this completely editable template. It is available for immediate download depending on the needs and requirements of the user.


Mentioned slide showcases merchandising dashboard which can be used to analyze sales performance of various products. It covers metrics such as different types of product sold, revenue earned, payment methods used, sales in different years etc.Showcasing this set of slides titled Retail KPI Dashboard To Evaluate Merchandising Sales Plan Performance Rules PDF. The topics addressed in these templates are Clothing Apparel, Trend Merchandise, Items Sold. All the content presented in this PPT design is completely editable. Download it and make adjustments in color, background, font etc. as per your unique business setting.


This slide represents website promotion dashboard. It covers total visits, average session duration, bounce rate, page views etc.Deliver and pitch your topic in the best possible manner with this Online Promotional Techniques To Increase Email Promotion Campaign Dashboard For Performance Evaluation Themes PDF. Use them to share invaluable insights on Mails Reported, Total Opened, Investment Revenue and impress your audience. This template can be altered and modified as per your expectations. So, grab it now.


This slide represents brand promotion dashboard. It includes sales quantity, return quantity, cost of goods, return amount etc.Deliver an awe inspiring pitch with this creative Online Promotional Techniques To Increase Brand Promotion Metric Dashboard For Performance Evaluation Brochure PDF bundle. Topics like Sales Quantity, Return Quantity, Net Quantity can be discussed with this completely editable template. It is available for immediate download depending on the needs and requirements of the user.
SHOW
- 60
- 120
- 180
DISPLAYING: 60 of 88 Item(s)
Page