 AI PPT Maker
 Templates
 PPT Bundles
 Design Services
 Business PPTs
 Business Plan
 Management
 Strategy
 Introduction PPT
 Roadmap
 Self Introduction
 Timelines
 Process
 Marketing
 Agenda
 Technology
 Medical
 Startup Business Plan
 Cyber Security
 Dashboards
 SWOT
SWOT Proposals
 Education
 Pitch Deck
 Digital Marketing
 KPIs
KPIs Project Management
 Product Management
 Artificial Intelligence
 Target Market
 Communication
 Supply Chain
 Google Slides
 Research Services
 One Pagers
 All Categories
Dashboard representing PowerPoint Presentation Templates and Google Slides
25 Item(s)


Following slide demonstrates KPI dashboard to evaluate business sales performance by different countries to determine future growth opportunities. It includes key components such as actual v or s targeted sales, quarterly sales, location bases sales, annual sales achieved and region based sales shortfalls. Showcasing this set of slides titled Sales Employee Representative Performance Scorecard Dashboard By Different Countries Themes PDF. The topics addressed in these templates are Countries Wise Actual Sales, V Or S Targeted Sales, Annual Sales Achieved, Quarterly Sales Performance, Sales By Geographical Location. All the content presented in this PPT design is completely editable. Download it and make adjustments in color, background, font etc. as per your unique business setting.


This slide showcases sales performance of healthcare products which can be used by managers to evaluate business achievements. It includes key components such as monthly sales comparison, sales performance of products by different channels, sales team performance. Pitch your topic with ease and precision using this Sales Employee Representative Performance Scorecard Dashboard For Healthcare Industry Clipart PDF. This layout presents information on Monthly Sales Comparison, Revenue By Previous Year, Sales Performance, Different Products, Different Channels, Sales Team Performance . It is also available for immediate download and adjustment. So, changes can be made in the color, design, graphics or any other component to create a unique layout.


The slide demonstrates a payment dashboard to measure and manage accounts payable. Various elements included are payable account, overdue, cash on hand, accounts payable funnel, invoice status, etc. Pitch your topic with ease and precision using this Company Payout Dashboard Representing Accounts Payable Data Introduction PDF. This layout presents information on Payable Accounts, Overdue, Invoices By Status, Account Payable Age. It is also available for immediate download and adjustment. So, changes can be made in the color, design, graphics or any other component to create a unique layout.


This slide represents the dashboard representing the key metrics of the vehicle management system to monitor the vehicles and drivers in real-time. It includes key metrics such as service reminders, fuel costs, open issues, recent comments etc. Pitch your topic with ease and precision using this Vehicle Management System Dashboard Representing Maintenance Status Template PDF This layout presents information on Fuel Costs, Total Cost, Service Reminder, Recent Comments. It is also available for immediate download and adjustment. So, changes can be made in the color, design, graphics or any other component to create a unique layout.


This slide represents the KPI dashboard representing PIM data quality statistics. It includes details related to top users, channels, number of entities created etc. Coming up with a presentation necessitates that the majority of the effort goes into the content and the message you intend to convey. The visuals of a PowerPoint presentation can only be effective if it supplements and supports the story that is being told. Keeping this in mind our experts created PIM Software Deployment To Enhance Conversion Rates Product Information Dashboard Representing Data Quality Statistics Download PDF to reduce the time that goes into designing the presentation. This way, you can concentrate on the message while our designers take care of providing you with the right template for the situation.


This slide represents the KPI dashboard to analyze and monitor key metrics of supply chain lead time. It includes details related to inventory to sales, inventory turnover, lead times in days, carrying cost of inventory etc. Pitch your topic with ease and precision using this Supply Chain Management Metrics Dashboard Representing Lead Time Download PDF. This layout presents information on Inventory Accuracy, Carrying Cost Of Inventory. It is also available for immediate download and adjustment. So, changes can be made in the color, design, graphics or any other component to create a unique layout.


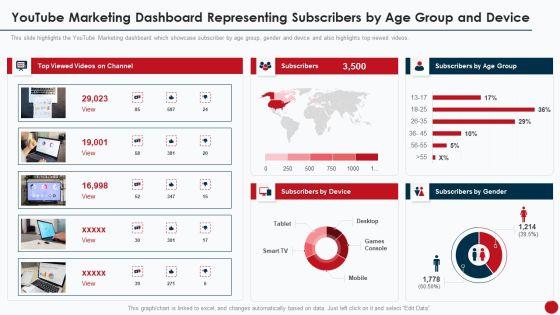
This slide highlights the youtube marketing dashboard which showcase subscriber by age group, gender and device and also highlights top viewed videos.Slidegeeks is one of the best resources for PowerPoint templates. You can download easily and regulate Youtube Marketing Dashboard Representing Subscribers By Age Group And Device Background PDF for your personal presentations from our wonderful collection. A few clicks is all it takes to discover and get the most relevant and appropriate templates. Use our Templates to add a unique zing and appeal to your presentation and meetings. All the slides are easy to edit and you can use them even for advertisement purposes.


This slide highlights the YouTube Marketing dashboard which showcase subscriber by age group, gender and device and also highlights top viewed videos. Deliver and pitch your topic in the best possible manner with this Youtube Advertising Techniques Youtube Marketing Dashboard Representing Subscribers Background PDF. Use them to share invaluable insights on Subscribers Device, Subscribers Gender, Top Viewed, Videos Channel and impress your audience. This template can be altered and modified as per your expectations. So, grab it now.


The following slide highlights the campaign promotion dashboard which highlights the top campaigns, daily impression, click rate and total costs. Pitch your topic with ease and precision using this Online Advertisement Campaign Dashboard Representing Converted Lead And Costs Pictures PDF. This layout presents information on Campaign Funnel, Interaction Cost, Growth. It is also available for immediate download and adjustment. So, changes can be made in the color, design, graphics or any other component to create a unique layout.


The following slide highlights the promotion campaign dashboard which illustrates the campaign impressions, CTR rate, conversions and total amount spent. Showcasing this set of slides titled Advertisement Campaign Dashboard Representing Conversions Target And Value Microsoft PDF. The topics addressed in these templates are Advertisement Campaign, Dashboard Representing, Conversions Target And Value. All the content presented in this PPT design is completely editable. Download it and make adjustments in color, background, font etc. as per your unique business setting.
This slide provides information regarding B2B sales representatives performance tracking dashboard to measure leads by region, revenue breakdown, top performers by leads, revenues, etc. Deliver and pitch your topic in the best possible manner with this B2B Sales Techniques Playbook B2B Sales Representatives Performance Tracking Dashboard Diagrams PDF. Use them to share invaluable insights on Combine Sales, Individual Performance, Achieved Highest and impress your audience. This template can be altered and modified as per your expectations. So, grab it now.
This slide provides information regarding B2B sales representatives performance tracking dashboard to measure leads by region, revenue breakdown, top performers by leads, revenues, etc. Deliver and pitch your topic in the best possible manner with this B2B Sales Representatives Performance Tracking Dashboard Background PDF. Use them to share invaluable insights on Individual Performance, Achieved Highest, Revenue Relative and impress your audience. This template can be altered and modified as per your expectations. So, grab it now.

This slide highlights the YouTube Marketing dashboard which showcase subscriber by age group, gender and device and also highlights top viewed videos.Deliver and pitch your topic in the best possible manner with this Marketing Manual For Product Promotion On Youtube Channel Youtube Marketing Dashboard Representing Subscribers Formats PDF Use them to share invaluable insights on Subscribers Games, Console, Videos Channel and impress your audience. This template can be altered and modified as per your expectations. So, grab it now.
This slide provides information regarding B2B sales representatives performance tracking dashboard to measure leads by region, revenue breakdown, top performers by leads, revenues, etc. Deliver an awe inspiring pitch with this creative B2B Sales Representatives Performance Tracking Dashboard Elements PDF bundle. Topics like Revenue Actual, Sales Representatives Performance, Tracking Dashboard can be discussed with this completely editable template. It is available for immediate download depending on the needs and requirements of the user.


Pitch your topic with ease and precision using this Waterfall Project Management Technique Dashboard Representing Work Status Inspiration PDF. This layout presents information on Risks, Tasks, Budget. It is also available for immediate download and adjustment. So, changes can be made in the color, design, graphics or any other component to create a unique layout.
This slide provides information regarding B2B sales representatives performance tracking dashboard to measure leads by region, revenue breakdown, top performers by leads, revenues, etc. Deliver and pitch your topic in the best possible manner with this Business To Business Account B2B Sales Representatives Performance Tracking Dashboard Demonstration PDF. Use them to share invaluable insights on Top 5 Sales Reps By Revenue Pace, Top 5 Sales Reps By Revenue, Top 5 Sales Reps By Leads and impress your audience. This template can be altered and modified as per your expectations. So, grab it now.


This slide highlights the YouTube Marketing dashboard which showcase subscriber by age group, gender and device and also highlights top viewed videos.Deliver an awe inspiring pitch with this creative Promotion Guide To Advertise Brand On Youtube Youtube Marketing Dashboard Representing Introduction PDF bundle. Topics like Youtube Marketing Dashboard Representing Subscribers By Age Group And Device can be discussed with this completely editable template. It is available for immediate download depending on the needs and requirements of the user.
This slide provides information regarding B2B sales representatives performance tracking dashboard to measure leads by region, revenue breakdown, top performers by leads, revenues, etc. Deliver and pitch your topic in the best possible manner with this b2b sales representatives performance tracking dashboard pictures pdf Use them to share invaluable insights on b2b prospects performance measurement dashboard and impress your audience. This template can be altered and modified as per your expectations. So, grab it now.
This slide provides information regarding B2B sales representatives performance tracking dashboard to measure leads by region, revenue breakdown, top performers by leads, revenues, etc. Deliver and pitch your topic in the best possible manner with this b2b customers journey playbook b2b sales representatives performance tracking dashboard demonstration pdf. Use them to share invaluable insights on b2b sales representatives performance tracking dashboard and impress your audience. This template can be altered and modified as per your expectations. So, grab it now.
This slide provides information regarding B2B sales representatives performance tracking dashboard to measure leads by region, revenue breakdown, top performers by leads, revenues, etc. Deliver and pitch your topic in the best possible manner with this business to business sales playbook b2b sales representatives performance tracking dashboard introduction pdf. Use them to share invaluable insights on b2b sales representatives performance tracking dashboard and impress your audience. This template can be altered and modified as per your expectations. So, grab it now.


Deliver and pitch your topic in the best possible manner with this b2b sales representative insights dashboard sample pdf. Use them to share invaluable insights on sales representative insights dashboardThis slide covers the sales reps dashboard wherein teams contribution to leads, managing SQLs and revenue targets are evaluated. and impress your audience. This template can be altered and modified as per your expectations. So, grab it now.


This slide covers the sales reps dashboard wherein teams contribution to leads, managing SQLs and revenue targets are evaluated.Deliver an awe-inspiring pitch with this creative B2B sales representative insights dashboard ppt summary pdf. bundle. Topics like sales representatives leads actual, sales representatives revenue actual, revenue pace can be discussed with this completely editable template. It is available for immediate download depending on the needs and requirements of the user.
This slide covers the sales reps dashboard wherein teams contribution to leads, managing SQLs and revenue targets are evaluated.Deliver an awe-inspiring pitch with this creative B2B sales representative insights dashboard ppt icon pdf. bundle. Topics like sales representatives leads actual, sales representatives revenue actual, revenue pace can be discussed with this completely editable template. It is available for immediate download depending on the needs and requirements of the user.

The slide showcases dashboard representing statistics related to workforce remote onboarding in organizations. It contains KPIs such as total employees, working remotely , currently working, employee location, employees in department etc. Showcasing this set of slides titled Dashboard Representing Employee Virtual Onboarding Statistics Designs PDF. The topics addressed in these templates are Working Remotely, Currently Working, Employees Department. All the content presented in this PPT design is completely editable. Download it and make adjustments in color, background, font etc. as per your unique business setting.


This slide provides an overview of the dashboard depicting the market share of the company. It also includes brand sales, pricing analysis, market share trend line, etc. This modern and well arranged Leveraging Market Penetration For Increased Awareness Dashboard Representing Actual Market Introduction PDF provides lots of creative possibilities. It is very simple to customize and edit with the Powerpoint Software. Just drag and drop your pictures into the shapes. All facets of this template can be edited with Powerpoint no extra software is necessary. Add your own material, put your images in the places assigned for them, adjust the colors, and then you can show your slides to the world, with an animated slide included.
25 Item(s)