 AI PPT Maker
 Templates
 PPT Bundles
 Design Services
 Business PPTs
 Business Plan
 Management
 Strategy
 Introduction PPT
 Roadmap
 Self Introduction
 Timelines
 Process
 Marketing
 Agenda
 Technology
 Medical
 Startup Business Plan
 Cyber Security
 Dashboards
 SWOT
SWOT Proposals
 Education
 Pitch Deck
 Digital Marketing
 KPIs
KPIs Project Management
 Product Management
 Artificial Intelligence
 Target Market
 Communication
 Supply Chain
 Google Slides
 Research Services
 One Pagers
 All Categories
Dashboard For Measuring PowerPoint Presentation Templates and Google Slides
32 Item(s)


Mentioned slide illustrates customer satisfaction dashboard. It includes information about net promoter score, customer retention rate and customer effort score. From laying roadmaps to briefing everything in detail, our templates are perfect for you. You can set the stage with your presentation slides. All you have to do is download these easy to edit and customizable templates. Enhancing Retail Process By Effective Inventory Management Dashboard For Measuring Customer Satisfaction Pictures PDF will help you deliver an outstanding performance that everyone would remember and praise you for. Do download this presentation today.


Crafting an eye catching presentation has never been more straightforward. Let your presentation shine with this tasteful yet straightforward Smartphone Game Development And Advertising Technique Dashboard For Measuring Unique Visitors Brochure PDF template. It offers a minimalistic and classy look that is great for making a statement. The colors have been employed intelligently to add a bit of playfulness while still remaining professional. Construct the ideal Smartphone Game Development And Advertising Technique Dashboard For Measuring Unique Visitors Brochure PDF that effortlessly grabs the attention of your audience. Begin now and be certain to wow your customers.

Are you in need of a template that can accommodate all of your creative concepts This one is crafted professionally and can be altered to fit any style. Use it with Google Slides or PowerPoint. Include striking photographs, symbols, depictions, and other visuals. Fill, move around, or remove text boxes as desired. Test out color palettes and font mixtures. Edit and save your work, or work with colleagues. Download Smartphone Game Development And Advertising Technique Dashboard For Measuring P2E Web 3 Game Website Information PDF and observe how to make your presentation outstanding. Give an impeccable presentation to your group and make your presentation unforgettable.


The following slide displays a detailed dashboard to measure website performance of P2E web3 based NFT game. It highlights essential elements such as session frequency, visit frequency, content origin etc. This Business Strategy And Promotional Approach For Multiplayer Oriented Mobile Game Dashboard For Measuring Unique Visitors Topics PDF from Slidegeeks makes it easy to present information on your topic with precision. It provides customization options, so you can make changes to the colors, design, graphics, or any other component to create a unique layout. It is also available for immediate download, so you can begin using it right away. Slidegeeks has done good research to ensure that you have everything you need to make your presentation stand out. Make a name out there for a brilliant performance.


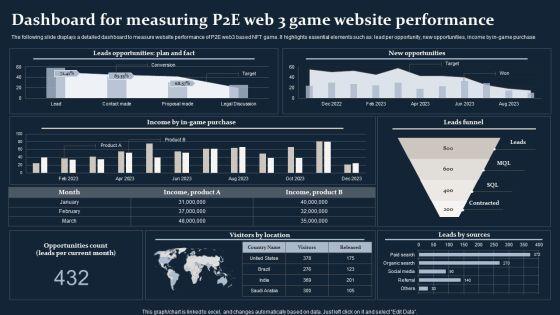
The following slide displays a detailed dashboard to measure website performance of P2E web3 based NFT game. It highlights essential elements such as lead per opportunity, new opportunities, income by in-game purchase Here you can discover an assortment of the finest PowerPoint and Google Slides templates. With these templates, you can create presentations for a variety of purposes while simultaneously providing your audience with an eye catching visual experience. Download Business Strategy And Promotional Approach For Multiplayer Oriented Mobile Game Dashboard For Measuring P2E Web 3 Game Pictures PDF to deliver an impeccable presentation. These templates will make your job of preparing presentations much quicker, yet still, maintain a high level of quality. Slidegeeks has experienced researchers who prepare these templates and write high quality content for you. Later on, you can personalize the content by editing the Business Strategy And Promotional Approach For Multiplayer Oriented Mobile Game Dashboard For Measuring P2E Web 3 Game Pictures PDF.


The following slide helps organization in understanding the effect of their differentiation strategy. It highlight essential metrics such as tickets raised by customer, support status and total unresolved tickets. Coming up with a presentation necessitates that the majority of the effort goes into the content and the message you intend to convey. The visuals of a PowerPoint presentation can only be effective if it supplements and supports the story that is being told. Keeping this in mind our experts created Service Distinctiveness Customer Support Team Dashboard For Measuring Differentiation Mockup PDF to reduce the time that goes into designing the presentation. This way, you can concentrate on the message while our designers take care of providing you with the right template for the situation.


Mentioned slide illustrates customer satisfaction dashboard. It includes information about net promoter score, customer retention rate and customer effort score.. From laying roadmaps to briefing everything in detail, our templates are perfect for you. You can set the stage with your presentation slides. All you have to do is download these easy-to-edit and customizable templates. Optimizing And Managing Retail Dashboard For Measuring Customer Formats PDF will help you deliver an outstanding performance that everyone would remember and praise you for. Do download this presentation today.


This slide represents dashboard to assess and gauge internal communication approaches which benefits industries in assessing strategy, plan gaps and build efficient employee engagement. Elements included in this slide are engagement score, employee satisfaction rate, communication tools and strategies, etc. Showcasing this set of slides titled Dashboard For Measuring And Assessing Communication Tactics Information PDF. The topics addressed in these templates are Employee Engagement, Employee Response Rate, Communication Effectiveness. All the content presented in this PPT design is completely editable. Download it and make adjustments in color, background, font etc. as per your unique business setting.


The following slide displays a detailed dashboard to measure website performance of P2E web3 based NFT game. It highlights essential elements such as session frequency, visit frequency, content origin etc. Do you have to make sure that everyone on your team knows about any specific topic. I yes, then you should give Web 3 0 Blockchain Based P2E Mobile Game Sector Report Promotional Plan Dashboard For Measuring Unique Visitors Information PDF a try. Our experts have put a lot of knowledge and effort into creating this impeccable Web 3 0 Blockchain Based P2E Mobile Game Sector Report Promotional Plan Dashboard For Measuring Unique Visitors Topics PDF. You can use this template for your upcoming presentations, as the slides are perfect to represent even the tiniest detail. You can download these templates from the Slidegeeks website and these are easy to edit. So grab these today.


The following slide displays a detailed dashboard to measure website performance of P2E web3 based NFT game. It highlights essential elements such as lead per opportunity, new opportunities, income by in-game purchase. There are so many reasons you need a Web 3 0 Blockchain Based P2E Mobile Game Sector Report Promotional Plan Dashboard For Measuring P2E Web 3 Game Introduction PDF. The first reason is you cant spend time making everything from scratch, Thus, Slidegeeks has made presentation templates for you too. You can easily download these templates from our website easily.


This slide depicts the dashboard for analyzing marketing campaigns. The purpose of this template is to measure the performance of digital wholesale product promotion. It includes key performance indicators such as sessions, bounce rate, conversion rate, etc. Showcasing this set of slides titled Wholesale Marketing Strategy Dashboard For Measuring Campaign Performance Graphics PDF. The topics addressed in these templates are Total Sessions, Bounce Rate, Stock Availability. All the content presented in this PPT design is completely editable. Download it and make adjustments in color, background, font etc. as per your unique business setting.


This slide covers engineering KPI dashboard to measure performance. It involves KPIs such as cycle time breakdown, risk breakdown, activities on focus and timeline. Pitch your topic with ease and precision using this Engineering Performance Metrics Dashboard For Measuring Performance Download PDF. This layout presents information on Average, Risk Breakdown, Measuring Performance. It is also available for immediate download and adjustment. So, changes can be made in the color, design, graphics or any other component to create a unique layout.


This slide showcases dashboard that can help organization to measure product sales performance after dual branding campaign. Its key components are sales, sales target, gross profit, sales by channel, inventory days outstanding, sales growth etc From laying roadmaps to briefing everything in detail, our templates are perfect for you. You can set the stage with your presentation slides. All you have to do is download these easy to edit and customizable templates. Dashboard For Measuring Product Sales Performance Multi Brand Promotion Campaign For Customer Engagement Professional PDF will help you deliver an outstanding performance that everyone would remember and praise you for. Do download this presentation today.


This slide showcases dashboard that can help organization to measure product sales performance after dual branding campaign. Its key components are sales, sales target, gross profit, sales by channel, inventory days outstanding, sales growth etc. The Dual Branding Campaign To Boost Sales Of Product Or Services Dashboard For Measuring Product Sales Elements PDF is a compilation of the most recent design trends as a series of slides. It is suitable for any subject or industry presentation, containing attractive visuals and photo spots for businesses to clearly express their messages. This template contains a variety of slides for the user to input data, such as structures to contrast two elements, bullet points, and slides for written information. Slidegeeks is prepared to create an impression.


This slide showcases dashboard that can help organization to measure product sales performance after dual branding campaign. Its key components are sales, sales target, gross profit, sales by channel, inventory days outstanding, sales growth etc. This Dashboard For Measuring Product Sales Performance Dual Branding Marketing Campaign Information PDF from Slidegeeks makes it easy to present information on your topic with precision. It provides customization options, so you can make changes to the colors, design, graphics, or any other component to create a unique layout. It is also available for immediate download, so you can begin using it right away. Slidegeeks has done good research to ensure that you have everything you need to make your presentation stand out. Make a name out there for a brilliant performance.


This slide showcases dashboard that can help organization to measure product sales performance after dual branding campaign. Its key components are sales, sales target, gross profit, sales by channel, inventory days outstanding, sales growth etc. Create an editable Developing Dual Branding Campaign For Brand Marketing Dashboard For Measuring Product Sales Performance Clipart PDF that communicates your idea and engages your audience. Whether you are presenting a business or an educational presentation, pre designed presentation templates help save time. Developing Dual Branding Campaign For Brand Marketing Dashboard For Measuring Product Sales Performance Clipart PDF is highly customizable and very easy to edit, covering many different styles from creative to business presentations. Slidegeeks has creative team members who have crafted amazing templates. So, go and get them without any delay.


This slide showcases dashboard that can help organization to measure product sales performance after dual branding campaign. Its key components are sales, sales target, gross profit, sales by channel, inventory days outstanding, sales growth etc. Do you have an important presentation coming up Are you looking for something that will make your presentation stand out from the rest Look no further than Dashboard For Measuring Product Sales Performance Dual Branding Campaign For Product Promotion Microsoft PDF. With our professional designs, you can trust that your presentation will pop and make delivering it a smooth process. And with Slidegeeks, you can trust that your presentation will be unique and memorable. So why wait Grab Dashboard For Measuring Product Sales Performance Dual Branding Campaign For Product Promotion Microsoft PDF today and make your presentation stand out from the rest.


This slide represents ecommerce dashboard showcasing marketing performance. It includes sales breakdown, net revenue through channels, sales forecast, sales funnel etc.Find highly impressive KPI Dashboard For Measuring Ecommerce Marketing Ecommerce Marketing Plan To Enhance Brochure PDF on Slidegeeks to deliver a meaningful presentation. You can save an ample amount of time using these presentation templates. No need to worry to prepare everything from scratch because Slidegeeks experts have already done a huge research and work for you. You need to download KPI Dashboard For Measuring Ecommerce Marketing Ecommerce Marketing Plan To Enhance Brochure PDF for your upcoming presentation. All the presentation templates are 100precent editable and you can change the color and personalize the content accordingly. Download now.


Purpose of the following slide is to display a dashboard to help analyze the marketing efforts through essential metrics such as the revenue generated, average revenue generated per unit etc. Deliver an awe inspiring pitch with this creative Organic Business Growth Strategies Dashboard For Measuring Success Of Our Marketing Efforts Diagrams PDF bundle. Topics like Average Revenue, Customer Lifetime Value, Customer Acquisition Cost can be discussed with this completely editable template. It is available for immediate download depending on the needs and requirements of the user.


The following slide helps organization in understanding the effect of their differentiation efforts. It highlight essential metrics such as total product revenue, online vs. offline purchase etc. Deliver an awe inspiring pitch with this creative Product Performance Dashboard For Measuring Differentiation Strategy Efforts Diagrams PDF bundle. Topics like Product, Incremental Sales, Cost Of Goods can be discussed with this completely editable template. It is available for immediate download depending on the needs and requirements of the user.


The following slide helps organization in understanding the effect of their differentiation strategy. It highlight essential metrics such as brand awareness, advertising awareness market share etc. Deliver and pitch your topic in the best possible manner with this Differentiation Techniques Ways To Surpass Competitors Differentiation And Brand Awareness Dashboard For Measuring Efforts Template PDF. Use them to share invaluable insights on Brand Awareness, Brand Metrics, Advertising Metrics and impress your audience. This template can be altered and modified as per your expectations. So, grab it now.


The following slide helps organization in understanding the effect of their differentiation strategy. It highlight essential metrics such as tickets raised by customer, support status and total unresolved tickets. Deliver an awe inspiring pitch with this creative Customer Support Team Dashboard For Measuring Differentiation Efforts Formats PDF bundle. Topics like Customer Support Team Dashboard, Measuring Differentiation Efforts can be discussed with this completely editable template. It is available for immediate download depending on the needs and requirements of the user.


This slide shows KPI dashboard for measuring information technology business performance which can be referred by technical organizations to analyze their annual performance. It includes information about monthly recurring revenue, customer acquisition cost, signups and paying customers, visitors and signups, runway, etc. Showcasing this set of slides titled KPI Dashboard For Measuring Information Technology Business Performance Designs PDF. The topics addressed in these templates are Signups And Paying, Customers Monthly Growth, Visitors And Signups, Monthly Average Revenue. All the content presented in this PPT design is completely editable. Download it and make adjustments in color, background, font etc. as per your unique business setting.


his slide represents the support team performance dashboard that includes unassigned, open, solved, escalated, occupancy rate, top agen ts, net promoter score, average first contact resolution rate, etc.This is a improving employee performance management system in organization dashboard for measuring support graphics pdf template with various stages. Focus and dispense information on one stage using this creative set, that comes with editable features. It contains large content boxes to add your information on topics like dashboard for measuring support team performance You can also showcase facts, figures, and other relevant content using this PPT layout. Grab it now.


Mentioned slide delineates research program dashboard which can be used by marketers for measuring brand awareness. This dashboard includes various elements such as celebrity analysis, top branding themes etc. Pitch your topic with ease and precision using this market research project dashboard for measuring brand awareness rules pdf. This layout presents information on brand awareness, celebrity analysis, advertisement. It is also available for immediate download and adjustment. So, changes can be made in the color, design, graphics or any other component to create a unique layout.


This slide defines the CSAT customer satisfaction score used to analyze customer experience on digital platforms. It includes information related to features and the improvement score compared to past year. Pitch your topic with ease and precision using this Customer Analysis Dashboard For Measuring Satisfaction Enhancement Microsoft PDF. This layout presents information on Net Promoter, Customer Satisfaction, Very Unsatisfied. It is also available for immediate download and adjustment. So, changes can be made in the color, design, graphics or any other component to create a unique layout.


This slide represents ecommerce dashboard showcasing marketing performance. It includes sales breakdown, net revenue through channels, sales forecast, sales funnel etc. Slidegeeks is here to make your presentations a breeze with Strategic Guide For Mastering E Commerce Marketing Kpi Dashboard For Measuring E Commerce Marketing Performance Infographics PDF With our easy to use and customizable templates, you can focus on delivering your ideas rather than worrying about formatting. With a variety of designs to choose from, you are sure to find one that suits your needs. And with animations and unique photos, illustrations, and fonts, you can make your presentation pop. So whether you are giving a sales pitch or presenting to the board, make sure to check out Slidegeeks first.

This slide provides a dashboard for measuring key performance indicators of a IT service provider. Key components are ROI, weekly revenue, successful cloud deployments, service type used, monthly visitors and net promoter score. Showcasing this set of slides titled Dashboard For Measuring Information Technology Framework Service Performance Ideas PDF. The topics addressed in these templates are Service Type Used, Weekly Revenue, Net Promoter Score. All the content presented in this PPT design is completely editable. Download it and make adjustments in color, background, font etc. as per your unique business setting.
32 Item(s)