 AI PPT Maker
 Templates
 PPT Bundles
 Design Services
 Business PPTs
 Business Plan
 Management
 Strategy
 Introduction PPT
 Roadmap
 Self Introduction
 Timelines
 Process
 Marketing
 Agenda
 Technology
 Medical
 Startup Business Plan
 Cyber Security
 Dashboards
 SWOT
SWOT Proposals
 Education
 Pitch Deck
 Digital Marketing
 KPIs
KPIs Project Management
 Product Management
 Artificial Intelligence
 Target Market
 Communication
 Supply Chain
 Google Slides
 Research Services
 One Pagers
 All Categories
Dashboard depicting PowerPoint Presentation Templates and Google Slides
SHOW
- 60
- 120
- 180
DISPLAYING: 60 of 142 Item(s)
Page
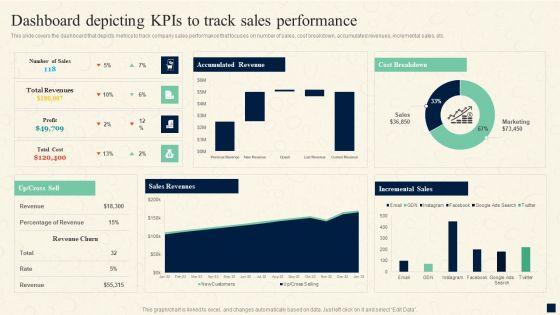
This slide covers the dashboard that depicts metrics to track company sales performance that focuses on number of sales, cost breakdown, accumulated revenues, incremental sales, etc. Boost your pitch with our creative Implementing Change Management Strategy To Transform Business Processes Dashboard Depicting Kpis To Track Icons PDF. Deliver an awe-inspiring pitch that will mesmerize everyone. Using these presentation templates you will surely catch everyones attention. You can browse the ppts collection on our website. We have researchers who are experts at creating the right content for the templates. So you do not have to invest time in any additional work. Just grab the template now and use them.


This slide consists of a dashboard that can be used to depict the success of a B2B communication rollout. Key performing indicators included in the slide are products sold, total revenue, client satisfaction, net profit, etc. Showcasing this set of slides titled Dashboard To Depict Strategic B2B Communication Rollout Plan Success Portrait PDF. The topics addressed in these templates are Product Sold, Total Revenue, B2b Client Satisfication. All the content presented in this PPT design is completely editable. Download it and make adjustments in color, background, font etc. as per your unique business setting.


Risk Control And Surveillance Dashboard Depicting Status Of The Risks Faced By Business Elements PDF
This slide provides an overview of the dashboard that showcase the business risks and their status. The dashboard includes risk map, level and types. The best PPT templates are a great way to save time, energy, and resources. Slidegeeks have 100 percent editable powerpoint slides making them incredibly versatile. With these quality presentation templates, you can create a captivating and memorable presentation by combining visually appealing slides and effectively communicating your message. Download Risk Control And Surveillance Dashboard Depicting Status Of The Risks Faced By Business Elements PDF from Slidegeeks and deliver a wonderful presentation.


This slide shows the dashboard that depicts website data insights which covers channels such as display, social and email with total sessions, pages, average session duration, bounce rate, goal completion. Are you in need of a template that can accommodate all of your creative concepts This one is crafted professionally and can be altered to fit any style. Use it with Google Slides or PowerPoint. Include striking photographs, symbols, depictions, and other visuals. Fill, move around, or remove text boxes as desired. Test out color palettes and font mixtures. Edit and save your work, or work with colleagues. Download Brand Development Techniques To Increase Revenues Dashboard Depicting Website Data Diagrams PDF and observe how to make your presentation outstanding. Give an impeccable presentation to your group and make your presentation unforgettable.


This slide showcases dashboard depicting major customer service KPIs. The performance metrics covered are search exit rate, CSAT, average first response time, tickets solved, etc. Retrieve professionally designed Action Plan To Enhance Client Service Dashboard Depicting Performance Metrics Sample PDF to effectively convey your message and captivate your listeners. Save time by selecting pre made slideshows that are appropriate for various topics, from business to educational purposes. These themes come in many different styles, from creative to corporate, and all of them are easily adjustable and can be edited quickly. Access them as PowerPoint templates or as Google Slides themes. You do not have to go on a hunt for the perfect presentation because Slidegeeks got you covered from everywhere.


This slide showcases dashboard depicting major customer service KPIs. The performance metrics covered are search exit rate, CSAT, average first response time, tickets solved, etc. Take your projects to the next level with our ultimate collection of Dashboard Depicting Performance Metrics Of Customer Service Template PDF. Slidegeeks has designed a range of layouts that are perfect for representing task or activity duration, keeping track of all your deadlines at a glance. Tailor these designs to your exact needs and give them a truly corporate look with your own brand colors they will make your projects stand out from the rest.


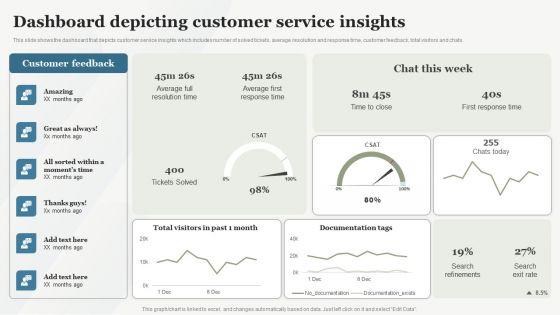
This slide shows the dashboard that depicts customer service insights which includes number of solved tickets, average resolution and response time, customer feedback, total visitors and chats. Coming up with a presentation necessitates that the majority of the effort goes into the content and the message you intend to convey. The visuals of a PowerPoint presentation can only be effective if it supplements and supports the story that is being told. Keeping this in mind our experts created Tactical Communication Plan Dashboard Depicting Customer Service Insights Graphics PDF to reduce the time that goes into designing the presentation. This way, you can concentrate on the message while our designers take care of providing you with the right template for the situation.


This slide shows the dashboard that depicts website data insights which covers channels such as display, social and email with total sessions, pages, average session duration, bounce rate, goal completion. There are so many reasons you need a Identifying And Increasing Brand Awareness Dashboard Depicting Website Data Insights Rules PDF. The first reason is you can not spend time making everything from scratch, Thus, Slidegeeks has made presentation templates for you too. You can easily download these templates from our website easily.
This slide covers the dashboard that depicts metrics to track company sales performance that focuses on number of sales, cost breakdown, accumulated revenues, incremental sales, etc. From laying roadmaps to briefing everything in detail, our templates are perfect for you. You can set the stage with your presentation slides. All you have to do is download these easy-to-edit and customizable templates. Change Management Process Dashboard Depicting Kpis To Track Sales Performance Introduction PDF will help you deliver an outstanding performance that everyone would remember and praise you for. Do download this presentation today.

This slide shows the dashboard that depicts customer service insights which includes number of solved tickets, average resolution and response time, customer feedback, total visitors and chats. There are so many reasons you need a Enhancing Client Engagement Dashboard Depicting Customer Service Insights Structure PDF. The first reason is you cant spend time making everything from scratch, Thus, Slidegeeks has made presentation templates for you too. You can easily download these templates from our website easily.


This slide showcases dashboard depicting major customer service KPIs. The performance metrics covered are search exit rate, CSAT, average first response time, tickets solved, etc. Formulating a presentation can take up a lot of effort and time, so the content and message should always be the primary focus. The visuals of the PowerPoint can enhance the presenters message, so our Techniques To Optimize UX Dashboard Depicting Performance Metrics Of Customer Clipart PDF was created to help save time. Instead of worrying about the design, the presenter can concentrate on the message while our designers work on creating the ideal templates for whatever situation is needed. Slidegeeks has experts for everything from amazing designs to valuable content, we have put everything into Techniques To Optimize UX Dashboard Depicting Performance Metrics Of Customer Clipart PDF.


Customer Service Plan To Improve Sales Dashboard Depicting Customer Service Insights Inspiration PDF
This slide shows the dashboard that depicts customer service insights which includes number of solved tickets, average resolution and response time, customer feedback, total visitors and chats. If you are looking for a format to display your unique thoughts, then the professionally designed Customer Service Plan To Improve Sales Dashboard Depicting Customer Service Insights Inspiration PDF is the one for you. You can use it as a Google Slides template or a PowerPoint template. Incorporate impressive visuals, symbols, images, and other charts. Modify or reorganize the text boxes as you desire. Experiment with shade schemes and font pairings. Alter, share or cooperate with other people on your work. Download Customer Service Plan To Improve Sales Dashboard Depicting Customer Service Insights Inspiration PDF and find out how to give a successful presentation. Present a perfect display to your team and make your presentation unforgettable.
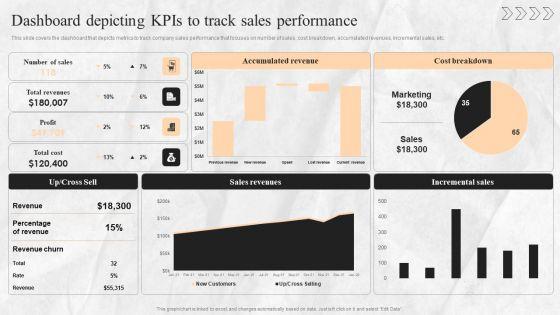

This slide covers the dashboard that depicts metrics to track company sales performance that focuses on number of sales, cost breakdown, accumulated revenues, incremental sales, etc. Are you in need of a template that can accommodate all of your creative concepts This one is crafted professionally and can be altered to fit any style. Use it with Google Slides or PowerPoint. Include striking photographs, symbols, depictions, and other visuals. Fill, move around, or remove text boxes as desired. Test out color palettes and font mixtures. Edit and save your work, or work with colleagues. Download Digital Transition Plan For Managing Business Dashboard Depicting Kpis To Track Sales Performance Guidelines PDF and observe how to make your presentation outstanding. Give an impeccable presentation to your group and make your presentation unforgettable.


Mentioned slide outlines key performance indicator KPI dashboard which can be used by call center to optimize the agents performance. The major metrics covered in the template are total calls, average speed of answer, abandon rate, service level agreement SLA limit etc. Pitch your topic with ease and precision using this Metrics Dashboard Depicting Call Center Performance Pictures PDF. This layout presents information on Overall Satisfaction Score, Satisfaction Score, Performance. It is also available for immediate download and adjustment. So, changes can be made in the color, design, graphics or any other component to create a unique layout.


This slide showcases dashboard depicting major customer service KPIs. The performance metrics covered are search exit rate, CSAT, average first response time, tickets solved, etc. There are so many reasons you need a Enhancing Client Experience Dashboard Depicting Performance Metrics Of Customer Service Structure PDF. The first reason is you cant spend time making everything from scratch, Thus, Slidegeeks has made presentation templates for you too. You can easily download these templates from our website easily.

This slide showcases dashboard depicting major customer service KPIs. The performance metrics covered are search exit rate, CSAT, average first response time, tickets solved, etc. There are so many reasons you need a Enhance Customer Engagement Through After Sales Activities Dashboard Depicting Performance Metrics Formats PDF. The first reason is you can not spend time making everything from scratch, Thus, Slidegeeks has made presentation templates for you too. You can easily download these templates from our website easily.


This slide provides an overview of customer feedback survey conducted to evaluate their satisfaction level. It includes description, steps and benefits which are measure customer satisfaction This modern and well arranged Service Improvement Techniques For Client Retention Dashboard Depicting Performance Metrics Diagrams PDF provides lots of creative possibilities. It is very simple to customize and edit with the Powerpoint Software. Just drag and drop your pictures into the shapes. All facets of this template can be edited with Powerpoint no extra software is necessary. Add your own material, put your images in the places assigned for them, adjust the colors, and then you can show your slides to the world, with an animated slide included.


This slide covers the dashboard that depicts metrics to track company sales performance that focuses on number of sales, cost breakdown, accumulated revenues, incremental sales, etc. From laying roadmaps to briefing everything in detail, our templates are perfect for you. You can set the stage with your presentation slides. All you have to do is download these easy-to-edit and customizable templates. Transition Plan For Business Management Dashboard Depicting Kpis To Track Sales Performance Template PDF will help you deliver an outstanding performance that everyone would remember and praise you for. Do download this presentation today.


This slide covers the dashboard that depicts metrics to track company sales performance that focuses on number of sales, cost breakdown, accumulated revenues, incremental sales, etc.If you are looking for a format to display your unique thoughts, then the professionally designed Dashboard Depicting Kpis To Track Sales Performance Integrating Technology To Transform Change Portrait PDF is the one for you. You can use it as a Google Slides template or a PowerPoint template. Incorporate impressive visuals, symbols, images, and other charts. Modify or reorganize the text boxes as you desire. Experiment with shade schemes and font pairings. Alter, share or cooperate with other people on your work. Download Dashboard Depicting Kpis To Track Sales Performance Integrating Technology To Transform Change Portrait PDF and find out how to give a successful presentation. Present a perfect display to your team and make your presentation unforgettable.

This slide shows the dashboard that depicts customer service insights which includes number of solved tickets, average resolution and response time, customer feedback, total visitors and chats. There are so many reasons you need a Boosting Customer Base Through Effective Dashboard Depicting Customer Service Insights Diagrams PDF. The first reason is you cant spend time making everything from scratch, Thus, Slidegeeks has made presentation templates for you too. You can easily download these templates from our website easily.


Showcasing this set of slides titled Dashboard Depicting Impact Of Workplace Diversity And Inclusion Strategy Implementation Summary PDF. The topics addressed in these templates are Hiring By Gender, Hiring By Ethnicity. All the content presented in this PPT design is completely editable. Download it and make adjustments in color, background, font etc. as per your unique business setting.


This slide consists of a Dashboard which can be used by managers to depict robot utilization in attended automation. Key performance indicators relate to total utilization, robot types, hours saved etc. Pitch your topic with ease and precision using this Dashboard To Depict Robot Utilization In Robotic Desktop Automation Download PDF. This layout presents information on Dashboard, Depict Robot Utilization, Robotic Desktop Automation. It is also available for immediate download and adjustment. So, changes can be made in the color, design, graphics or any other component to create a unique layout.


This slide shows the dashboard that depicts customer retention analytics which includes net promoter score, customer loyalty rate, customer lifetime value, customer and revenue churn, monthly recurring revenue growth, etc. Get a simple yet stunning designed Managing Customer Attrition Dashboard Depicting Customer Retention Analytics Formats PDF. It is the best one to establish the tone in your meetings. It is an excellent way to make your presentations highly effective. So, download this PPT today from Slidegeeks and see the positive impacts. Our easy-to-edit Managing Customer Attrition Dashboard Depicting Customer Retention Analytics Formats PDF can be your go-to option for all upcoming conferences and meetings. So, what are you waiting for Grab this template today.


This slide shows the dashboard that depicts website data insights which covers channels such as display, social and email with total sessions, pages, average session duration, bounce rate, goal completion. Coming up with a presentation necessitates that the majority of the effort goes into the content and the message you intend to convey. The visuals of a PowerPoint presentation can only be effective if it supplements and supports the story that is being told. Keeping this in mind our experts created Boosting Product Sales Through Branding Dashboard Depicting Website Data Brochure PDF to reduce the time that goes into designing the presentation. This way, you can concentrate on the message while our designers take care of providing you with the right template for the situation.


This slide shows the dashboard that depicts customer retention analytics which includes net promoter score, customer loyalty rate, customer lifetime value, customer and revenue churn, monthly recurring revenue growth, etc. Make sure to capture your audiences attention in your business displays with our gratis customizable Dashboard Depicting Customer Retention Analytics Background PDF. These are great for business strategies, office conferences, capital raising or task suggestions. If you desire to acquire more customers for your tech business and ensure they stay satisfied, create your own sales presentation with these plain slides.


This slide shows the dashboard that depicts website data insights which covers channels such as display, social and email with total sessions, pages, average session duration, bounce rate, goal completion. Get a simple yet stunning designed Implementing Brand Development Dashboard Depicting Website Data Insights Guidelines PDF. It is the best one to establish the tone in your meetings. It is an excellent way to make your presentations highly effective. So, download this PPT today from Slidegeeks and see the positive impacts. Our easy-to-edit Implementing Brand Development Dashboard Depicting Website Data Insights Guidelines PDF can be your go-to option for all upcoming conferences and meetings. So, what are you waiting for Grab this template today.


This slide shows the dashboard that depicts website data insights which covers channels such as display, social and email with total sessions, pages, average session duration, bounce rate, goal completion. Coming up with a presentation necessitates that the majority of the effort goes into the content and the message you intend to convey. The visuals of a PowerPoint presentation can only be effective if it supplements and supports the story that is being told. Keeping this in mind our experts created Echniques To Enhance Brand Dashboard Depicting Website Data Insights Clipart PDF to reduce the time that goes into designing the presentation. This way, you can concentrate on the message while our designers take care of providing you with the right template for the situation.


This slide shows the dashboard that depicts customer retention analytics which includes net promoter score, customer loyalty rate, customer lifetime value, customer and revenue churn, monthly recurring revenue growth, etc. From laying roadmaps to briefing everything in detail, our templates are perfect for you. You can set the stage with your presentation slides. All you have to do is download these easy-to-edit and customizable templates. Reducing Customer Turnover Rates Dashboard Depicting Customer Retention Brochure PDF will help you deliver an outstanding performance that everyone would remember and praise you for. Do download this presentation today.


This slide shows the dashboard that depicts customer retention analytics which includes net promoter score, customer loyalty rate, customer lifetime value, customer and revenue churn, monthly recurring revenue growth, etc. Slidegeeks is here to make your presentations a breeze with Techniques To Decrease Customer Dashboard Depicting Customer Retention Analytics Microsoft PDF With our easy-to-use and customizable templates, you can focus on delivering your ideas rather than worrying about formatting. With a variety of designs to choose from, youre sure to find one that suits your needs. And with animations and unique photos, illustrations, and fonts, you can make your presentation pop. So whether youre giving a sales pitch or presenting to the board, make sure to check out Slidegeeks first.


This slide covers the dashboard that depicts metrics to track company sales performance that focuses on number of sales, cost breakdown, accumulated revenues, incremental sales, etc. From laying roadmaps to briefing everything in detail, our templates are perfect for you. You can set the stage with your presentation slides. All you have to do is download these easy-to-edit and customizable templates. Change Management Strategy Dashboard Depicting Kpis To Track Sales Performance Ideas PDF will help you deliver an outstanding performance that everyone would remember and praise you for. Do download this presentation today.


This slide shows the dashboard that depicts customer retention analytics which includes net promoter score, customer loyalty rate, customer lifetime value, customer and revenue churn, monthly recurring revenue growth, etc. Make sure to capture your audiences attention in your business displays with our gratis customizable CRM Administration To Reduce Churn Rate Dashboard Depicting Customer Retention Analytics Themes PDF. These are great for business strategies, office conferences, capital raising or task suggestions. If you desire to acquire more customers for your tech business and ensure they stay satisfied, create your own sales presentation with these plain slides.


This slide shows the dashboard that depicts the metrics used for measuring digital marketing campaign that covers bounce rate, pageviews, conversions, social media followers, etc. Presenting this PowerPoint presentation, titled Dashboard Depicting Metrics Of Digital Marketing Campaign Guidelines PDF, with topics curated by our researchers after extensive research. This editable presentation is available for immediate download and provides attractive features when used. Download now and captivate your audience. Presenting this Dashboard Depicting Metrics Of Digital Marketing Campaign Guidelines PDF. Our researchers have carefully researched and created these slides with all aspects taken into consideration. This is a completely customizable Dashboard Depicting Metrics Of Digital Marketing Campaign Guidelines PDF that is available for immediate downloading. Download now and make an impact on your audience. Highlight the attractive features available with our PPTs.


This slide shows the dashboard that depicts the metrics used for measuring digital marketing campaign that covers bounce rate, pageviews, conversions, social media followers, etc. Presenting this PowerPoint presentation, titled Dashboard Depicting Metrics Of Digital Marketing Campaign Topics PDF, with topics curated by our researchers after extensive research. This editable presentation is available for immediate download and provides attractive features when used. Download now and captivate your audience. Presenting this Dashboard Depicting Metrics Of Digital Marketing Campaign Topics PDF. Our researchers have carefully researched and created these slides with all aspects taken into consideration. This is a completely customizable Dashboard Depicting Metrics Of Digital Marketing Campaign Topics PDF that is available for immediate downloading. Download now and make an impact on your audience. Highlight the attractive features available with our PPTs.


This slide showcases dashboard depicting major customer service KPIs. The performance metrics covered are search exit rate, CSAT, average first response time, tickets solved, etc. Coming up with a presentation necessitates that the majority of the effort goes into the content and the message you intend to convey. The visuals of a PowerPoint presentation can only be effective if it supplements and supports the story that is being told. Keeping this in mind our experts created Customer Support Services Dashboard Depicting Performance Metrics Of Customer Designs PDF to reduce the time that goes into designing the presentation. This way, you can concentrate on the message while our designers take care of providing you with the right template for the situation.


Do you have to make sure that everyone on your team knows about any specific topic. I yes, then you should give Successful Branding Technique For Electronic Commerce Corporation Dashboard Depicting Website Data Insights Microsoft PDF a try. Our experts have put a lot of knowledge and effort into creating this impeccable Successful Branding Technique For Electronic Commerce Corporation Dashboard Depicting Website Data Insights Microsoft PDF. You can use this template for your upcoming presentations, as the slides are perfect to represent even the tiniest detail. You can download these templates from the Slidegeeks website and these are easy to edit. So grab these today.


This slide represents the procurement cost summary dashboard illustrating purchase order, cost reduction, savings, avoidance, return on investment, suppliers, procurement ROI etc. Pitch your topic with ease and precision using this Dashboard Depicting Procurement Cost Summary Report Microsoft PDF. This layout presents information on Purchase Order Cost, Cost Reduction, Cost Savings. It is also available for immediate download and adjustment. So, changes can be made in the color, design, graphics or any other component to create a unique layout.
This slide shows dashboard that depicts metrics to measure customer experience that covers net revenue, customer retention, abandonment, unique visitors, etc. Find highly impressive Action Plan To Enhance Dashboard Depicting Metrics To Measure Customer Icons PDF on Slidegeeks to deliver a meaningful presentation. You can save an ample amount of time using these presentation templates. No need to worry to prepare everything from scratch because Slidegeeks experts have already done a huge research and work for you. You need to download Action Plan To Enhance Dashboard Depicting Metrics To Measure Customer Icons PDF for your upcoming presentation. All the presentation templates are 100 percent editable and you can change the color and personalize the content accordingly. Download now
This slide shows the dashboard that depicts customer retention analytics which includes net promoter score, customer loyalty rate, customer lifetime value, customer and revenue churn, monthly recurring revenue growth, etc. Slidegeeks is one of the best resources for PowerPoint templates. You can download easily and regulate Implementing CRM To Optimize Dashboard Depicting Customer Retention Analytics Icons PDF for your personal presentations from our wonderful collection. A few clicks is all it takes to discover and get the most relevant and appropriate templates. Use our Templates to add a unique zing and appeal to your presentation and meetings. All the slides are easy to edit and you can use them even for advertisement purposes.


This slide focuses on project management dashboard which covers the project name, status date overall status, monthly schedule such as analysis, development, quality assurance, user acceptance, pre production and support with actual and planned budget, pending decisions and actions, etc. Get a simple yet stunning designed Procedure To Establish Project Administration Program Dashboard Depicting Project Associated Risks And Issues Mockup PDF. It is the best one to establish the tone in your meetings. It is an excellent way to make your presentations highly effective. So, download this PPT today from Slidegeeks and see the positive impacts. Our easy to edit Procedure To Establish Project Administration Program Dashboard Depicting Project Associated Risks And Issues Mockup PDF can be your go to option for all upcoming conferences and meetings. So, what are you waiting for. Grab this template today.


This slide shows the dashboard that depicts supply chain metrics such as total net sales, supply chain expenses, average cash to cash cycle in days, carrying costs of inventory, etc. Coming up with a presentation necessitates that the majority of the effort goes into the content and the message you intend to convey. The visuals of a PowerPoint presentation can only be effective if it supplements and supports the story that is being told. Keeping this in mind our experts created Optimizing Logistics Models To Enhance Supply Chain Management Dashboard Depicting Supply Chain Metrics Download PDF to reduce the time that goes into designing the presentation. This way, you can concentrate on the message while our designers take care of providing you with the right template for the situation.


This slide represents dashboard for marketing analytics report. It covers revenues, campaign cost, lead conversion rate, average lead acquisition cost, return on investment by advertisement campaign etc. Pitch your topic with ease and precision using this Marketing Campaign Dashboard Depicting Marketing Analytics Ppt Summary Infographics PDF. This layout presents information on ROI Ads Campaign, Rate Of Return, Various Locations. It is also available for immediate download and adjustment. So, changes can be made in the color, design, graphics or any other component to create a unique layout.


This slide represents dashboard for advertising campaign report .It includes social media costs , clicks , cost per action , conversions to help businesses in increasing sales of products and services. Showcasing this set of slides titled Dashboard Depicting Digital Advertising Marketing Campaign Ppt Summary Elements PDF. The topics addressed in these templates are Social Media Cost, Social Media Clicks, Adwords Clicks, Adwords Cost . All the content presented in this PPT design is completely editable. Download it and make adjustments in color, background, font etc. as per your unique business setting.


This slide shows the dashboard that depicts website data insights which covers channels such as display, social and email with total sessions, pages, average session duration, bounce rate, goal completion.Do you have to make sure that everyone on your team knows about any specific topic I yes, then you should give Dashboard Depicting Website Data Insights Creating Branding Techniques To Increase Brand Awareness Structure PDF a try. Our experts have put a lot of knowledge and effort into creating this impeccable Dashboard Depicting Website Data Insights Creating Branding Techniques To Increase Brand Awareness Structure PDF. You can use this template for your upcoming presentations, as the slides are perfect to represent even the tiniest detail. You can download these templates from the Slidegeeks website and these are easy to edit. So grab these today.


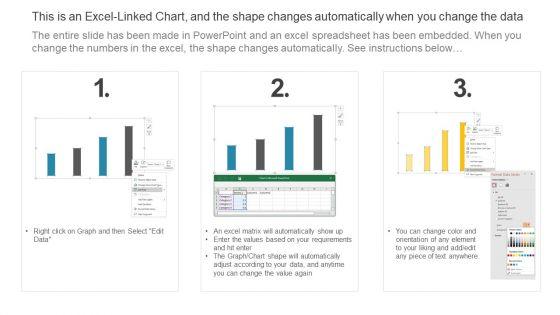
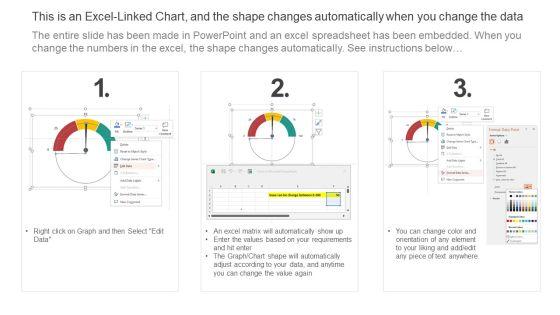
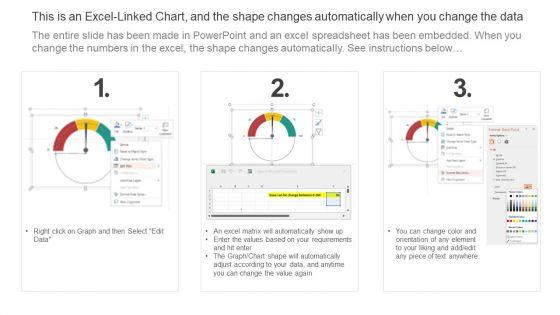
This graph or chart is linked to excel, and changes automatically based on data. Just left click on it and select Edit Data. Showcasing this set of slides titled Dashboard Depicting Security Problem Management Metrics Ppt Gallery Designs PDF. The topics addressed in these templates are Percentage, New Critical, Security Incidents. All the content presented in this PPT design is completely editable. Download it and make adjustments in color, background, font etc. as per your unique business setting.


This slide depicts the dashboard showing metrics to measure social media recruitment status which covers sourcing status, bounce rate, filled positions, recruitment expenses, cost per hire, top referrers, etc.The best PPT templates are a great way to save time, energy, and resources. Slidegeeks have 100 Precent editable powerpoint slides making them incredibly versatile. With these quality presentation templates, you can create a captivating and memorable presentation by combining visually appealing slides and effectively communicating your message. Download Dashboard Depicting Social Media Recruitment Metrics Enhancing Social Media Recruitment Process Slides PDF from Slidegeeks and deliver a wonderful presentation.


This slide shows the dashboard that depicts the metrics used for measuring digital marketing campaign that covers bounce rate, pageviews, conversions, social media followers, etc.Slidegeeks is one of the best resources for PowerPoint templates. You can download easily and regulate Dashboard Depicting Metrics Of Digital Marketing Campaign Digital Marketing Strategy Deployment Clipart PDF for your personal presentations from our wonderful collection. A few clicks is all it takes to discover and get the most relevant and appropriate templates. Use our Templates to add a unique zing and appeal to your presentation and meetings. All the slides are easy to edit and you can use them even for advertisement purposes.


This slide focuses on dashboard that depicts sales and customer analytics which covers sales revenue, average transaction rate, out of stock items, sales by division, monthly visitors, etc. Make sure to capture your audiences attention in your business displays with our gratis customizable Dashboard Depicting Sales And Customer Analytics Professional PDF. These are great for business strategies, office conferences, capital raising or task suggestions. If you desire to acquire more customers for your tech business and ensure they stay satisfied, create your own sales presentation with these plain slides.


This slide focuses on dashboard that depicts sales and customer analytics which covers sales revenue, average transaction rate, out of stock items, sales by division, monthly visitors, etc. Make sure to capture your audiences attention in your business displays with our gratis customizable Deploy Merchandise Program To Enhance Sales Dashboard Depicting Sales And Customer Analytics Sample PDF. These are great for business strategies, office conferences, capital raising or task suggestions. If you desire to acquire more customers for your tech business and ensure they stay satisfied, create your own sales presentation with these plain slides.


This slide shows dashboard depicting client and employee net promoter score NPS. It contains information about customer refer probability, recent service review and repeated use of service. Showcasing this set of slides titled Dashboard Depicting Client And Employee Customer NPS Metric Ppt Gallery Deck PDF. The topics addressed in these templates are Client NPS, Employee NPS, Customer Probability. All the content presented in this PPT design is completely editable. Download it and make adjustments in color, background, font etc. as per your unique business setting.


This slide shows profiling report dashboard depicting attributes of data quality which can help in accessing the processing speed and yearly analysis of data performance. It contains information about overall score, rows processed, failed rows, comprehensiveness, efficiency, legitimacy, precision, regularity, exceptionality, etc. Pitch your topic with ease and precision using this Profiling Report Dashboard Depicting Attributes Of Data Quality Themes PDF. This layout presents information on Comprehensiveness, Efficiency, Legitimacy, Precision. It is also available for immediate download and adjustment. So, changes can be made in the color, design, graphics or any other component to create a unique layout.


This slide focuses on project management dashboard which covers the project name, status date overall status, monthly schedule such as analysis, development, quality assurance, user acceptance, pre-production and support with actual and planned budget, pending decisions and actions, etc.Presenting this PowerPoint presentation, titled Dashboard Depicting Project Associated Risks And Issues Strategies To Enhance Project Lifecycle Background PDF, with topics curated by our researchers after extensive research. This editable presentation is available for immediate download and provides attractive features when used. Download now and captivate your audience. Presenting this Dashboard Depicting Project Associated Risks And Issues Strategies To Enhance Project Lifecycle Background PDF. Our researchers have carefully researched and created these slides with all aspects taken into consideration. This is a completely customizable Dashboard Depicting Project Associated Risks And Issues Strategies To Enhance Project Lifecycle Background PDF that is available for immediate downloading. Download now and make an impact on your audience. Highlight the attractive features available with our PPTs.


This slide illustrates process management dashboard depicting power plant details which consists of total capacity, target, power generator, frequency, temperature, humidity, turbines, etc. Pitch your topic with ease and precision using this Wastewater Treatment Dashboard Depicting Power Plant Consumption Metrics Ppt Slides Tips PDF. This layout presents information on Power Generator, Target, Actual Output. It is also available for immediate download and adjustment. So, changes can be made in the color, design, graphics or any other component to create a unique layout.


This slide depicts the dashboard showing metrics to measure social media recruitment status which covers sourcing status, bounce rate, filled positions, recruitment expenses, cost per hire, top referrers, etc.Here you can discover an assortment of the finest PowerPoint and Google Slides templates. With these templates, you can create presentations for a variety of purposes while simultaneously providing your audience with an eye-catching visual experience. Download Dashboard Depicting Social Media Tactical Plan To Enhance Social Media Hiring Process Download PDF to deliver an impeccable presentation. These templates will make your job of preparing presentations much quicker, yet still, maintain a high level of quality. Slidegeeks has experienced researchers who prepare these templates and write high-quality content for you. Later on, you can personalize the content by editing the Dashboard Depicting Social Media Tactical Plan To Enhance Social Media Hiring Process Download PDF.


This Slide shows hospital management dashboard depicting patients information. It includes information about new patients, doctors, operations, hospital survey, country wise list. etc. Showcasing this set of slides titled Hospital Management Software Dashboard Depicting Patients Information Ppt Layouts Skills PDF. The topics addressed in these templates are New Patients, Reporting Doctors, Operations Today. All the content presented in this PPT design is completely editable. Download it and make adjustments in color, background, font etc. as per your unique business setting.


This Slide represents hospital management system dashboard depicting health admin tasks. It includes detail such as active doctors, patients, representatives, nurses and other staff. Pitch your topic with ease and precision using this Hospital Management Software Dashboard Depicting Health Admin Tasks Ppt Pictures Inspiration PDF. This layout presents information on Active Doctors, Active Patients, Representative. It is also available for immediate download and adjustment. So, changes can be made in the color, design, graphics or any other component to create a unique layout.


This slide focuses on dashboard that depicts sales and customer analytics which covers sales revenue, average transaction rate, out of stock items, sales by division, monthly visitors, etc. If you are looking for a format to display your unique thoughts, then the professionally designed Dashboard Depicting Sales And Customer Analytics Infographics PDF is the one for you. You can use it as a Google Slides template or a PowerPoint template. Incorporate impressive visuals, symbols, images, and other charts. Modify or reorganize the text boxes as you desire. Experiment with shade schemes and font pairings. Alter, share or cooperate with other people on your work. Download Dashboard Depicting Sales And Customer Analytics Infographics PDF and find out how to give a successful presentation. Present a perfect display to your team and make your presentation unforgettable.
This slide shows product assortment dashboard depicting store performance which can benefit managers in reviewing the current situation of outlets and make decisions according to reached benchmarks. It includes details about achieved sales, rate of conversion, weekday vs. Weekend sales, daily trend, etc. Showcasing this set of slides titled Retail Assortment Dashboard Depicting Store Performance Ppt Icon Structure PDF. The topics addressed in these templates are Achieved Sales, Rate Of Conversion, Daily Trend, Outlet Sales. All the content presented in this PPT design is completely editable. Download it and make adjustments in color, background, font etc. as per your unique business setting.


This graph or chart is linked to excel, and changes automatically based on data. Just left click on it and select Edit Data. Pitch your topic with ease and precision using this SLA KPL Overview Dashboard Depicting Service Targets Ppt Slides Maker PDF. This layout presents information on Monthly Trend, Service Target, Quarterly Trend. It is also available for immediate download and adjustment. So, changes can be made in the color, design, graphics or any other component to create a unique layout.


This slide illustrates economic feasibility dashboard depicting income and unemployment analysis. It contains information about household income, unemployment rate, poverty, status, etc. Pitch your topic with ease and precision using this Financial Feasibility Analysis Dashboard Depicting Income And Unemployment Analysis Download PDF. This layout presents information on Median Household Income, Unemployment Rate, Percent Living Poverty. It is also available for immediate download and adjustment. So, changes can be made in the color, design, graphics or any other component to create a unique layout.


This slide shows dashboard that depicts metrics to measure customer experience that covers net revenue, customer retention, abandonment, unique visitors, etc.Deliver an awe inspiring pitch with this creative Dashboard Depicting Metrics To Measure Customer Experience Developing Online Summary PDF bundle. Topics like Net Revenue, Customer Retention, Abandonment can be discussed with this completely editable template. It is available for immediate download depending on the needs and requirements of the user.
SHOW
- 60
- 120
- 180
DISPLAYING: 60 of 142 Item(s)
Page