 AI PPT Maker
 Templates
 PPT Bundles
 Design Services
 Business PPTs
 Business Plan
 Management
 Strategy
 Introduction PPT
 Roadmap
 Self Introduction
 Timelines
 Process
 Marketing
 Agenda
 Technology
 Medical
 Startup Business Plan
 Cyber Security
 Dashboards
 SWOT
SWOT Proposals
 Education
 Pitch Deck
 Digital Marketing
 KPIs
KPIs Project Management
 Product Management
 Artificial Intelligence
 Target Market
 Communication
 Supply Chain
 Google Slides
 Research Services
 One Pagers
 All Categories
Dashboard analysis PowerPoint Presentation Templates and Google Slides
SHOW
- 60
- 120
- 180
DISPLAYING: 60 of 514 Item(s)
Page


This esg analysis dashboard organisational ppt powerpoint presentation complete deck with slides acts as backup support for your ideas, vision, thoughts, etc. Use it to present a thorough understanding of the topic. This PPT slideshow can be utilized for both in-house and outside presentations depending upon your needs and business demands. Entailing twelve slides with a consistent design and theme, this template will make a solid use case. As it is intuitively designed, it suits every business vertical and industry. All you have to do is make a few tweaks in the content or any other component to design unique presentations. The biggest advantage of this complete deck is that it can be personalized multiple times once downloaded. The color, design, shapes, and other elements are free to modify to add personal touches. You can also insert your logo design in this PPT layout. Therefore a well-thought and crafted presentation can be delivered with ease and precision by downloading this esg analysis dashboard organisational ppt powerpoint presentation complete deck with slides PPT slideshow.


This competition analysis matrix dashboard comparison ppt powerpoint presentation complete deck acts as backup support for your ideas, vision, thoughts, etc. Use it to present a thorough understanding of the topic. This PPT slideshow can be utilized for both in-house and outside presentations depending upon your needs and business demands. Entailing twelve slides with a consistent design and theme, this template will make a solid use case. As it is intuitively designed, it suits every business vertical and industry. All you have to do is make a few tweaks in the content or any other component to design unique presentations. The biggest advantage of this complete deck is that it can be personalized multiple times once downloaded. The color, design, shapes, and other elements are free to modify to add personal touches. You can also insert your logo design in this PPT layout. Therefore a well-thought and crafted presentation can be delivered with ease and precision by downloading this competition analysis matrix dashboard comparison ppt powerpoint presentation complete deck PPT slideshow.


This is a visual mining dashboard analysis ppt example. This is a seven stage process. The stages in this process are data sources, preprocess data, data warehouse or mapping scheme, machining learning, statistics and others, analysis reviews outputs, revise refine queries, report finding, interpret result, take action based on findings.


This is a sales forecasting analysis dashboard diagram templates. This is a nine stage process. The stages in this process are develop forecasting procedure, select forecasting analysis method, comprehend total forecasting procedure, collect collate gather and analyze data, determine independent and dependent variables, present all the assumption about data, forecast objectives, evaluate performance result against the forecasts, make and finalize the forecasts.


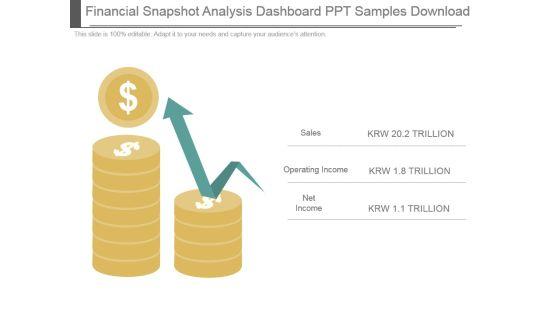
Presenting this set of slides with name dashboard analysis ppt powerpoint presentation inspiration designs download. The topics discussed in these slides are finance, marketing, management, investment, analysis. This is a completely editable PowerPoint presentation and is available for immediate download. Download now and impress your audience.


Experiential Retail Store Network Development Retail Store Performance Analysis Dashboard Themes PDF
This slide provides information regarding the dashboard to track retail store performance analysis in terms of units per transaction, net profit, revenues, sales square foot per location, etc. Crafting an eye-catching presentation has never been more straightforward. Let your presentation shine with this tasteful yet straightforward Experiential Retail Store Network Development Retail Store Performance Analysis Dashboard Themes PDF template. It offers a minimalistic and classy look that is great for making a statement. The colors have been employed intelligently to add a bit of playfulness while still remaining professional. Construct the ideal Experiential Retail Store Network Development Retail Store Performance Analysis Dashboard Themes PDF that effortlessly grabs the attention of your audience Begin now and be certain to wow your customers


The following slide showcases social media analytical dashboard to deliver best content and drive more website users. It includes elements such as post reach, sessions, organic traffic, cost per lead, page engagement, traffic through ads etc. Do you have an important presentation coming up Are you looking for something that will make your presentation stand out from the rest Look no further than Guide For Marketing Analytics To Improve Decisions Social Media Marketing Channel Performance Analysis Dashboard Background PDF. With our professional designs, you can trust that your presentation will pop and make delivering it a smooth process. And with Slidegeeks, you can trust that your presentation will be unique and memorable. So why wait Grab Guide For Marketing Analytics To Improve Decisions Social Media Marketing Channel Performance Analysis Dashboard Background PDF today and make your presentation stand out from the rest.


Change Management Training Feedback Analysis Dashboard Ppt PowerPoint Presentation File Diagrams PDF
This slide shows dashboard representing the analysis of the training feedback received from the organizational staff. It includes KPIs such as net promoter score, training satisfaction rate, trainee engagement score etc. Get a simple yet stunning designed Change Management Training Feedback Analysis Dashboard Ppt PowerPoint Presentation File Diagrams PDF. It is the best one to establish the tone in your meetings. It is an excellent way to make your presentations highly effective. So, download this PPT today from Slidegeeks and see the positive impacts. Our easy to edit Change Management Training Feedback Analysis Dashboard Ppt PowerPoint Presentation File Diagrams PDF can be your go to option for all upcoming conferences and meetings. So, what are you waiting for Grab this template today.


This slide represents the dashboard showing the analysis of change management training program conducted by the organization. It includes details related to total courses, total participants, compensation cost etc. Do you have to make sure that everyone on your team knows about any specific topic I yes, then you should give Change Management Training Analysis Dashboard Ppt PowerPoint Presentation File Layouts PDF a try. Our experts have put a lot of knowledge and effort into creating this impeccable Change Management Training Analysis Dashboard Ppt PowerPoint Presentation File Layouts PDF. You can use this template for your upcoming presentations, as the slides are perfect to represent even the tiniest detail. You can download these templates from the Slidegeeks website and these are easy to edit. So grab these today.

The following slide outlines a comprehensive visual representation of customer satisfaction CSAT that can assist companies to measure how happy are customers wit the brand. The kpis covered are net promoter score NPS, customer effort score CES, product quality, pricing, etc. Retrieve professionally designed Market Analysis Overview And Different Categories KPI Dashboard To Analyze Customer Satisfaction Elements PDF to effectively convey your message and captivate your listeners. Save time by selecting pre made slideshows that are appropriate for various topics, from business to educational purposes. These themes come in many different styles, from creative to corporate, and all of them are easily adjustable and can be edited quickly. Access them as PowerPoint templates or as Google Slides themes. You do not have to go on a hunt for the perfect presentation because Slidegeeks got you covered from everywhere.


The following slide outlines key performance indicator KPI dashboard that can assist marketers to evaluate brand performance on social media channels. The metrics covered are age group, gender, brand perception, branding themes, celebrity analysis, etc. Present like a pro with Market Analysis Overview And Different Categories Brand Analytics Kpi Dashboard For Organization Rules PDF Create beautiful presentations together with your team, using our easy to use presentation slides. Share your ideas in real time and make changes on the fly by downloading our templates. So whether you are in the office, on the go, or in a remote location, you can stay in sync with your team and present your ideas with confidence. With Slidegeeks presentation got a whole lot easier. Grab these presentations today.


This slide showcases dashboard that can help restaurant keep track of revenue generated from food and beverages. Its key elements are revenue by location, top expenses, revenue by type etc Are you in need of a template that can accommodate all of your creative concepts This one is crafted professionally and can be altered to fit any style. Use it with Google Slides or PowerPoint. Include striking photographs, symbols, depictions, and other visuals. Fill, move around, or remove text boxes as desired. Test out color palettes and font mixtures. Edit and save your work, or work with colleagues. Download Marketing Initiatives To Promote Fast Food Cafe Food And Beverages Revenue Analysis Dashboard Demonstration PDF and observe how to make your presentation outstanding. Give an impeccable presentation to your group and make your presentation unforgettable.


The following slide depicts the data breach trends to minimize information leakage and patch affected system. It includes elements such as breach risk trend, breach by risk category, current and future goal analysis etc. This modern and well arranged Data Breach Trend Analysis With KPI Dashboard Ppt PowerPoint Presentation File Portfolio PDF provides lots of creative possibilities. It is very simple to customize and edit with the Powerpoint Software. Just drag and drop your pictures into the shapes. All facets of this template can be edited with Powerpoint no extra software is necessary. Add your own material, put your images in the places assigned for them, adjust the colors, and then you can show your slides to the world, with an animated slide included.
Mentioned slide displays a dashboard to assess retail store performance. Metrics included in the dashboard are net sales, average unit in retail, average basket size, sales volume by store and total visitors count. Explore a selection of the finest Enhancing Retail Process By Effective Inventory Management Retail Store Performance Analysis Dashboard Icons PDF here. With a plethora of professionally designed and pre made slide templates, you can quickly and easily find the right one for your upcoming presentation. You can use our Enhancing Retail Process By Effective Inventory Management Retail Store Performance Analysis Dashboard Icons PDF to effectively convey your message to a wider audience. Slidegeeks has done a lot of research before preparing these presentation templates. The content can be personalized and the slides are highly editable. Grab templates today from Slidegeeks.


The following slide showcases green marketing campaign costs assessment to evaluate overall expenses and allocate funds adequately for future. It includes elements such as conversions, clicks, click through rate CTR, Ad group, cost per conversion, expense by location etc. Presenting this PowerPoint presentation, titled Campaign Cost Analysis With Kpi Dashboard Summary PDF, with topics curated by our researchers after extensive research. This editable presentation is available for immediate download and provides attractive features when used. Download now and captivate your audience. Presenting this Campaign Cost Analysis With Kpi Dashboard Summary PDF. Our researchers have carefully researched and created these slides with all aspects taken into consideration. This is a completely customizable Campaign Cost Analysis With Kpi Dashboard Summary PDF that is available for immediate downloading. Download now and make an impact on your audience. Highlight the attractive features available with our PPTs.


This slide represents the cobots performance dashboard by covering details of battery level, performance, total hours, average time, time to return, energy consumption, and so on. Presenting this PowerPoint presentation, titled Detailed Analysis Of Cobots Dashboard To Track Cobot Performance Formats PDF, with topics curated by our researchers after extensive research. This editable presentation is available for immediate download and provides attractive features when used. Download now and captivate your audience. Presenting this Detailed Analysis Of Cobots Dashboard To Track Cobot Performance Formats PDF. Our researchers have carefully researched and created these slides with all aspects taken into consideration. This is a completely customizable Detailed Analysis Of Cobots Dashboard To Track Cobot Performance Formats PDF that is available for immediate downloading. Download now and make an impact on your audience. Highlight the attractive features available with our PPTs.


Mentioned slide showcases cash burn dashboard which helps to track companys expenses and projected finances. The slide covers negative cash flow , forecasting , actual vs previous year comparison Showcasing this set of slides titled Financial Forecasting Dashboard With Burn Rate Analysis Brochure PDF. The topics addressed in these templates are Previous Year, Analysis, Forecast. All the content presented in this PPT design is completely editable. Download it and make adjustments in color, background, font etc. as per your unique business setting.


This slide covers the marketing campaign tracker for the new product launch. It includes KPIs such as sessions, new sessions, page or session, avg. Session duration, bounce rate, goal conversion rate, and traffic by source. Welcome to our selection of the New Product Marketing Campaign Performance Analysis Dashboard Ppt Slides Grid PDF. These are designed to help you showcase your creativity and bring your sphere to life. Planning and Innovation are essential for any business that is just starting out. This collection contains the designs that you need for your everyday presentations. All of our PowerPoints are 100 percent editable, so you can customize them to suit your needs. This multi-purpose template can be used in various situations. Grab these presentation templates today


This slide covers social media and paid ad campaigns. It includes metrics such as ad spend, cost per thousand, cost per click, click-through rate, ad clicks, and ad reach. Coming up with a presentation necessitates that the majority of the effort goes into the content and the message you intend to convey. The visuals of a PowerPoint presentation can only be effective if it supplements and supports the story that is being told. Keeping this in mind our experts created Marketing Campaign KPI Analysis Dashboard Ppt Inspiration Example File PDF to reduce the time that goes into designing the presentation. This way, you can concentrate on the message while our designers take care of providing you with the right template for the situation.


This slide showcases containment cost dashboard to identify and formulate appropriate expense reduction strategies for the company. It includes components such as product grouping, contact overview, top vendors, etc. Showcasing this set of slides titled Cut Of Procurement Cost Dashboard With Spend Analysis Elements PDF. The topics addressed in these templates are Spend Category, Product Grouping, Contract Overview. All the content presented in this PPT design is completely editable. Download it and make adjustments in color, background, font etc. as per your unique business setting.


This slide defines the dashboard for assessment and analysis of promotion marketing. It includes information related to the sales, return, quantity and profits. Showcasing this set of slides titled Marketing Promotion Analysis And Analysis Dashboard Brochure PDF. The topics addressed in these templates are Sales Amount, Sales Quantity, Return Quantity. All the content presented in this PPT design is completely editable. Download it and make adjustments in color, background, font etc. as per your unique business setting.


This slide showcases the search engine marketing analysis dashboard. It includes elements such as ad cost , number of visits, cost per click, ad impressions, total page views and total visits. From laying roadmaps to briefing everything in detail, our templates are perfect for you. You can set the stage with your presentation slides. All you have to do is download these easy to edit and customizable templates. Qualified Traffic Generation Through Search Engines Search Engine Marketing Analysis Dashboard Download PDF will help you deliver an outstanding performance that everyone would remember and praise you for. Do download this presentation today.


This slide showcases the PPC marketing campaign analysis dashboard. It includes elements such as ad cost, clicks, impressions, click through rate, cost per conversion, conversion rate, CPC and cost per thousand impressions There are so many reasons you need a Qualified Traffic Generation Through Search Engines Ppc Marketing Campaign Analysis Dashboard Pictures PDF. The first reason is you cannot spend time making everything from scratch, Thus, Slidegeeks has made presentation templates for you too. You can easily download these templates from our website easily.

This slide exhibits customer service dashboard to improve visibility. The dashboard includes resolved and active cases, incoming cases by subject, priority, SLA status and age, CSAT and escalated case volume. The Action Plan To Enhance Client Service Customer Support Service Analysis Dashboard Graphics PDF is a compilation of the most recent design trends as a series of slides. It is suitable for any subject or industry presentation, containing attractive visuals and photo spots for businesses to clearly express their messages. This template contains a variety of slides for the user to input data, such as structures to contrast two elements, bullet points, and slides for written information. Slidegeeks is prepared to create an impression.


This slide illustrates facts and figures related to customer retention and churn prediction. It includes customer churn, revenue churn, net revenue, MRR growth etc. Showcasing this set of slides titled Customer Attrition And Retention Analysis Dashboard Background PDF. The topics addressed in these templates are Net Promoter Score, Loyal Customers, Premium Users, Customer Churn, Revenue Churn. All the content presented in this PPT design is completely editable. Download it and make adjustments in color, background, font etc. as per your unique business setting.
Forecast Analysis Technique IT Predictive Modeling Model Performance Tracking Dashboard Brochure PDF
This slide represents the predictive analytics model performance tracking dashboard, and it covers the details of total visitors, total buyers, total products added to the cart, filters by date and category, visitors to clients conversion rate, and so on. There are so many reasons you need a Forecast Analysis Technique IT Predictive Modeling Model Performance Tracking Dashboard Brochure PDF. The first reason is you can not spend time making everything from scratch, Thus, Slidegeeks has made presentation templates for you too. You can easily download these templates from our website easily.


This slide showcases a dashboard for analyzing competitors performance on social media platforms. It highlights elements such as activity overview, followers, top competitors, competitor average followers, audience growth and new follower growth by day. Find a pre-designed and impeccable Steps To Conduct Competitor Analysis Social Media Competitor Analysis Dashboard Brochure PDF. The templates can ace your presentation without additional effort. You can download these easy-to-edit presentation templates to make your presentation stand out from others. So, what are you waiting for Download the template from Slidegeeks today and give a unique touch to your presentation.


This slide showcases a dashboard for analyzing competitors top email campaigns to optimize own business promotional campaigns. It highlights elements such as campaign name, emails captured, web screenshots, yearly email send, days email send and hours of email send. Steps To Conduct Competitor Analysis Competitor Email Campaign Analysis Dashboard Themes PDF can be your best option for delivering a presentation. Represent everything in detail using Steps To Conduct Competitor Analysis Competitor Email Campaign Analysis Dashboard Themes PDF and make yourself stand out in meetings. The template is versatile and follows a structure that will cater to your requirements. All the templates prepared by Slidegeeks are easy to download and edit. Our research experts have taken care of the corporate themes as well. So, give it a try and see the results.


This slide represents the key metrics dashboard to track and analyze the performance of ecommerce business after implementing data driven marketing strategies. It includes details related to key metrics such as ecommerce revenue, new customers, repeat purchase rate etc. Get a simple yet stunning designed Ecommerce Data Driven Marketing Performance Analysis Dashboard Professional PDF. It is the best one to establish the tone in your meetings. It is an excellent way to make your presentations highly effective. So, download this PPT today from Slidegeeks and see the positive impacts. Our easy-to-edit Ecommerce Data Driven Marketing Performance Analysis Dashboard Professional PDF can be your go-to option for all upcoming conferences and meetings. So, what are you waiting for Grab this template today.


This slide represents the dashboard to analysis the performance of twitter advertising campaign. It provides information regarding total followers gained and lost, impressions, engagement rate. It also covers details of top five used and best performing hashtags performance. Want to ace your presentation in front of a live audience Our Utilizing Twitter For Social Media Performance Analysis Dashboard For Twitter Marketing Themes PDF can help you do that by engaging all the users towards you.. Slidegeeks experts have put their efforts and expertise into creating these impeccable powerpoint presentations so that you can communicate your ideas clearly. Moreover, all the templates are customizable, and easy-to-edit and downloadable. Use these for both personal and commercial use.


This slide represents the dashboard for twitter competition analysis providing information regarding published tweets in terms of original, links, pictures, videos etc. It also covers details of tweet likes, retweets, mentions, replies etc. Make sure to capture your audiences attention in your business displays with our gratis customizable Utilizing Twitter For Social Media Dashboard For Twitter Competition Analysis Structure PDF. These are great for business strategies, office conferences, capital raising or task suggestions. If you desire to acquire more customers for your tech business and ensure they stay satisfied, create your own sales presentation with these plain slides.
SHOW
- 60
- 120
- 180
DISPLAYING: 60 of 514 Item(s)
Page