 AI PPT Maker
 Templates
 PPT Bundles
 Design Services
 Business PPTs
 Business Plan
 Management
 Strategy
 Introduction PPT
 Roadmap
 Self Introduction
 Timelines
 Process
 Marketing
 Agenda
 Technology
 Medical
 Startup Business Plan
 Cyber Security
 Dashboards
 SWOT
SWOT Proposals
 Education
 Pitch Deck
 Digital Marketing
 KPIs
KPIs Project Management
 Product Management
 Artificial Intelligence
 Target Market
 Communication
 Supply Chain
 Google Slides
 Research Services
 One Pagers
 All Categories
Custom dashboards PowerPoint Presentation Templates and Google Slides
SHOW
- 60
- 120
- 180
DISPLAYING: 60 of 740 Item(s)
Page


This complete deck acts as a great communication tool. It helps you in conveying your business message with personalized sets of graphics, icons etc. Comprising a set of fourtynine slides, this complete deck can help you persuade your audience. It also induces strategic thinking as it has been thoroughly researched and put together by our experts. Not only is it easily downloadable but also editable. The color, graphics, theme any component can be altered to fit your individual needs. So grab it now.


If designing a presentation takes a lot of your time and resources and you are looking for a better alternative, then this Customer Relationship Management Dashboard Ppt PowerPoint Presentation Complete Deck is the right fit for you. This is a prefabricated set that can help you deliver a great presentation on the topic. All the twelve slides included in this sample template can be used to present a birds-eye view of the topic. These slides are also fully editable, giving you enough freedom to add specific details to make this layout more suited to your business setting. Apart from the content, all other elements like color, design, theme are also replaceable and editable. This helps in designing a variety of presentations with a single layout. Not only this, you can use this PPT design in formats like PDF, PNG, and JPG once downloaded. Therefore, without any further ado, download and utilize this sample presentation as per your liking.


Presenting this set of slides with name customer loyalty performance dashboard ppt powerpoint presentation pictures maker. This is a two stage process. The stages in this process are customer loyalty, program performance, dashboard, marketing, strategy. This is a completely editable PowerPoint presentation and is available for immediate download. Download now and impress your audience.


This slide provides information regarding different brands performance tracking dashboard in terms of brand metric, brand commitment, advertising metrics, and purchase metrics. Are you in need of a template that can accommodate all of your creative concepts This one is crafted professionally and can be altered to fit any style. Use it with Google Slides or PowerPoint. Include striking photographs, symbols, depictions, and other visuals. Fill, move around, or remove text boxes as desired. Test out color palettes and font mixtures. Edit and save your work, or work with colleagues. Download Improving Brand Mentions For Customer Different Brands Performance Tracking Dashboard Formats PDF and observe how to make your presentation outstanding. Give an impeccable presentation to your group and make your presentation unforgettable.
This slide provides details regarding the dashboard for tracking retail store activities in terms of sales, conversion rate, traffic, average transaction value, recommendations, etc. This modern and well-arranged Essential Retail Store Activities Tracking Dashboard Customer Engagement Administration Infographics PDF provides lots of creative possibilities. It is very simple to customize and edit with the Powerpoint Software. Just drag and drop your pictures into the shapes. All facets of this template can be edited with Powerpoint no extra software is necessary. Add your own material, put your images in the places assigned for them, adjust the colors, and then you can show your slides to the world, with an animated slide included.
This slide provides information regarding different brands performance tracking dashboard in terms of brand metric, brand commitment, advertising metrics, and purchase metrics. Make sure to capture your audiences attention in your business displays with our gratis customizable Developing Brand Awareness To Gain Customer Attention Different Brands Performance Tracking Dashboard Introduction PDF. These are great for business strategies, office conferences, capital raising or task suggestions. If you desire to acquire more customers for your tech business and ensure they stay satisfied, create your own sales presentation with these plain slides.
This slide provides details regarding the dashboard for tracking retail store activities in terms of sales, conversion rate, traffic, average transaction value, recommendations, etc. Deliver and pitch your topic in the best possible manner with this Customer In Store Purchase Experience Essential Retail Store Activities Tracking Dashboard Background PDF. Use them to share invaluable insights on Sales, Traffic Out, Conversion Rate and impress your audience. This template can be altered and modified as per your expectations. So, grab it now.


Following slide illustrates customer service dashboard covering details such as request answered, total requests, total revenue and support cost revenue. It also includes customer satisfaction score, customer retention in a 12 months format. Deliver and pitch your topic in the best possible manner with this Customer Service Dashboard Company Performance Evaluation Using KPI Themes PDF. Use them to share invaluable insights on Requests Answered, Total Revenue, Customer Retention and impress your audience. This template can be altered and modified as per your expectations. So, grab it now.


Mentioned slide covers customer satisfaction dashboard with a 12 month format. It includes customer satisfaction details by region and by district. Deliver an awe inspiring pitch with this creative Customer Satisfaction Dashboard Company Performance Evaluation Using KPI Graphics PDF bundle. Topics like Customer Satisfaction, Dashboard, Best Demonstrated can be discussed with this completely editable template. It is available for immediate download depending on the needs and requirements of the user.


Following slide illustrates customer service dashboard covering details such as request answered, total requests, total revenue and support cost revenue. It also includes customer satisfaction score, customer retention in a 12 months format. Deliver and pitch your topic in the best possible manner with this Kpis For Evaluating Business Sustainability Customer Service Dashboard Designs PDF. Use them to share invaluable insights on Costs Per Support, Customer Retention, Customer Satisfaction and impress your audience. This template can be altered and modified as per your expectations. So, grab it now.


Mentioned slide covers customer satisfaction dashboard with a 12-month format. It includes customer satisfaction details by region and by district. Deliver an awe inspiring pitch with this creative Kpis For Evaluating Business Sustainability Customer Satisfaction Dashboard Clipart PDF bundle. Topics like Best Demonstrated, Worst Demonstrated, 12 Month Trend can be discussed with this completely editable template. It is available for immediate download depending on the needs and requirements of the user.


Following slide illustrates customer service dashboard covering details such as request answered, total requests, total revenue and support cost revenue. It also includes customer satisfaction score, customer retention in a 12 months format.Deliver and pitch your topic in the best possible manner with this Enterprise Sustainability Performance Metrics Customer Service Dashboard Professional PDF. Use them to share invaluable insights on Customer Satisfaction, Customer Retention, Support Revenue and impress your audience. This template can be altered and modified as per your expectations. So, grab it now.


Mentioned slide covers customer satisfaction dashboard with a 12-month format. It includes customer satisfaction details by region and by district. Deliver an awe inspiring pitch with this creative Enterprise Sustainability Performance Metrics Customer Satisfaction Dashboard Designs PDF bundle. Topics like Best Demonstrated, Worst Demonstrated, Variance Target can be discussed with this completely editable template. It is available for immediate download depending on the needs and requirements of the user.


Following slide illustrates customer service dashboard covering details such as request answered, total requests, total revenue and support cost revenue. It also includes customer satisfaction score, customer retention in a 12 months format. Deliver and pitch your topic in the best possible manner with this Metrics To Measure Business Performance Customer Service Dashboard Sample PDF. Use them to share invaluable insights on Requests Answered 2022, Total Requests 2022, Total Revenue 2022 and impress your audience. This template can be altered and modified as per your expectations. So, grab it now.


Mentioned slide covers customer satisfaction dashboard with a 12-month format. It includes customer satisfaction details by region and by district. Deliver an awe inspiring pitch with this creative Metrics To Measure Business Performance Customer Satisfaction Dashboard Summary PDF bundle. Topics like Best Demonstrated, Worst Demonstrated, 2020 can be discussed with this completely editable template. It is available for immediate download depending on the needs and requirements of the user.


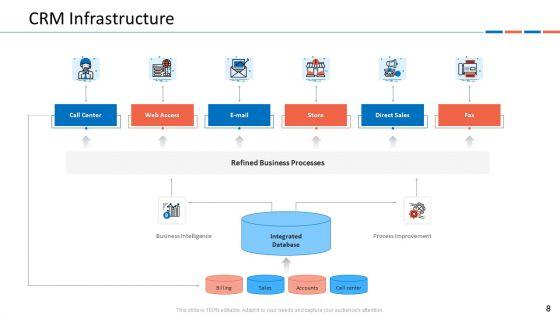
This slide represents the key metrics dashboard of CRM system of an organization. It includes details related to KPIs such as new contacts, campaign emails sent, emails opened, revenue graph etc. This modern and well arranged Integrating CRM Solution To Acquire Potential Customers Customer Relationship Management System Dashboard Brochure PDF provides lots of creative possibilities. It is very simple to customize and edit with the Powerpoint Software. Just drag and drop your pictures into the shapes. All facets of this template can be edited with Powerpoint no extra software is necessary. Add your own material, put your images in the places assigned for them, adjust the colors, and then you can show your slides to the world, with an animated slide included.


This slide represents the key metrics dashboard to track, analyze, manage and monitor the performance of social media marketing campaign organized by the enterprise. It includes details related to KPIs such as social media followers etc. Formulating a presentation can take up a lot of effort and time, so the content and message should always be the primary focus. The visuals of the PowerPoint can enhance the presenters message, so our Integrating CRM Solution To Acquire Potential Customers CRM Social Media Marketing Campaign Dashboard Template PDF was created to help save time. Instead of worrying about the design, the presenter can concentrate on the message while our designers work on creating the ideal templates for whatever situation is needed. Slidegeeks has experts for everything from amazing designs to valuable content, we have put everything into Integrating CRM Solution To Acquire Potential Customers CRM Social Media Marketing Campaign Dashboard Template PDF


This slide represents key metrics dashboard to track and analyze the performance of CRM marketing pipeline. It includes details related to KPIs such as open pipeline value, pipeline value forecast, top 5 sales opportunities etc. Crafting an eye catching presentation has never been more straightforward. Let your presentation shine with this tasteful yet straightforward Integrating CRM Solution To Acquire Potential Customers CRM Marketing Pipeline KPI Dashboard Background PDF template. It offers a minimalistic and classy look that is great for making a statement. The colors have been employed intelligently to add a bit of playfulness while still remaining professional. Construct the ideal Integrating CRM Solution To Acquire Potential Customers CRM Marketing Pipeline KPI Dashboard Background PDF that effortlessly grabs the attention of your audience. Begin now and be certain to wow your customers.


This slide represents the dashboard to track and manage customer relationship management marketing attribution campaign. It includes details related to KPIs such as acquisition funnel overview, MQL, SQL, opportunities and customers by channel. Are you in need of a template that can accommodate all of your creative concepts This one is crafted professionally and can be altered to fit any style. Use it with Google Slides or PowerPoint. Include striking photographs, symbols, depictions, and other visuals. Fill, move around, or remove text boxes as desired. Test out color palettes and font mixtures. Edit and save your work, or work with colleagues. Download Integrating CRM Solution To Acquire Potential Customers CRM Marketing Attribution Key Metrics Dashboard Template PDF and observe how to make your presentation outstanding. Give an impeccable presentation to your group and make your presentation unforgettable.


This slide represents key metrics dashboard to analyze, manage and track the performance of email nurturing campaign organized by the enterprise. It incudes details related to KPIs such as conversion rate, average order value etc. If you are looking for a format to display your unique thoughts, then the professionally designed Integrating CRM Solution To Acquire Potential Customers CRM Email Nurturing Campaign Dashboard Template PDF is the one for you. You can use it as a Google Slides template or a PowerPoint template. Incorporate impressive visuals, symbols, images, and other charts. Modify or reorganize the text boxes as you desire. Experiment with shade schemes and font pairings. Alter, share or cooperate with other people on your work. Download Integrating CRM Solution To Acquire Potential Customers CRM Email Nurturing Campaign Dashboard Template PDF and find out how to give a successful presentation. Present a perfect display to your team and make your presentation unforgettable.


The following slide outlines a comprehensive visual representation of customer satisfaction CSAT that can assist companies to measure how happy are customers wit the brand. The KPIs covered are net promoter score NPS, customer effort score CES, product quality, pricing, etc. Coming up with a presentation necessitates that the majority of the effort goes into the content and the message you intend to convey. The visuals of a PowerPoint presentation can only be effective if it supplements and supports the story that is being told. Keeping this in mind our experts created KPI Dashboard To Analyze Customer Satisfaction Ppt PowerPoint Presentation File Infographic Template PDF to reduce the time that goes into designing the presentation. This way, you can concentrate on the message while our designers take care of providing you with the right template for the situation.


The following slide outlines key performance indicator KPI dashboard outlining customer demographics. Information covered in this slide is related to metrics such as gender, education level, technology adoption life cycle, and brand innovation consent. Are you searching for a Analyzing Customer Demographics Through Performance KPI Dashboard Ppt PowerPoint Presentation File Model PDF that is uncluttered, straightforward, and original Its easy to edit, and you can change the colors to suit your personal or business branding. For a presentation that expresses how much effort you have put in, this template is ideal. With all of its features, including tables, diagrams, statistics, and lists, its perfect for a business plan presentation. Make your ideas more appealing with these professional slides. Download Analyzing Customer Demographics Through Performance KPI Dashboard Ppt PowerPoint Presentation File Model PDF from Slidegeeks today.


This slide provides information regarding the dashboard to monitor overall IT performance. The dashboard tracks occupancy rate, net promoter score, avg. first contact resolution rate, etc. The IT Performance Dashboard To Track Customer Satisfaction Ppt PowerPoint Presentation File Styles PDF is a compilation of the most recent design trends as a series of slides. It is suitable for any subject or industry presentation, containing attractive visuals and photo spots for businesses to clearly express their messages. This template contains a variety of slides for the user to input data, such as structures to contrast two elements, bullet points, and slides for written information. Slidegeeks is prepared to create an impression.


This slide provides information regarding the dashboard to monitor overall IT performance. The dashboard tracks occupancy rate, net promoter score, avg. first contact resolution rate, etc. Formulating a presentation can take up a lot of effort and time, so the content and message should always be the primary focus. The visuals of the PowerPoint can enhance the presenters message, so our IT Reducing Costs And Management Tips IT Performance Dashboard To Track Customer Satisfaction Graphics PDF was created to help save time. Instead of worrying about the design, the presenter can concentrate on the message while our designers work on creating the ideal templates for whatever situation is needed. Slidegeeks has experts for everything from amazing designs to valuable content, we have put everything into IT Reducing Costs And Management Tips IT Performance Dashboard To Track Customer Satisfaction Graphics PDF


The following slide represents KPI dashboard to evaluate social media results of micromarketing to anticipate campaign responses. It includes elements such as social events, facebook shares, twitter retweets, interactions etc. Are you searching for a Niche Marketing Guide To Target Specific Customer Groups Evaluating Social Media Results With Kpi Dashboard Inspiration PDF that is uncluttered, straightforward, and original Its easy to edit, and you can change the colors to suit your personal or business branding. For a presentation that expresses how much effort you have put in, this template is ideal. With all of its features, including tables, diagrams, statistics, and lists, its perfect for a business plan presentation. Make your ideas more appealing with these professional slides. Download Niche Marketing Guide To Target Specific Customer Groups Evaluating Social Media Results With Kpi Dashboard Inspiration PDF from Slidegeeks today.


This slide provides information regarding the dashboard to monitor overall IT performance. The dashboard tracks occupancy rate, net promoter score, avg. first contact resolution rate, etc. Boost your pitch with our creative Deploying Corporate Aligned IT Strategy IT Performance Dashboard To Track Customer Satisfaction Clipart PDF. Deliver an awe inspiring pitch that will mesmerize everyone. Using these presentation templates you will surely catch everyones attention. You can browse the ppts collection on our website. We have researchers who are experts at creating the right content for the templates. So you do not have to invest time in any additional work. Just grab the template now and use them.


This slide provides information regarding the dashboard to monitor overall IT performance. The dashboard tracks occupancy rate, net promoter score, avg. first contact resolution rate, etc. Boost your pitch with our creative IT Performance Dashboard To Track Customer Satisfaction Elements PDF. Deliver an awe inspiring pitch that will mesmerize everyone. Using these presentation templates you will surely catch everyones attention. You can browse the ppts collection on our website. We have researchers who are experts at creating the right content for the templates. So you do not have to invest time in any additional work. Just grab the template now and use them.


Mentioned slide demonstrates KPI showcasing email marketing performance which can be used by businesses to determine organisation future growth opportunities. It includes key performance indictors such as conversion rate, open rate, click through rate, bounce rate, and email list growth rate. Make sure to capture your audiences attention in your business displays with our gratis customizable Customer Retention With Email Advertising Campaign Plan KPI Dashboard To Monitor Email Marketing Structure PDF. These are great for business strategies, office conferences, capital raising or task suggestions. If you desire to acquire more customers for your tech business and ensure they stay satisfied, create your own sales presentation with these plain slides.

The following slide outlines a comprehensive visual representation of customer satisfaction CSAT that can assist companies to measure how happy are customers wit the brand. The kpis covered are net promoter score NPS, customer effort score CES, product quality, pricing, etc. Retrieve professionally designed Market Analysis Overview And Different Categories KPI Dashboard To Analyze Customer Satisfaction Elements PDF to effectively convey your message and captivate your listeners. Save time by selecting pre made slideshows that are appropriate for various topics, from business to educational purposes. These themes come in many different styles, from creative to corporate, and all of them are easily adjustable and can be edited quickly. Access them as PowerPoint templates or as Google Slides themes. You do not have to go on a hunt for the perfect presentation because Slidegeeks got you covered from everywhere.


Mentioned slide illustrates customer satisfaction dashboard. It includes information about net promoter score, customer retention rate and customer effort score. From laying roadmaps to briefing everything in detail, our templates are perfect for you. You can set the stage with your presentation slides. All you have to do is download these easy to edit and customizable templates. Enhancing Retail Process By Effective Inventory Management Dashboard For Measuring Customer Satisfaction Pictures PDF will help you deliver an outstanding performance that everyone would remember and praise you for. Do download this presentation today.
This slide represents metric dashboard to track sales performance on e-commerce website. It cover performance indicators such as sales breakdown, order breakdown, recurring sales etc. Make sure to capture your audiences attention in your business displays with our gratis customizable Strategies For Successful Customer Base Development In B2b M Commerce B2b Sales Performance Tracking Dashboard Demonstration PDF. These are great for business strategies, office conferences, capital raising or task suggestions. If you desire to acquire more customers for your tech business and ensure they stay satisfied, create your own sales presentation with these plain slides.


This slide represents metric dashboard to track and analyze b2b ecommerce website performance. It covers total user visits, sales, average return per user etc. If you are looking for a format to display your unique thoughts, then the professionally designed Strategies For Successful Customer Base Development In B2b M Commerce B2b Ecommerce Dashboard To Track Website Sample PDF is the one for you. You can use it as a Google Slides template or a PowerPoint template. Incorporate impressive visuals, symbols, images, and other charts. Modify or reorganize the text boxes as you desire. Experiment with shade schemes and font pairings. Alter, share or cooperate with other people on your work. Download Strategies For Successful Customer Base Development In B2b M Commerce B2b Ecommerce Dashboard To Track Website Sample PDF and find out how to give a successful presentation. Present a perfect display to your team and make your presentation unforgettable.


This slide portrays key performance dashboard for measuring retail business performance. KPIs covered in the dashboards are average shopping time, shop visitors, average basket spend and customer retention. Are you in need of a template that can accommodate all of your creative concepts This one is crafted professionally and can be altered to fit any style. Use it with Google Slides or PowerPoint. Include striking photographs, symbols, depictions, and other visuals. Fill, move around, or remove text boxes as desired. Test out color palettes and font mixtures. Edit and save your work, or work with colleagues. Download Retail Business Operation Management To Optimize Customer Experience KPI Dashboard For Retail Business Download PDF and observe how to make your presentation outstanding. Give an impeccable presentation to your group and make your presentation unforgettable.


Mentioned slide illustrates customer satisfaction dashboard. It includes information about net promoter score, customer retention rate and customer effort score. Present like a pro with Retail Business Operation Management To Optimize Customer Experience Dashboard Measuring Customer Infographics PDF Create beautiful presentations together with your team, using our easy to use presentation slides. Share your ideas in real time and make changes on the fly by downloading our templates. So whether you are in the office, on the go, or in a remote location, you can stay in sync with your team and present your ideas with confidence. With Slidegeeks presentation got a whole lot easier. Grab these presentations today.


This slide showcases call center action plan dashboard which highlights first call resolution, unresolved calls, customers call report, response time by weekday and average answer time. Are you in need of a template that can accommodate all of your creative concepts This one is crafted professionally and can be altered to fit any style. Use it with Google Slides or PowerPoint. Include striking photographs, symbols, depictions, and other visuals. Fill, move around, or remove text boxes as desired. Test out color palettes and font mixtures. Edit and save your work, or work with colleagues. Download Comprehensive Guide For Enhancing Performance Of Customer Service Center Call Center Action Plan Dashboard Infographics PDF and observe how to make your presentation outstanding. Give an impeccable presentation to your group and make your presentation unforgettable.


The slide highlights the market research process results on customer satisfaction. It reflects the already-existing customers and their perception of their relationship with the brand. It includes the customer satisfaction score and net promoter score for September. Showcasing this set of slides titled Customer Demographics Dashboard After Market Research Steps Structure PDF. The topics addressed in these templates are Total, Consent, Education. All the content presented in this PPT design is completely editable. Download it and make adjustments in color, background, font etc. as per your unique business setting.


The following slide outlines a comprehensive visual representation of customer satisfaction CSAT that can assist companies to measure how happy are customers wit the brand. The KPIs covered are net promoter score NPS, customer effort score CES, product quality, pricing, etc. Want to ace your presentation in front of a live audience Our Creating Positioning Techniques For Market Research Kpi Dashboard To Analyze Customer Satisfaction Mockup PDF can help you do that by engaging all the users towards you. Slidegeeks experts have put their efforts and expertise into creating these impeccable powerpoint presentations so that you can communicate your ideas clearly. Moreover, all the templates are customizable, and easy to edit and downloadable. Use these for both personal and commercial use.


Mentioned slide outlines a key performance indicator KPI dashboard which will assist managers to showcase the result of customer attrition prevention strategies. The KPIs are risky customers, retention rate, monthly recurring revenue MRR, churn risk by location and income, etc. This Kpi Metrics Dashboard To Measure Success Of Customer Churn Prevention Strategies Ppt PowerPoint Presentation File Model PDF from Slidegeeks makes it easy to present information on your topic with precision. It provides customization options, so you can make changes to the colors, design, graphics, or any other component to create a unique layout. It is also available for immediate download, so you can begin using it right away. Slidegeeks has done good research to ensure that you have everything you need to make your presentation stand out. Make a name out there for a brilliant performance.
This slide covers the dashboard for analyzing customer loyalty with metrics such as NPS, loyal customer rate, premium users, CLV, customer churn, revenue churn, net retention, MRR growth, etc. Welcome to our selection of the Ultimate Guide To Improve Customer Support And Services Kpi Dashboard For Tracking Customer Retention Guidelines PDF. These are designed to help you showcase your creativity and bring your sphere to life. Planning and Innovation are essential for any business that is just starting out. This collection contains the designs that you need for your everyday presentations. All of our PowerPoints are 100 percent editable, so you can customize them to suit your needs. This multi purpose template can be used in various situations. Grab these presentation templates today.
This slide covers the KPI dashboard for ticket tracking. It includes metrics such as tickets by month, service level, and details of customer service department agents. If your project calls for a presentation, then Slidegeeks is your go to partner because we have professionally designed, easy to edit templates that are perfect for any presentation. After downloading, you can easily edit Ultimate Guide To Improve Customer Support And Services Dashboard For Tracking Aftersales Customer Sample PDF and make the changes accordingly. You can rearrange slides or fill them with different images. Check out all the handy templates


This slide covers a dashboard for tracking consumer satisfaction with metrics such as customer satisfaction score, customer effort score, net promoter score, average response time, etc. Find highly impressive Ultimate Guide To Improve Customer Support And Services Dashboard For Analysing Aftersales Customer Diagrams PDF on Slidegeeks to deliver a meaningful presentation. You can save an ample amount of time using these presentation templates. No need to worry to prepare everything from scratch because Slidegeeks experts have already done a huge research and work for you. You need to download Ultimate Guide To Improve Customer Support And Services Dashboard For Analysing Aftersales Customer Diagrams PDF for your upcoming presentation. All the presentation templates are 100 percent editable and you can change the color and personalize the content accordingly. Download now.
SHOW
- 60
- 120
- 180
DISPLAYING: 60 of 740 Item(s)
Page