 AI PPT Maker
 Templates
 PPT Bundles
 Design Services
 Business PPTs
 Business Plan
 Management
 Strategy
 Introduction PPT
 Roadmap
 Self Introduction
 Timelines
 Process
 Marketing
 Agenda
 Technology
 Medical
 Startup Business Plan
 Cyber Security
 Dashboards
 SWOT
SWOT Proposals
 Education
 Pitch Deck
 Digital Marketing
 KPIs
KPIs Project Management
 Product Management
 Artificial Intelligence
 Target Market
 Communication
 Supply Chain
 Google Slides
 Research Services
 One Pagers
 All Categories
Control charts PowerPoint Presentation Templates and Google Slides
SHOW
- 60
- 120
- 180
DISPLAYING: 60 of 81 Item(s)
Page


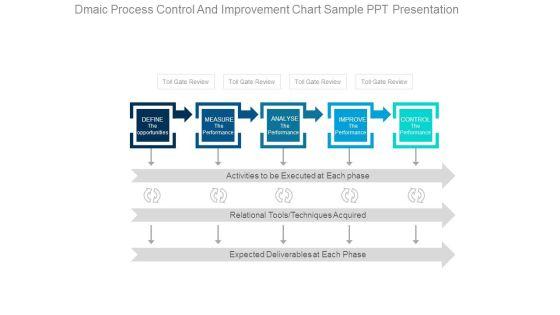

This is a dmaic process control and improvement chart sample ppt presentation. This is a five stage process. The stages in this process are toll gate review, define, the opportunities, measure, the performance, analyse, the performance, improve, the performance, control, the performance, activities to be executed at each phase, relational tools techniques acquired, expected deliverables at each phase.


We present our business charts 8 stages procedures for monitoring and controlling PowerPoint Slides.Present our Circle Charts PowerPoint Templates because Our PowerPoint Templates and Slides will let your words and thoughts hit bullseye everytime. Present our Ring Charts PowerPoint Templates because Our PowerPoint Templates and Slides are created with admirable insight. Use them and give your group a sense of your logical mind. Use our Circle Charts PowerPoint Templates because It will get your audience in sync. Use our Process and Flows PowerPoint Templates because Our PowerPoint Templates and Slides will give you great value for your money. Be assured of finding the best projection to highlight your words. Download our Ring Charts PowerPoint Templates because Our PowerPoint Templates and Slides will let Your superior ideas hit the target always and everytime.Use these PowerPoint slides for presentations relating to Action, analysis, attitude, brainstorming, business, chart, classroom, concept,conceptual, conference, connection, corporate, design, diagram, direction,eight, employee, enhance, financial, formula, future, goal, graphic, guidelines,idea, link, management, market, marketing, mind, mindmap, organization,organize, plan, process, product, relation, render, solutions, strategy, success, successful, tactic, target, training, unity, vision. The prominent colors used in the PowerPoint template are Green lime, Blue, Gray. Our Business Charts 8 Stages Procedures For Monitoring And Controlling PowerPoint Slides capture the attention of your audience. With our money back guarantee you have nothing to lose.


Effective Manufacturing Planning And Control Administration System Clustered Column Chart Themes PDF
Retrieve professionally designed Effective Manufacturing Planning And Control Administration System Clustered Column Chart Themes PDF to effectively convey your message and captivate your listeners. Save time by selecting pre-made slideshows that are appropriate for various topics, from business to educational purposes. These themes come in many different styles, from creative to corporate, and all of them are easily adjustable and can be edited quickly. Access them as PowerPoint templates or as Google Slides themes. You don not have to go on a hunt for the perfect presentation because Slidegeeks got you covered from everywhere.


Following slide portrays control chart that can be used by an organization to determine total specimen labelling errors.Whether you have daily or monthly meetings, a brilliant presentation is necessary. Control Chart To Determine Total Specimen Labelling Quality Control Planning Templates Set 1 Topics PDF can be your best option for delivering a presentation. Represent everything in detail using Control Chart To Determine Total Specimen Labelling Quality Control Planning Templates Set 1 Topics PDF and make yourself stand out in meetings. The template is versatile and follows a structure that will cater to your requirements. All the templates prepared by Slidegeeks are easy to download and edit. Our research experts have taken care of the corporate themes as well. So, give it a try and see the results.


This slide shows the graphical presentation of information technology risk management strategies adopted by banks such as mapping rules and requirements, regulatory impact management, data preparation and validation, compliance monitoring, analytical calculations, etc. Pitch your topic with ease and precision using this Bar Chart Representing IT Risk Control Strategies Risk Management For Banks Themes PDF. This layout presents information on IT Risk Management, Compliance Monitoring, Manages IT Risks. It is also available for immediate download and adjustment. So, changes can be made in the color, design, graphics or any other component to create a unique layout.


Deliver an awe inspiring pitch with this creative QA Plan Set 1 Control Chart To Determine Total Specimen Labelling Errors Sample PDF bundle. Topics like Control Chart To Determine, Specimen Labelling Errors can be discussed with this completely editable template. It is available for immediate download depending on the needs and requirements of the user.


The slide shows a Gantt chart of the project quality management plan. It covers different tasks such as contracts, design, and procurement. Introducing our Project Quality Monitoring And Control Gantt Chart Clipart PDF that is designed to showcase some of the vital components that will help you create timelines, roadmaps, and project plans. In addition, also communicate your project durations, milestones, tasks, subtasks, dependencies, and other attributes using this well structured Project Quality Monitoring And Control Gantt Chart Clipart PDF template. You can also exhibit preeminence against time by deploying this easily adaptable slide to your business presentation. Our experts have designed this template in such a way that it is sure to impress your audience. Thus, download it and steer your project meetings, meetups, and conferences.


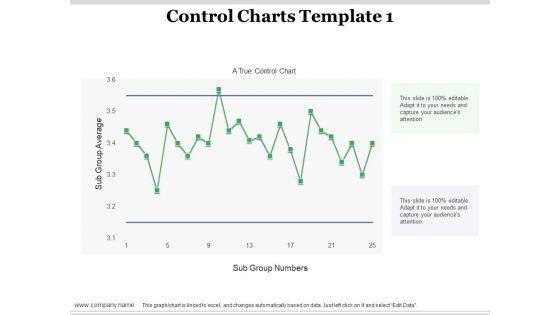
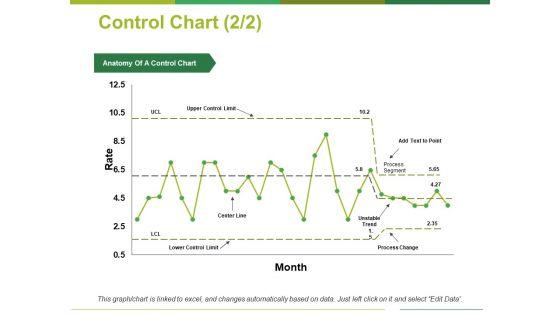
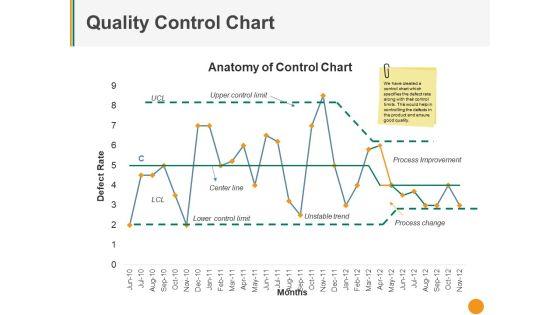
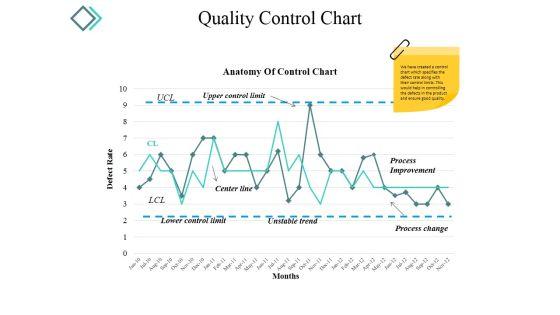
This slide shows the control chart tools for project quality management which includes upper and lower control limit, positive and negative sigma, average, etc. that shows with the passage of time, number of defects gets fluctuated that means the level of controlling process. Pitch your topic with ease and precision using this control chart tools for project quality management tools and techniques for process improvement topics pdf. This layout presents information on time, upper control limit, lower control limit. It is also available for immediate download and adjustment. So, changes can be made in the color, design, graphics or any other component to create a unique layout.


The following slide highlights the Process chart to identify quality control issues which includes the materials incoming, cutting, pre heating, forging, heat treatment and packaging. Presenting process chart to identify quality control issues background pdf to dispense important information. This template comprises one stages. It also presents valuable insights into the topics including Materials Incoming, Incoming Inspection, Preforming Inspection. This is a completely customizable PowerPoint theme that can be put to use immediately. So, download it and address the topic impactfully.

Following slide portrays control chart that can be used by an organization to determine total specimen labelling errors. Deliver an awe inspiring pitch with this creative quality assurance templates set 1 control chart to determine total specimen labelling errors ppt pictures portrait pdf bundle. Topics like control chart to determine total specimen labelling errors can be discussed with this completely editable template. It is available for immediate download depending on the needs and requirements of the user.


Collection Of Quality Assurance PPT Control Chart To Determine Total Specimen Labelling Graphics PDF
Following slide portrays control chart that can be used by an organization to determine total specimen labelling errors. Deliver an awe inspiring pitch with this creative collection of quality assurance ppt control chart to determine total specimen labelling graphics pdf bundle. Topics like control chart to determine total specimen labelling errors can be discussed with this completely editable template. It is available for immediate download depending on the needs and requirements of the user.
Here we are covering effective controls a hierarchy of measures, so that the ones at operational level tie in with those that monitor policy and financial performance. This is a organization chart and corporate model transformation controls and reporting after icons pdf template with various stages. Focus and dispense information on four stages using this creative set, that comes with editable features. It contains large content boxes to add your information on topics like directors and senior executives, senior managers, sectional and departmental heads, first line team leaders and supervisors, operational clerical staff. You can also showcase facts, figures, and other relevant content using this PPT layout. Grab it now.
The quality team will use control chart as food quality management tool. It will help in determining the food processes are stable and capable under provided conditions. Deliver an awe inspiring pitch with this creative food process tracking with control chart increased superiority for food products sample pdf bundle. Topics like action plan, resources, chart analysis can be discussed with this completely editable template. It is available for immediate download depending on the needs and requirements of the user.
The quality team will use control chart as food quality management tool. It will help in determining the food processes are stable and capable under provided conditions. Deliver an awe inspiring pitch with this creative food process tracking with control chart food security excellence ppt inspiration graphics example pdf bundle. Topics like action plan, resources, chart analysis can be discussed with this completely editable template. It is available for immediate download depending on the needs and requirements of the user.
The quality team will use control chart as food quality management tool. It will help in determining the food processes are stable and capable under provided conditions. Deliver an awe inspiring pitch with this creative food process tracking with control chart uplift food production company quality standards introduction pdf bundle. Topics like action plan, resources, chart analysis can be discussed with this completely editable template. It is available for immediate download depending on the needs and requirements of the user.
The quality team will use control chart as food quality management tool. It will help in determining the food processes are stable and capable under provided conditions. Deliver an awe inspiring pitch with this creative food process tracking with control chart assuring food quality and hygiene introduction pdf bundle. Topics like action plan, resources, chart analysis can be discussed with this completely editable template. It is available for immediate download depending on the needs and requirements of the user.


Presenting risk mitigation workflow chart with control system ppt powerpoint presentation ideas display pdf to dispense important information. This template comprises two stages. It also presents valuable insights into the topics including using this information, including, initial procedure. This is a completely customizable PowerPoint theme that can be put to use immediately. So, download it and address the topic impactfully.


Showcasing this set of slides titled safety process workflow chart with control risk ppt powerpoint presentation file format ideas pdf. The topics addressed in these templates are process, analyse, system. All the content presented in this PPT design is completely editable. Download it and make adjustments in color, background, font etc. as per your unique business setting.


Showcasing this set of slides titled project outline chart for successful planning and control ppt powerpoint presentation gallery slides pdf. The topics addressed in these templates are plan, execution, analysis monitor control. All the content presented in this PPT design is completely editable. Download it and make adjustments in color, background, font etc. as per your unique business setting.
The quality team will use control chart as food quality management tool. It will help in determining the food processes are stable and capable under provided conditions. Deliver an awe inspiring pitch with this creative food process tracking with control chart application of quality management for food processing companies background pdf bundle. Topics like action plan, resources, chart analysis can be discussed with this completely editable template. It is available for immediate download depending on the needs and requirements of the user.


This Slide highlights risk measure assessment matrix. It also includes insignificant, miner, moderate, major and disastrous levels of risks. Showcasing this set of slides titled business risk management and control chart ppt powerpoint presentation ideas graphics pictures pdf. The topics addressed in these templates are impact probability, moderate, major. All the content presented in this PPT design is completely editable. Download it and make adjustments in color, background, font etc. as per your unique business setting.


Showcasing this set of slides titled project closure chart with version control ppt professional deck pdf. The topics addressed in these templates are project closure report, project closure report version control. All the content presented in this PPT design is completely editable. Download it and make adjustments in color, background, font etc. as per your unique business setting.


Deliver an awe inspiring pitch with this creative stock control system volume open high low close chart ppt model slides pdf bundle. Topics like volume open high low close chart can be discussed with this completely editable template. It is available for immediate download depending on the needs and requirements of the user.


This slide represents the workflow for quality management system in business organization. It also provides details of employees responsible for each stage. Presenting business quality control workflow chart ppt powerpoint presentation gallery example pdf to dispense important information. This template comprises three stages. It also presents valuable insights into the topics including quality manager, quality reviewer, quality manager. This is a completely customizable PowerPoint theme that can be put to use immediately. So, download it and address the topic impactfully.


Vector Showing Flow Chart For Process Control Ppt PowerPoint Presentation Model Graphics Example PDF
Persuade your audience using this vector showing flow chart for process control ppt powerpoint presentation model graphics example pdf. This PPT design covers three stages, thus making it a great tool to use. It also caters to a variety of topics including vector showing flow chart for process control. Download this PPT design now to present a convincing pitch that not only emphasizes the topic but also showcases your presentation skills.


Showcasing this set of slides titled risk analysis chart with control measures ppt powerpoint presentation gallery sample pdf. The topics addressed in these templates are location, hazard, actions. All the content presented in this PPT design is completely editable. Download it and make adjustments in color, background, font etc. as per your unique business setting.


Persuade your audience using this division function control workflow chart ppt powerpoint presentation gallery design inspiration pdf. This PPT design covers one stages, thus making it a great tool to use. It also caters to a variety of topics including business, development, sales. Download this PPT design now to present a convincing pitch that not only emphasizes the topic but also showcases your presentation skills.
SHOW
- 60
- 120
- 180
DISPLAYING: 60 of 81 Item(s)
Page