 AI PPT Maker
 Templates
 PPT Bundles
 Design Services
 Business PPTs
 Business Plan
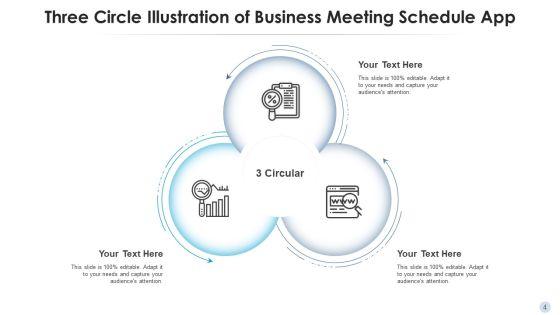
 Management
 Strategy
 Introduction PPT
 Roadmap
 Self Introduction
 Timelines
 Process
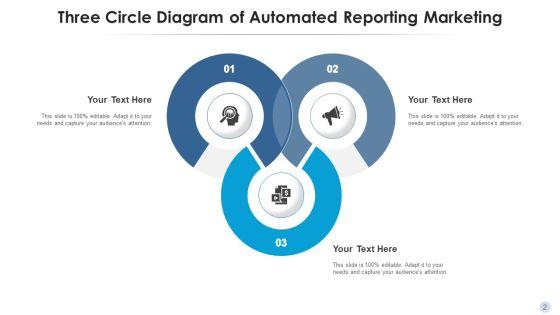
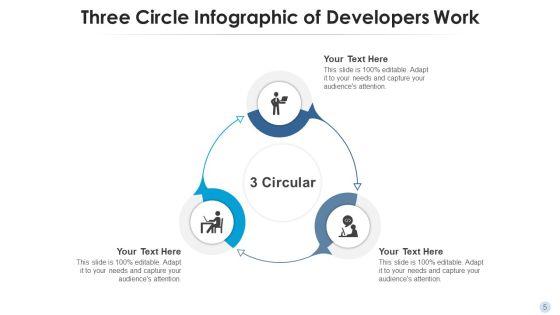
 Marketing
 Agenda
 Technology
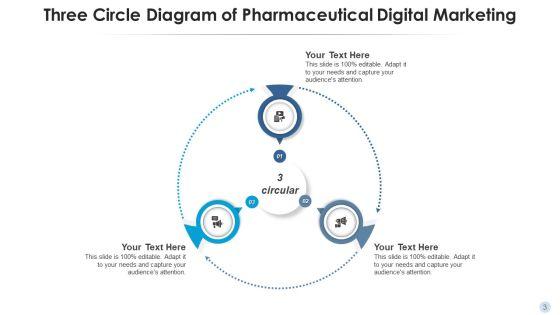
 Medical
 Startup Business Plan
 Cyber Security
 Dashboards
 SWOT
SWOT Proposals
 Education
 Pitch Deck
 Digital Marketing
 KPIs
KPIs Project Management
 Product Management
 Artificial Intelligence
 Target Market
 Communication
 Supply Chain
 Google Slides
 Research Services
 One Pagers
 All Categories
Circle-diagram PowerPoint Presentation Templates and Google Slides
SHOW
- 60
- 120
- 180
DISPLAYING: 60 of 258 Item(s)
Page


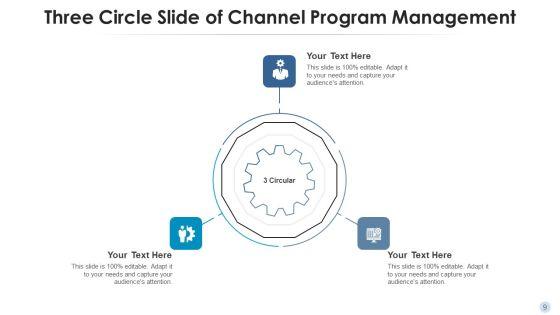
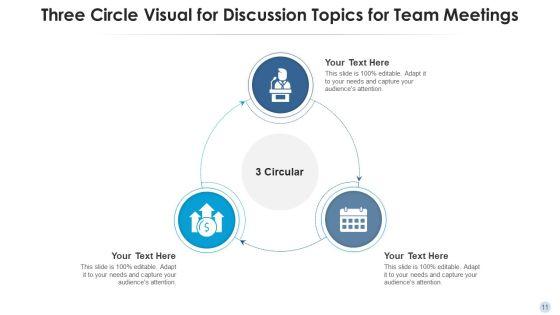
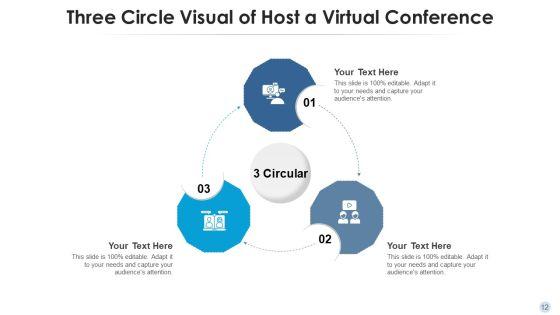


Improve your presentation delivery using this three circle diagram program management ppt powerpoint presentation complete deck with slides. Support your business vision and objectives using this well-structured PPT deck. This template offers a great starting point for delivering beautifully designed presentations on the topic of your choice. Comprising fourteen this professionally designed template is all you need to host discussion and meetings with collaborators. Each slide is self-explanatory and equipped with high-quality graphics that can be adjusted to your needs. Therefore, you will face no difficulty in portraying your desired content using this PPT slideshow. This PowerPoint slideshow contains every important element that you need for a great pitch. It is not only editable but also available for immediate download and utilization. The color, font size, background, shapes everything can be modified to create your unique presentation layout. Therefore, download it now.


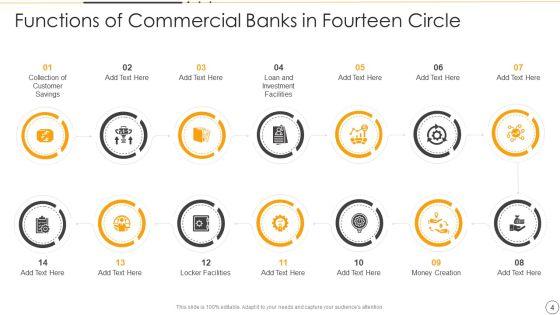


Improve your presentation delivery using this Fourteen Circle Diagram Ppt PowerPoint Presentation Complete Deck With Slides. Support your business vision and objectives using this well-structured PPT deck. This template offers a great starting point for delivering beautifully designed presentations on the topic of your choice. Comprising Twelve this professionally designed template is all you need to host discussion and meetings with collaborators. Each slide is self-explanatory and equipped with high-quality graphics that can be adjusted to your needs. Therefore, you will face no difficulty in portraying your desired content using this PPT slideshow. This PowerPoint slideshow contains every important element that you need for a great pitch. It is not only editable but also available for immediate download and utilization. The color, font size, background, shapes everything can be modified to create your unique presentation layout. Therefore, download it now.
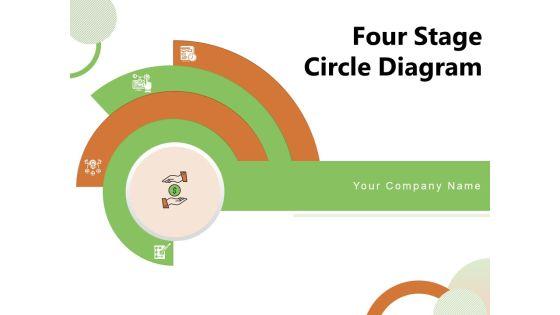
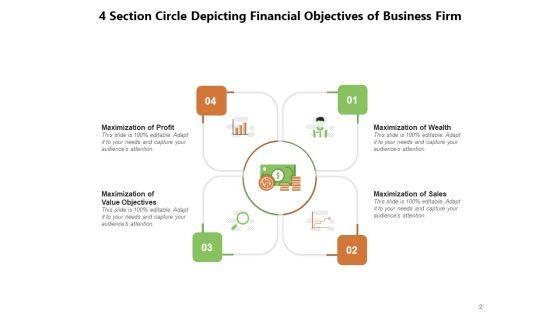
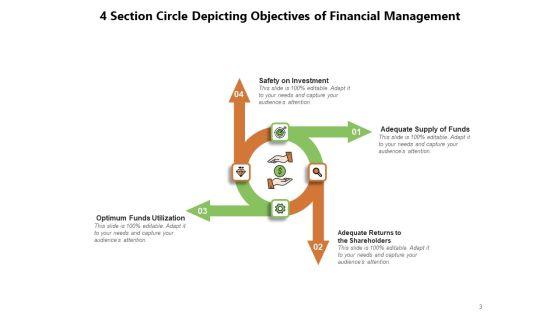

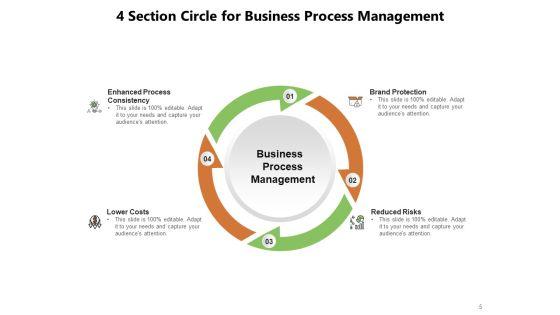

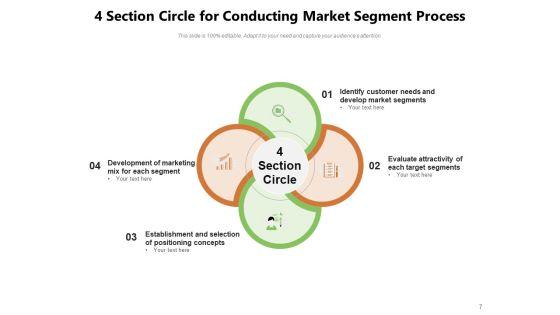


Presenting this set of slides with name four stage circle diagram business financial objectives ppt powerpoint presentation complete deck. The topics discussed in these slides are business, financial, objectives, process, circle. This is a completely editable PowerPoint presentation and is available for immediate download. Download now and impress your audience.


Presenting this set of slides with name five intersecting circles venn diagram with icons ppt powerpoint presentation styles samples. This is a five stage process. The stages in this process are 5 circle venn diagram, business process, venn diagram. This is a completely editable PowerPoint presentation and is available for immediate download. Download now and impress your audience.


This image slide displays diagram of circle with various business symbols. This image slide exhibits strategic model in circle. Use this PowerPoint template, in your presentations to express strategies on growth , target, management and planning in any business. This image slide will make your presentations colorful.


This image slide displays circle chart template. This innovative image slide has been designed with pie chart to represent progress. This image slide is 100% editable. You may change color, size and orientation of any icon to your liking. This image slide may be used in school, business and social presentations. Make your presentations interesting using this image slide.


Analyze Ailments On Our Business Cycle Diagram 3d Circle Puzzle Diagram 11 Stages Consulting Diagram Powerpoint Templates. Bring Out The Thinking Doctor In You. Dock Your Thoughts With Our Business Cycle Diagram 3d Circle Puzzle Diagram 11 Stages Consulting Diagram Powerpoint Templates. They Will Launch Them Into Orbit.


Analyze Ailments On Our Business Cycle Diagram 3d Circle Puzzle Diagram 10 Stages Slide Layout Consulting Diagram Powerpoint Templates. Bring Out The Thinking Doctor In You. Dock Your Thoughts With Our Business Cycle Diagram 3d Circle Puzzle Diagram 10 Stages Slide Layout Consulting Diagram Powerpoint Templates. They Will Launch Them Into Orbit.


SHOW
- 60
- 120
- 180
DISPLAYING: 60 of 258 Item(s)
Page