AI PPT Maker
Templates
PPT Bundles
Design Services
Business PPTs
Business Plan
Management
Strategy
Introduction PPT
Roadmap
Self Introduction
Timelines
Process
Marketing
Agenda
Technology
Medical
Startup Business Plan
Cyber Security
Dashboards
SWOT
Proposals
Education
Pitch Deck
Digital Marketing
KPIs
Project Management
Product Management
Artificial Intelligence
Target Market
Communication
Supply Chain
Google Slides
Research Services
One Pagers
All Categories
Circle Charts PowerPoint Presentation Templates and Google Slides
SHOW
- 60
- 120
- 180
DISPLAYING: 60 of 311 Item(s)
Page


Slide 1 of 14
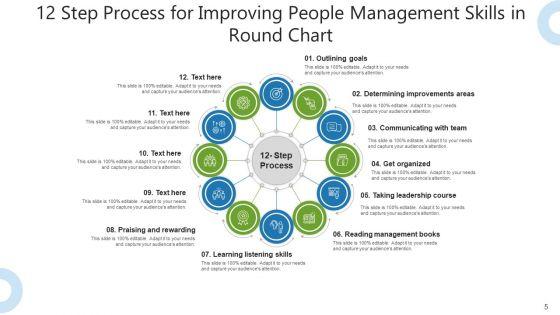
Improve your presentation delivery using this circle chart management process ppt powerpoint presentation complete deck with slides. Support your business vision and objectives using this well-structured PPT deck. This template offers a great starting point for delivering beautifully designed presentations on the topic of your choice. Comprising fourteen this professionally designed template is all you need to host discussion and meetings with collaborators. Each slide is self-explanatory and equipped with high-quality graphics that can be adjusted to your needs. Therefore, you will face no difficulty in portraying your desired content using this PPT slideshow. This PowerPoint slideshow contains every important element that you need for a great pitch. It is not only editable but also available for immediate download and utilization. The color, font size, background, shapes everything can be modified to create your unique presentation layout. Therefore, download it now.


Slide 1 of 12
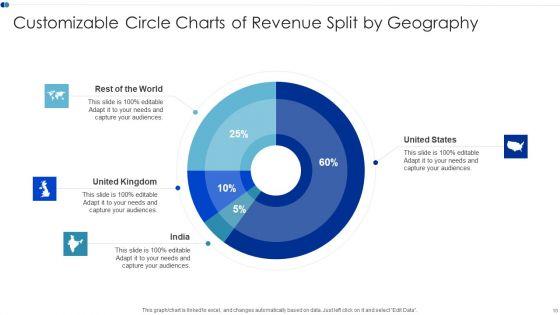
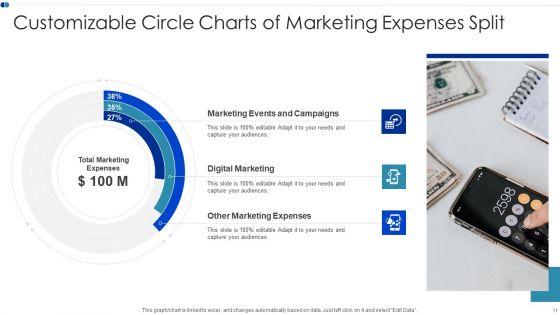
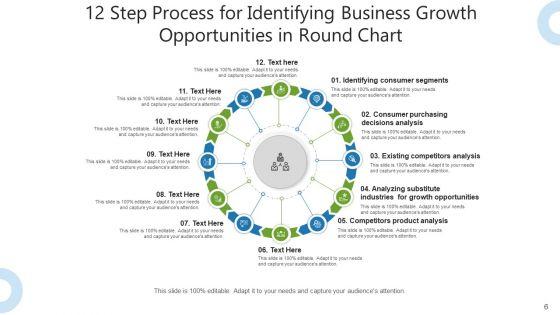
Improve your presentation delivery using this Customizable Circle Charts Infographic Ppt PowerPoint Presentation Complete Deck With Slides. Support your business vision and objectives using this well-structured PPT deck. This template offers a great starting point for delivering beautifully designed presentations on the topic of your choice. Comprising twelve this professionally designed template is all you need to host discussion and meetings with collaborators. Each slide is self-explanatory and equipped with high-quality graphics that can be adjusted to your needs. Therefore, you will face no difficulty in portraying your desired content using this PPT slideshow. This PowerPoint slideshow contains every important element that you need for a great pitch. It is not only editable but also available for immediate download and utilization. The color, font size, background, shapes everything can be modified to create your unique presentation layout. Therefore, download it now.


Slide 1 of 12
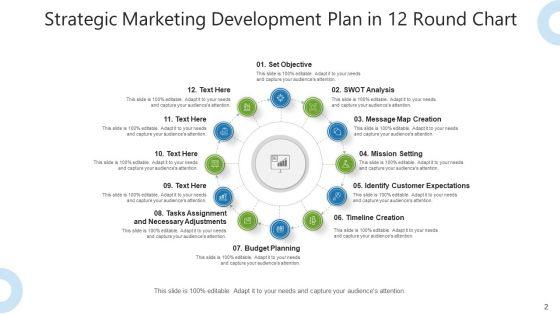
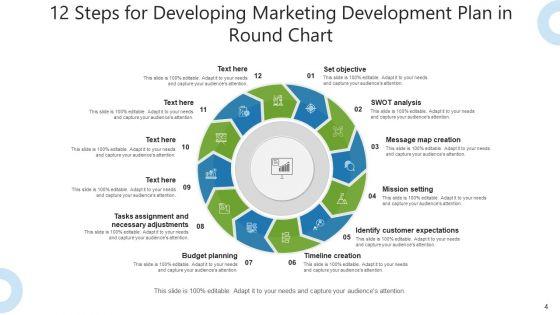
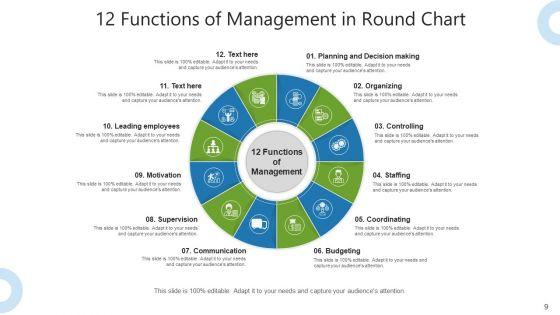
Boost your confidence and team morale with this well-structured circle chart twelve budget planning ppt powerpoint presentation complete deck with slides. This prefabricated set gives a voice to your presentation because of its well-researched content and graphics. Our experts have added all the components very carefully, thus helping you deliver great presentations with a single click. Not only that, it contains a set of twelve slides that are designed using the right visuals, graphics, etc. Various topics can be discussed, and effective brainstorming sessions can be conducted using the wide variety of slides added in this complete deck. Apart from this, our PPT design contains clear instructions to help you restructure your presentations and create multiple variations. The color, format, design anything can be modified as deemed fit by the user. Not only this, it is available for immediate download. So, grab it now.


Slide 1 of 7
This is a three circle chart for companys values ppt slide themes. This is a three stage process. The stages in this process are mission, company name, values, vision.


Slide 1 of 7
This is a customer loyalty circle chart powerpoint slide templates download. This is a six stage process. The stages in this process are grow, engage, attract, reward, retain, loyalty.


Slide 1 of 7
This is a key skills circle chart ppt infographics. This is a five stage process. The stages in this process are questioning, researching, analyzing, evaluating, communicating, key skills.


Slide 1 of 7
This is a six sigma linear circles chart presentation powerpoint templates. This is a five stage process. The stages in this process are bottom line, trained individuals, engagement, project by project, customer focused.


Slide 1 of 7
This is a six sigma circle chart powerpoint slide information. This is a five stage process. The stages in this process are bottom line, trained individuals, engagement, project by project, customer focused.


Slide 1 of 7
This is a voc semi circle chart presentation graphics. This is a six stage process. The stages in this process are business, marketing, management, success, diagram.


Slide 1 of 7
This is a circle arrow chart for operations process ppt samples. This is a six stage process. The stages in this process are arrows, icons, strategy, business, marketing.


Slide 1 of 7
This is a four circles spaghetti chart powerpoint slides design. This is a three stage process. The stages in this process are spaghetti diagram also used to described movement of people in a factory or office motion is waste, arrow, business, marketing, circles.


Slide 1 of 7
This is a product positioning circle chart powerpoint slide background. This is a eight stage process. The stages in this process are competitor claims, pricing, retailer mix, media reviews, product positioning, product features, imc mix, packaging, word of mouth.


Slide 1 of 7
This is a employee value proposition circle chart ppt example. This is a six stage process. The stages in this process are employer brand, career, engagement, retention, work contract, communications.


Slide 1 of 7
This is a brand building circle chart ppt example. This is a seven stage process. The stages in this process are long term perspective, positioning, quality, well blended communication, credibility, internal marketing, repositioning, brand building.


Slide 1 of 7
This is a business plan circle chart powerpoint slides templates. This is a six stage process. The stages in this process are information technology plan, human resources plan, production plan, marketing plan, marketing plan, financial plan, management plan.


Slide 1 of 6
Presenting this set of slides with name pie chart shapes making full circle ppt powerpoint presentation ideas example introduction. The topics discussed in these slides are pie chart, finance, donut chart. This is a completely editable PowerPoint presentation and is available for immediate download. Download now and impress your audience.


Slide 1 of 4
This is a possible solutions circle chart ppt slides. This is a six stage process. The stages in this process are puzzles or jigsaws, business, technology, light bulbs.\n\n\n\n


Slide 1 of 4
This is a five sigma road map circle chart ppt slides. This is a five stage process. The stages in this process are business, marketing, circle charts.\n\n


Slide 1 of 4
This is a communications strategy circle chart ppt slides. This is a six stage process. The stages in this process are communication, business, circle charts, success marketing.


Slide 1 of 4
Our above PPT slide contains process chart with icons. This PowerPoint template may be used to display strategic planning methodology. This template is designed to attract the attention of your audience.


Slide 1 of 4
This PowerPoint template has been designed with graphics of three circles and percentage ratios. You may use this dashboard slide design for topics like profit growth and financial planning. This PPT slide is powerful tool to describe your ideas.


Slide 1 of 4
This PowerPoint template has been designed with graphics of four circles and percentage ratios. You may use this dashboard slide design for topics like profit growth and financial planning. This PPT slide is powerful tool to describe your ideas.


Slide 1 of 4
This PowerPoint template contains sequential chart of five circles with icons. You may download this PPT slide to depict corporate vision, mission and strategy analysis. Add this slide to your presentation and impress your superiors.


Slide 1 of 4
This PowerPoint template has been designed with graphics of four options circle chart. This PowerPoint template may be used to display four steps of financial analysis. Prove the viability of your ideas using this impressive slide.


Slide 1 of 4
Our professionally designed business diagram is as an effective tool for communicating cyclic processes. It contains circular graphics with icons. Above slide is suitable to display process management steps.


Slide 1 of 4
This Power Point template slide has been designed with circle chart and icons. This PPT diagram may be used to outline marketing plan. Use this PPT diagram for business and finance related presentations.


Slide 1 of 4
Our above PowerPoint template displays linear circle tags. This Linear timeline template can be used for multiple purposes including event planning, new milestones and tasks. Download this PowerPoint timeline template to make impressive presentations.


Slide 1 of 4
This PowerPoint template has been designed with graphics of circle chart. You may download this PPT slide to depict man and woman ratio analysis. Add this slide to your presentation and impress your superiors.


Slide 1 of 4
Our above business diagram has been designed with four steps circle diagram. This PPT slide is suitable to present concepts in visual manner. Download this business slide to make impressive presentations.


Slide 1 of 4
This PowerPoint template has been designed with circular process diagram. This business diagram helps to exhibit financial process control and analysis. Use this diagram to visually support your content.


Slide 1 of 4
Communicate with your group through this professional slide. This PowerPoint template contains linear circle chart. This PowerPoint template is suitable for topics like market research and management.


Slide 1 of 4
This PowerPoint template slide contains graphics of four arrows circle chart. This PowerPoint diagram is suitable to present strategy process steps. Download this business slide to make impressive presentations.


Slide 1 of 4
Our above PPT slide contains graphics of circle chart with icons. This business diagram helps to exhibit global business strategy. Use this diagram to impart more clarity to subject and to create more sound impact on viewers.


Slide 1 of 4
This PPT slide has been designed with circular infographic diagram. This PowerPoint diagram is suitable for education and study related topics. This professional slide helps in making an instant impact on viewers.


Slide 1 of 4
Our above business slide has been designed with circle arrow chart. This slide is suitable to present corporate level strategy. Use this business diagram to present your work in a more smart and precise manner.


Slide 1 of 4
Visually support your presentation with our above template containing five circles linear chart with icons. This diagram slide may be used for comparing contrasting different business objects. Etch your views in the brains of your audience with this diagram slide.


Slide 1 of 4
This PowerPoint template has been designed with circular diagram of nine steps. You may use this PPT slide to display nine steps for goal planning. Impress your audiences by using this PPT slide.


Slide 1 of 4
This PowerPoint template contains four parts circle chart with percentage ratio. You may download this PPT slide design to display your ideas in visual manner. You can easily customize this template to make it more unique as per your need.


Slide 1 of 4
This PowerPoint template has been designed for business presentations and corporate slides. The PowerPoint template has a high quality design. You can download this PowerPoint slide for corporate presentations or annual meeting and business plans.


Slide 1 of 4
This PowerPoint template has been designed with four steps circle chart with finance icons. This PPT slide can be used to display business strategy plan. You can download finance PowerPoint template to prepare awesome presentations.


Slide 1 of 4
Circle Chart with Increasing Percentage Values power point Slides: - Show your achievements and targets with the ideal background. Above is the diagram to display how your business has been growing or your achievements. The slide is of the three circles having water at different levels in them. Therefore it becomes easy to show that in the first circle, the growth is at this much percent, then the second one and in the last circle, completed 85% of the targets. This PowerPoint template is easy to use to show the progress, and comparisons. All icons are editable. Choose them as per your need.


Slide 1 of 4
Every organization or business has its own process of working. And everyone has to follow this. It is easy to say it this way. But won?t it be much better if your colleagues or teammates see it graphically. Presenting circle chart with icons PPT template which is displaying the complete process in equal forms. This slide is a six step process divided equally among all the colleagues. It can also be taken as the planning. Planning in six different steps in a loop form. All icons are customizable. You can replace the icons as per your choice. Use this PowerPoint template to support your presentation and make it look more perfect.


Slide 1 of 4
This PowerPoint template has been created by professionals keeping in mind the need of light slides with more information. The slide uses minimalistic yet impactful visuals to explain a 4 step process. The reducing size of the circles can be creatively used to show that the process or the steps are getting an organization or a business firm closer to its targets or goals. There is ample space available to write text describe the steps involved in the process. This can be an ideal presentation for a company to show its financial plan or sales strategy to its investors or clients to gain their confidence. The icons and colors of the slide are customizable and can be edited to match the theme of the slide or the topic of the presentation.


Slide 1 of 4
This business slide contains circular infographic design. This diagram provides schematic representation of any information. Visual effect this slide helps in maintaining the flow of the discussion and provides more clarity to the subject.


Slide 1 of 4
This business slide contains circular infographic design. This diagram provides schematic representation of any information. Visual effect this slide helps in maintaining the flow of the discussion and provides more clarity to the subject.


Slide 1 of 4
This PowerPoint template contains design of circle chart with team icon and percentage ratios. You may download this slide to display steps for strategic growth planning. You can easily customize this template to make it more unique as per your need.


Slide 1 of 4
Above PPT slide provides the ideal backdrop to display marketing research analysis. This PowerPoint template contains graphics of circular arrows chart. Add this diagram in your presentations to visually support your content.


Slide 1 of 4
This PowerPoint template has been designed with circle chart. Download this PPT chart to depict financial ratio analysis. This PowerPoint slide is of great help in the business sector to make realistic presentations and provides effective way of presenting your newer thoughts.


Slide 1 of 3
Circular infographic has been displayed in this business slide. This business diagram helps to exhibit process steps in circular flow. Download this PowerPoint template to build an exclusive presentation.


Slide 1 of 3
Visually support your presentation with our above template containing graphic of circles flow chart with icons. This Powerpoint template helps to portray concepts like teamwork, planning and management. Etch your views in the brains of your audience with this diagram slide.


Slide 1 of 3
Our above business diagram has been designed with circle process infographic chart. You may download this diagram to display workflow and task management. This diagram provides an effective way of displaying information you can edit text, color, shade and style as per you need.


Slide 1 of 3
This PowerPoint template has been designed with diagram of footprints with smiley. Download this PPT slide to depict success steps. This diagram provides an effective way of displaying information you can edit text, color, shade and style as per you need.


Slide 1 of 3
Market analysis can be displayed with this business diagram slide. It contains chart of seven circles with icons. Download this diagram slide to make impressive presentations.


Slide 1 of 3
This business diagram displays graphics of flowchart with circles and icons. Download this diagram to represent flow of business activities. We have used icons in this diagram to give it professional look.


Slide 1 of 3
Four staged circular chart has been used to craft this PPT diagram. This PPT contains the concept of result analysis. Use this PPT in your business and sales presentation and display any kind of result analysis in a graphical way.


Slide 1 of 3
This business diagram provides a graphical overview of a continuing sequence of stages, tasks. This is an effective way of displaying information you can edit text, color, shade and style as per you need.


Slide 1 of 3
The structure of this diagram allows you to effectively highlight the key issues concerning the growth of your business through circle Process. Adjust the above diagram into your presentations to visually support your contents.


Slide 1 of 3
You can depict and analyze multiple possible process flows using this diagram. This diagram provides range of options to garner your interest. It builds on your foundation or prepares for change ahead to enhance the future.


Slide 1 of 3
This is a wonderful theme to show business steps. You have what it takes to grow. Take your team along by explaining your plans. Make your entire presentation visual by just cut-pasting your content in this diagram.


Slide 1 of 3
This is an amazing diagram to explain process by dissolving the stages of a process, or by depicting how process works. This is an excellent diagram which enhances the essence of your viable ideas. Use it to organize the logic of your views.
SHOW
- 60
- 120
- 180
DISPLAYING: 60 of 311 Item(s)
Page