AI PPT Maker
Templates
PPT Bundles
Design Services
Business PPTs
Business Plan
Management
Strategy
Introduction PPT
Roadmap
Self Introduction
Timelines
Process
Marketing
Agenda
Technology
Medical
Startup Business Plan
Cyber Security
Dashboards
SWOT
Proposals
Education
Pitch Deck
Digital Marketing
KPIs
Project Management
Product Management
Artificial Intelligence
Target Market
Communication
Supply Chain
Google Slides
Research Services
One Pagers
All Categories
Charts Showing PowerPoint Presentation Templates and Google Slides
SHOW
- 60
- 120
- 180
DISPLAYING: 60 of 727 Item(s)
Page


Slide 1 of 7
This is a succession planning hierarchy chart powerpoint slide show. This is a three stage process. The stages in this process are miller olson director ops and technology corporate, anita stevens group production manager service departments, harry smith it operations manager service departments, marry smith it operations manager service departments, cheri lee chief technology officer service departments, jass wilson senior human resources director service departments, joseph arnold service departments.


Slide 1 of 7
This is a vision mission goal infographic chart ppt slide show. This is a three stage process. The stages in this process are vision, mission, goal.


Slide 1 of 7
This is a competitor analysis 2 x 2 matrix chart powerpoint slide show. This is a four stage process. The stages in this process are competitor, your company, competitor, complex, simple, fast, slow.


Slide 1 of 7
This is a engineering team target chart powerpoint show. This is a four stage process. The stages in this process are areas of focus, result, metric, area.


Slide 1 of 7
This is a brand trade show calendar gantt chart example ppt presentation. This is a one stage process. The stages in this process are jan, feb, mar, apr, may, jun, jul, aug, sep, oct, nov, dec.


Slide 1 of 7
This is a online marketing gantt chart with timeline powerpoint show. This is a four stage process. The stages in this process are content, whitepaper development, webinars, email marketing, social media, content creation initiative, conversion initiative.


Slide 1 of 7
This is a tactical marketing strategy chart powerpoint slide show. This is a seven stage process. The stages in this process are chart, strategy, business, marketing, management.


Slide 1 of 7
This is a business model chart powerpoint slide show. This is a four stage process. The stages in this process are free.


Slide 1 of 7
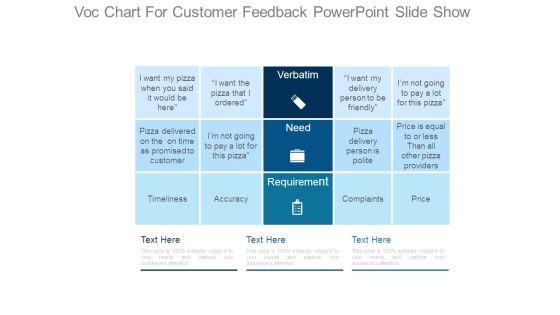
This is a voc chart for customer feedback powerpoint slide show. This is a three stage process. The stages in this process are i want my pizza when you said it would be here, pizza delivered on the on time as promised to customer, timeliness, i want the pizza that i ordered, im not going to pay a lot for this pizza, accuracy, verbatim, need, requirement, i want my delivery person to be friendly, pizza delivery person is polite, complaints, im not going to pay a lot for this pizza, price is equal to or less than all other pizza providers, price.


Slide 1 of 7
This is a value stream flow chart powerpoint slide show. This is a five stage process. The stages in this process are timeline, future, years, planning, marketing, business.


Slide 1 of 7
This is a personal characteristics flow chart powerpoint slide show. This is a three stage process. The stages in this process are should we serve those companies which show high loyalty to their suppliers, attitude, loyalty, personal characteristics.


Slide 1 of 7
This is a break point chart for quality analysis powerpoint slide show. This is a one stage process. The stages in this process are total variable costs, fixed costs, quality sold.


Slide 1 of 7
This is a business assessment ppt chart powerpoint slides show. This is a six stage process. The stages in this process are mission, goals, objectives, outcomes, result analysis, action.


Slide 1 of 7
This is a economic co operation and development chart powerpoint show. This is a six stage process. The stages in this process are co decision and co production, partnership, representation, pull communication, push communication, identify stake holder.


Slide 1 of 7
This is a business solutions development chart powerpoint slide show. This is a six stage process. The stages in this process are business value, resource leveraging, strategic positioning, developing people, creativity and innovation, focus on performance.


Slide 1 of 7
This is a marketing potency management chart ppt slide show. This is a five stage process. The stages in this process are viable to business, product, people, process, feasible to implement.


Slide 1 of 7
This is a team contribution and expectations chart powerpoint slide show. This is a six stage process. The stages in this process are task, individual, build the team, team, achieve task, develop individuals.


Slide 1 of 7
This is a consumer buying decision process chart powerpoint show. This is a six stage process. The stages in this process are purchase decision, information search, post purchase behavior, need recognition, brand beliefs, degree of importance.


Slide 1 of 7
This is a sales channel strategy chart powerpoint show. This is a four stage process. The stages in this process are channel integration, better offer, channel selection, more front of mind.


Slide 1 of 7
This is a sales conversion process chart powerpoint show. This is a six stage process. The stages in this process are invoicing, finance, sales, analysis, synthesis, knowledge.


Slide 1 of 7
This is a project management knowledge areas sample chart powerpoint show. This is a eight stage process. The stages in this process are comm, cost management, time, risk, quality, scope management, cost, time management, project management.


Slide 1 of 7
This is a cycle process flow chart powerpoint show. This is a six stage process. The stages in this process are sales and marketing, bidding process, requirements analysis, sale of good, production of goods, purchase of raw materials.


Slide 1 of 7
This is a financial investments pie chart design powerpoint show. This is a eight stage process. The stages in this process are stocks, real estate, mutual funds, precious metal, bonds, art, collectibles, antiques.


Slide 1 of 7
This is a organizational optimization infographic chart powerpoint slide show. This is a three stage process. The stages in this process are opportunities, roadmap, execution.


Slide 1 of 7
This is a areas of qualitative research chart powerpoint slide show. This is a nine stage process. The stages in this process are commercial, healthcare, communication, manufacturing, legal, financial,, education, government, technology.


Slide 1 of 7
This is a brand management systems chart powerpoint show. This is a six stage process. The stages in this process are brand perception stages, iterative perception tracking, solution usability, solution usp, solution tangibles, customer experience, solution continuity and enhancement, iterative perception tracking.


Slide 1 of 7
This is a corporate public relation puzzle chart powerpoint slide show. This is a nine stage process. The stages in this process are business partners, media, employees, customers, shareholders, investors, financial marketing, politics and state administration, pr.


Slide 1 of 7
This is a sales process map flow chart diagram powerpoint slide show. This is a seven stage process. The stages in this process are prospect, approach, interview, proposal, demonstration, negative, support.


Slide 1 of 7
This is a sales management hierarchy chart sample diagram powerpoint slide show. This is a seven stage process. The stages in this process are management role, operations role, finance role, marketing role, human resources role, sales role, technology role.


Slide 1 of 7
This is a gantt chart of the design process powerpoint show. This is a one stage process. The stages in this process are research, proposal, ideation and sketching, modeling, texturing, interaction.


Slide 1 of 7
This is a function chart with logical levels chart powerpoint show. This is a four stage process. The stages in this process are record receipts, identify receipts, code and enter receipts, reconcile receipts.


Slide 1 of 6
Presenting this set of slides with name pie chart donuts ppt powerpoint presentation show grid. The topics discussed in these slides are marketing, business, management, planning, strategy. This is a completely editable PowerPoint presentation and is available for immediate download. Download now and impress your audience.


Slide 1 of 6
Presenting this set of slides with name area chart investment ppt powerpoint presentation professional show. The topics discussed in these slides are financial, marketing, management, investment, analysis. This is a completely editable PowerPoint presentation and is available for immediate download. Download now and impress your audience.


Slide 1 of 6
Presenting this set of slides with name column chart graph ppt powerpoint presentation show model. The topics discussed in these slides are marketing, business, management, planning, strategy. This is a completely editable PowerPoint presentation and is available for immediate download. Download now and impress your audience.


Slide 1 of 6
Presenting this set of slides with name area chart analysis ppt powerpoint presentation show slides. The topics discussed in these slides are financial, marketing, management, investment, analysis. This is a completely editable PowerPoint presentation and is available for immediate download. Download now and impress your audience.


Slide 1 of 6
Presenting this set of slides with name line chart investment ppt powerpoint presentation portfolio show. The topics discussed in these slides are finance, marketing, management, investment, analysis. This is a completely editable PowerPoint presentation and is available for immediate download. Download now and impress your audience.


Slide 1 of 6
Presenting this set of slides with name chart showing communication monitoring ppt powerpoint presentation model slideshow. The topics discussed in these slides are revenue trend, bar chart, financial. This is a completely editable PowerPoint presentation and is available for immediate download. Download now and impress your audience.


Slide 1 of 6
Presenting this set of slides with name bar chart showing quarterly economic growth ppt powerpoint presentation infographic template slideshow. The topics discussed in these slides are revenue trend, bar chart, financial. This is a completely editable PowerPoint presentation and is available for immediate download. Download now and impress your audience.


Slide 1 of 6
Presenting this set of slides with name bar chart showing quarterly business sales ppt powerpoint presentation model icon. The topics discussed in these slides are revenue trend, bar chart, financial. This is a completely editable PowerPoint presentation and is available for immediate download. Download now and impress your audience.


Slide 1 of 6
Presenting this set of slides with name bar chart graph ppt powerpoint presentation ideas show. The topics discussed in these slides are marketing, business, management, planning, strategy. This is a completely editable PowerPoint presentation and is available for immediate download. Download now and impress your audience.


Slide 1 of 6
Presenting this set of slides with name project status bar chart ppt powerpoint presentation visual aids show. The topics discussed in these slides are project management, project progress, project growth. This is a completely editable PowerPoint presentation and is available for immediate download. Download now and impress your audience.


Slide 1 of 6
Presenting this set of slides with name donut chart analysis ppt powerpoint presentation styles show. The topics discussed in these slides are finance, marketing, management, investment, analysis. This is a completely editable PowerPoint presentation and is available for immediate download. Download now and impress your audience.


Slide 1 of 6
Presenting this set of slides with name pencil bar chart showing marketing fluctuation ppt powerpoint presentation outline show. The topics discussed in these slides are education, growth, pencil bar graph. This is a completely editable PowerPoint presentation and is available for immediate download. Download now and impress your audience.


Slide 1 of 6
Presenting this set of slides with name colorful pie chart with five sections ppt powerpoint presentation show example file. The topics discussed in these slides are pie chart, finance, donut chart. This is a completely editable PowerPoint presentation and is available for immediate download. Download now and impress your audience.


Slide 1 of 6
Presenting this set of slides with name pie chart showing risk percentage levels ppt powerpoint presentation slides shapes. The topics discussed in these slides are high low risk, risk con, warning. This is a completely editable PowerPoint presentation and is available for immediate download. Download now and impress your audience.


Slide 1 of 6
This is a column chart finance ppt powerpoint presentation show background. The topics discussed in this diagram are marketing, business, management, planning, strategy This is a completely editable PowerPoint presentation, and is available for immediate download.


Slide 1 of 6
This is a bar chart showing consumer adoption patterns ppt powerpoint presentation outline professional. The topics discussed in this diagram are customer service, customer success, customer adoption. This is a completely editable PowerPoint presentation, and is available for immediate download.


Slide 1 of 6
This is a stacked column chart ppt powerpoint presentation professional show. This is a three stage process. The stages in this process are business, management, marketing, growth.


Slide 1 of 6
This is a area chart finance marketing ppt powerpoint presentation show grid. This is a three stage process. The stages in this process are finance, marketing, management, investment, analysis.


Slide 1 of 6
This is a waterfall chart showing ytd sales change ppt powerpoint presentation professional format. This is a ten stage process. The stages in this process are sales waterfall, waterfall chart, business.


Slide 1 of 6
This is a waterfall chart showing effective pricing and profitability insight ppt powerpoint presentation icon graphics. This is a seven stage process. The stages in this process are sales waterfall, waterfall chart, business.


Slide 1 of 6
This is a revenue waterfall chart showing fixed and variable cost ppt powerpoint presentation infographic template images. This is a five stage process. The stages in this process are sales waterfall, waterfall chart, business.


Slide 1 of 6
This is a hobbies pie chart ppt powerpoint presentation show smartart. This is a five stage process. The stages in this process are financial, business, marketing, management, pie chart.


Slide 1 of 6
This is a financial charts and graphs for statistical analysis ppt powerpoint presentation show layout. This is a four stage process. The stages in this process are business metrics, business kpi, business dashboard.


Slide 1 of 6
This is a computer screen with business data charts ppt powerpoint presentation show vector. This is a four stage process. The stages in this process are business metrics, business kpi, business dashboard.


Slide 1 of 6
This is a donut pie chart investment ppt powerpoint presentation show guide. This is a four stage process. The stages in this process are donut pie chart, finance, marketing, business, analysis.


Slide 1 of 6
This is a bar charts for business performance analysis ppt powerpoint presentation show slideshow. This is a two stage process. The stages in this process are compare, comparison of two, competitive analysis.


Slide 1 of 6
This is a 8 sections pie chart for data comparison ppt powerpoint presentation show slideshow. This is a eight stage process. The stages in this process are 6 piece pie chart, 6 segment pie chart, 6 parts pie chart.


Slide 1 of 6
This is a 3d charts for comparing amounts and volume ppt powerpoint presentation show deck. This is a five stage process. The stages in this process are art, colouring, paint brush.


Slide 1 of 5
Presenting this set of slides with name umbrella chart showing process of improvement ppt powerpoint presentation summary visuals. The topics discussed in these slides are kaizen umbrella, continuous improvement, business process. This is a completely editable PowerPoint presentation and is available for immediate download. Download now and impress your audience.
SHOW
- 60
- 120
- 180
DISPLAYING: 60 of 727 Item(s)
Page