 AI PPT Maker
 Templates
 PPT Bundles
 Design Services
 Business PPTs
 Business Plan
 Management
 Strategy
 Introduction PPT
 Roadmap
 Self Introduction
 Timelines
 Process
 Marketing
 Agenda
 Technology
 Medical
 Startup Business Plan
 Cyber Security
 Dashboards
 SWOT
SWOT Proposals
 Education
 Pitch Deck
 Digital Marketing
 KPIs
KPIs Project Management
 Product Management
 Artificial Intelligence
 Target Market
 Communication
 Supply Chain
 Google Slides
 Research Services
 One Pagers
 All Categories
Charts graphs PowerPoint Presentation Templates and Google Slides
SHOW
- 60
- 120
- 180
DISPLAYING: 60 of 329 Item(s)
Page


Improve your presentation delivery using this Diminishing Graph And Chart Ppt PowerPoint Presentation Complete With Slides. Support your business vision and objectives using this well-structured PPT deck. This template offers a great starting point for delivering beautifully designed presentations on the topic of your choice. Comprising tweleve this professionally designed template is all you need to host discussion and meetings with collaborators. Each slide is self-explanatory and equipped with high-quality graphics that can be adjusted to your needs. Therefore, you will face no difficulty in portraying your desired content using this PPT slideshow. This PowerPoint slideshow contains every important element that you need for a great pitch. It is not only editable but also available for immediate download and utilization. The color, font size, background, shapes everything can be modified to create your unique presentation layout. Therefore, download it now.


Presenting this set of slides with name area chart graph ppt powerpoint presentation diagram templates. The topics discussed in these slides are marketing, business, management, planning, strategy. This is a completely editable PowerPoint presentation and is available for immediate download. Download now and impress your audience.


Presenting this set of slides with name bar chart graph ppt powerpoint presentation outline structure. The topics discussed in these slides are marketing, business, management, planning, strategy. This is a completely editable PowerPoint presentation and is available for immediate download. Download now and impress your audience.


Presenting this set of slides with name area chart graph ppt powerpoint presentation inspiration graphics pictures. The topics discussed in these slides are marketing, business, management, planning, strategy. This is a completely editable PowerPoint presentation and is available for immediate download. Download now and impress your audience.


Presenting this set of slides with name bubble chart graph ppt powerpoint presentation gallery visuals. The topics discussed in these slides are marketing, business, management, planning, strategy. This is a completely editable PowerPoint presentation and is available for immediate download. Download now and impress your audience.


Presenting this set of slides with name bar graph chart ppt powerpoint presentation gallery example. The topics discussed in these slides are marketing, business, management, planning, strategy. This is a completely editable PowerPoint presentation and is available for immediate download. Download now and impress your audience.


Presenting this set of slides with name area chart graph ppt powerpoint presentation infographic template template. The topics discussed in these slides are marketing, business, management, planning, strategy. This is a completely editable PowerPoint presentation and is available for immediate download. Download now and impress your audience.


Presenting this set of slides with name column chart graph ppt powerpoint presentation show model. The topics discussed in these slides are marketing, business, management, planning, strategy. This is a completely editable PowerPoint presentation and is available for immediate download. Download now and impress your audience.


Presenting this set of slides with name bar chart graph ppt powerpoint presentation ideas show. The topics discussed in these slides are marketing, business, management, planning, strategy. This is a completely editable PowerPoint presentation and is available for immediate download. Download now and impress your audience.


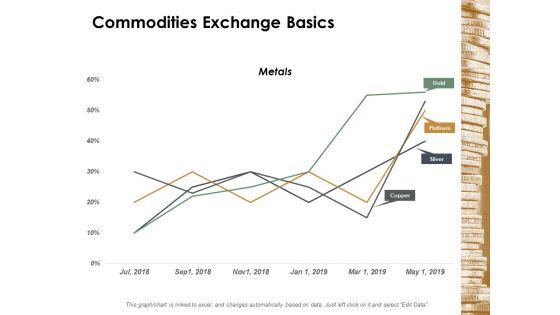
Presenting this set of slides with name line chart graph ppt powerpoint presentation gallery structure. The topics discussed in these slides are marketing, business, management, planning, strategy. This is a completely editable PowerPoint presentation and is available for immediate download. Download now and impress your audience.


Presenting this set of slides with name bar graph chart analysis ppt powerpoint presentation gallery objects. The topics discussed in these slides are finance, marketing, management, investment, analysis. This is a completely editable PowerPoint presentation and is available for immediate download. Download now and impress your audience.


Presenting this set of slides with name bar graph chart analysis ppt powerpoint presentation outline good. The topics discussed in these slides are finance, marketing, management, investment, analysis. This is a completely editable PowerPoint presentation and is available for immediate download. Download now and impress your audience.


Presenting this set of slides with name line chart graph bar ppt powerpoint presentation gallery layout. The topics discussed in these slides are marketing, business, management, planning, strategy. This is a completely editable PowerPoint presentation and is available for immediate download. Download now and impress your audience.


Presenting this set of slides with name area chart graph ppt powerpoint presentation infographics slide download. The topics discussed in these slides are marketing, business, management, planning, strategy. This is a completely editable PowerPoint presentation and is available for immediate download. Download now and impress your audience.


Presenting this set of slides with name gantt chart bar graph ppt powerpoint presentation summary rules. The topics discussed in these slides are marketing, business, management, planning, strategy. This is a completely editable PowerPoint presentation and is available for immediate download. Download now and impress your audience.


Presenting this set of slides with name gantt chart graph ppt powerpoint presentation inspiration examples. The topics discussed in these slides are marketing, business, management, planning, strategy. This is a completely editable PowerPoint presentation and is available for immediate download. Download now and impress your audience


Presenting this set of slides with name data migration approach ppt powerpoint presentation diagram graph charts. This is a six stage process. The stages in this process are business, management, planning, strategy, marketing. This is a completely editable PowerPoint presentation and is available for immediate download. Download now and impress your audience.


Presenting this set of slides with name manufacturing budgeting ppt powerpoint presentation diagram graph charts cpb. This is an editable Powerpoint five stages graphic that deals with topics like manufacturing budgeting to help convey your message better graphically. This product is a premium product available for immediate download and is 100 percent editable in Powerpoint. Download this now and use it in your presentations to impress your audience.


Presenting this set of slides with name online marketing funnel ppt powerpoint presentation diagram graph charts cpb. This is an editable Powerpoint five stages graphic that deals with topics like online marketing funnel to help convey your message better graphically. This product is a premium product available for immediate download and is 100 percent editable in Powerpoint. Download this now and use it in your presentations to impress your audience.


Presenting this set of slides with name plan implementation steps ppt powerpoint presentation diagram graph charts cpb. This is an editable Powerpoint four stages graphic that deals with topics like plan implementation steps to help convey your message better graphically. This product is a premium product available for immediate download and is 100 percent editable in Powerpoint. Download this now and use it in your presentations to impress your audience.


Presenting this set of slides with name creating better working environment storage ppt powerpoint presentation diagram graph charts. The topics discussed in these slides are strength, marketing, business, management, planning. This is a completely editable PowerPoint presentation and is available for immediate download. Download now and impress your audience.


Presenting this set of slides with name compare intent b2b marketing pricing ppt powerpoint presentation diagram graph charts cpb. This is an editable Powerpoint six stages graphic that deals with topics like compare intent b2b marketing pricing to help convey your message better graphically. This product is a premium product available for immediate download and is 100 percent editable in Powerpoint. Download this now and use it in your presentations to impress your audience.


Strategic Sales Plan Marketing And Service Delivery Ppt Powerpoint Presentation Diagram Graph Charts
This is a strategic sales plan marketing and service delivery ppt powerpoint presentation diagram graph charts. This is a three stage process. The stages in this process are one page strategy, one page plan, one page approach.


SHOW
- 60
- 120
- 180
DISPLAYING: 60 of 329 Item(s)
Page