AI PPT Maker
Templates
PPT Bundles
Design Services
Business PPTs
Business Plan
Management
Strategy
Introduction PPT
Roadmap
Self Introduction
Timelines
Process
Marketing
Agenda
Technology
Medical
Startup Business Plan
Cyber Security
Dashboards
SWOT
Proposals
Education
Pitch Deck
Digital Marketing
KPIs
Project Management
Product Management
Artificial Intelligence
Target Market
Communication
Supply Chain
Google Slides
Research Services
One Pagers
All Categories
Business Results PowerPoint Presentation Templates and Google Slides
SHOW
- 60
- 120
- 180
DISPLAYING: 60 of 304 Item(s)
Page


Slide 1 of 56
This complete deck acts as a great communication tool. It helps you in conveying your business message with personalized sets of graphics, icons etc. Comprising a set of fifty six slides, this complete deck can help you persuade your audience. It also induces strategic thinking as it has been thoroughly researched and put together by our experts. Not only is it easily downloadable but also editable. The color, graphics, theme any component can be altered to fit your individual needs. So grab it now.


Slide 1 of 47
This complete deck acts as a great communication tool. It helps you in conveying your business message with personalized sets of graphics, icons etc. Comprising a set of fortyseven slides, this complete deck can help you persuade your audience. It also induces strategic thinking as it has been thoroughly researched and put together by our experts. Not only is it easily downloadable but also editable. The color, graphics, theme any component can be altered to fit your individual needs. So grab it now.


Slide 1 of 12
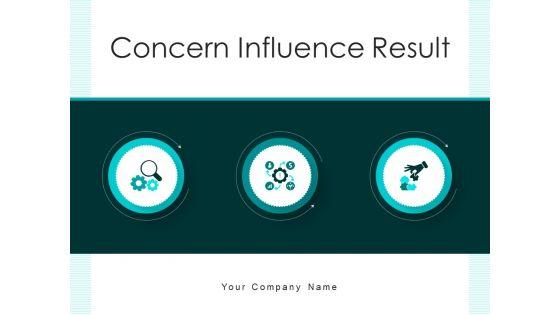
If designing a presentation takes a lot of your time and resources and you are looking for a better alternative, then this concern influence result business performance ppt powerpoint presentation complete deck is the right fit for you. This is a prefabricated set that can help you deliver a great presentation on the topic. All the twelve slides included in this sample template can be used to present a birds-eye view of the topic. These slides are also fully editable, giving you enough freedom to add specific details to make this layout more suited to your business setting. Apart from the content, all other elements like color, design, theme are also replaceable and editable. This helps in designing a variety of presentations with a single layout. Not only this, you can use this PPT design in formats like PDF, PNG, and JPG once downloaded. Therefore, without any further ado, download and utilize this sample presentation as per your liking.


Slide 1 of 7
This is a evaluation matrix for business result powerpoint slide background. This is a four stage process. The stages in this process are matrix, business, marketing.


Slide 1 of 7
This is a business result evaluation matrix powerpoint slide rules. This is a four stage process. The stages in this process are matrix, business, presentation, success, strategy.


Slide 1 of 7
This is a business result analysis tracking powerpoint templates. This is a five stage process. The stages in this process are magnifier, arrows, business, marketing, strategy.


Slide 1 of 7
This is a business plans for results flowchart ppt slides themes. This is a six stage process. The stages in this process are business plan, objectives, mission, key to success, products and services, market analysis.


Slide 1 of 6
Presenting this set of slides with name bar graph for four years business result analysis ppt powerpoint presentation icon show. The topics discussed in these slides are financial targets, financial goals, growth profitability. This is a completely editable PowerPoint presentation and is available for immediate download. Download now and impress your audience.


Slide 1 of 6
This is a business kpi and benchmarking competence results success ppt powerpoint presentation icon graphic images. This is a four stage process. The stages in this process are best practice, best technique, best procedure.


Slide 1 of 5
Presenting this set of slides with name business quarterly result analysis ppt powerpoint presentation ideas graphics download. The topics discussed in these slides are heat map, data analytics, business quarterly. This is a completely editable PowerPoint presentation and is available for immediate download. Download now and impress your audience.


Slide 1 of 5
This is a business aims and results ppt powerpoint presentation portfolio show. This is a five stage process. The stages in this process are objective and benefit, goal and benefit, plan and benefit.


Slide 1 of 5
This is a business aims and results analysis ppt powerpoint presentation gallery format. This is a four stage process. The stages in this process are objective and benefit, goal and benefit, plan and benefit.


Slide 1 of 5
This is a business goals and results with three points ppt powerpoint presentation layouts grid. This is a three stage process. The stages in this process are objective and benefit, goal and benefit, plan and benefit.


Slide 1 of 5
This is a business goals and results with six points ppt powerpoint presentation infographic template shapes. This is a six stage process. The stages in this process are objective and benefit, goal and benefit, plan and benefit.


Slide 1 of 5
This is a business goals and results with seven points ppt powerpoint presentation slides show. This is a seven stage process. The stages in this process are objective and benefit, goal and benefit, plan and benefit.


Slide 1 of 5
This is a business goals and results with icons ppt powerpoint presentation infographic template mockup. This is a five stage process. The stages in this process are objective and benefit, goal and benefit, plan and benefit.


Slide 1 of 5
This is a business process management result implementation strategy ppt powerpoint presentation infographic template layout. This is a three stage process. The stages in this process are business growth, people process product, 3ps.


Slide 1 of 5
This is a business process improvement identify issues check results ppt powerpoint presentation pictures slide download. This is a four stage process. The stages in this process are diagram of kaizen, diagram of improvements, diagram of enhancement.


Slide 1 of 5
This is a business process improvement establish objectives review results ppt powerpoint presentation show structure. This is a nine stage process. The stages in this process are diagram of kaizen, diagram of improvements, diagram of enhancement.


Slide 1 of 5
This is a market research results business ppt powerpoint presentation infographic template ideas. This is a four stage process. The stages in this process are business, planning, strategy, marketing, management.


Slide 1 of 5
This is a expected business results in future ppt powerpoint presentation visuals. This is a one stage process. The stages in this process are arrow, marketing, management, business, strategy.


Slide 1 of 4
This is a analyze results business ppt slides. This is a one stage process. The stages in this process are business, success.


Slide 1 of 3
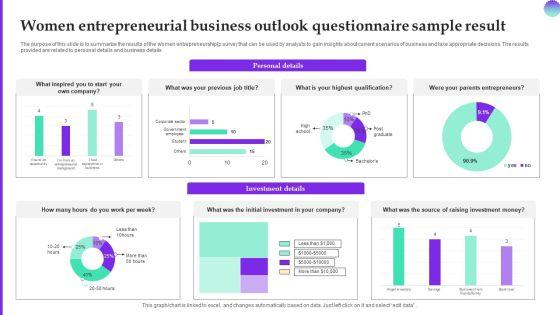
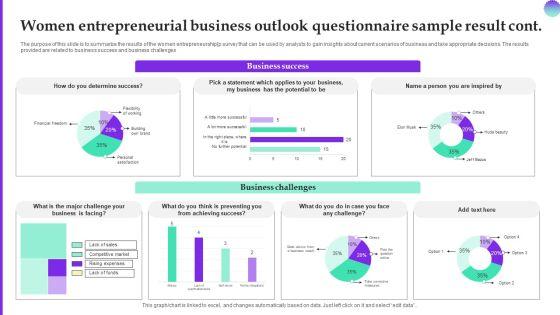
The purpose of this slide is to summarize the results of the women entrepreneurship survey that can be used by analysts to gain insights about current scenarios of business and take appropriate decisions. The results provided are related to personal details and business details. Showcasing this set of slides titled Women Entrepreneurial Business Outlook Questionnaire Sample Result Survey SS. The topics addressed in these templates are Entrepreneurial Business, Questionnaire Sample Result. All the content presented in this PPT design is completely editable. Download it and make adjustments in color, background, font etc. as per your unique business setting.


Slide 1 of 3
This power point icon slide has been designed with four different icons. Icons of bank, bar graph and business deal have been displayed in this slide. Use these icons in your presentations to add professional impact.


Slide 1 of 3
Our above slide displays three circles representing market research results. Download our above diagram to express information in a visual way. This diagram offers a way for your audience to visually conceptualize the process.


Slide 1 of 3
This business slide contains graphics of pie chart with business icons. Download this impressive diagram to present marketing performance measurement. This image slide is best to present your newer thoughts.


Slide 1 of 3
Six staged pie chart is used to design this business slide. Download this diagram to make business and financial reports. Use our above diagram to express information in a visual way.


Slide 1 of 3
Three different pie charts are used to designed this power point template slide. This PPT slide contains the concept of result analysis. Use this PPT slide for your data and process related presentations.


Slide 1 of 3
This PowerPoint template displays technology gadgets with various business charts. Use this diagram slide, in your presentations to make business reports for statistical analysis. You may use this diagram to impart professional appearance to your presentations.


Slide 1 of 3
This diagram displays human face graphic divided into sections. This section can be used for data display. Use this diagram to build professional presentations for your viewers.


Slide 1 of 3
This business diagram displays graphic of pie charts in shape of flasks. This business slide is suitable to present and compare business data. Use this diagram to build professional presentations for your viewers.


Slide 1 of 3
This business diagram displays graphic of pie charts. This business slide is suitable to present and compare business data. Use this diagram to build professional presentations for your viewers.


Slide 1 of 3
This Power Point diagram has been designed with graphic of column chart. It contains diagram of bar char depicting annual business progress report. Use this diagram to build professional presentations for your viewers.


Slide 1 of 3
This business slide displays alarm clock with pie chart. This diagram is a data visualization tool that gives you a simple way to present statistical information. This slide helps your audience examine and interpret the data you present.


Slide 1 of 3
This business diagram displays 2015 year numbers with pie chart. This diagram is suitable to display business strategy for year 2015. Download this professional slide to present information in an attractive manner


Slide 1 of 3
This Power Point diagram has been crafted with pie chart in shape of lock. It contains diagram of lock pie chart to compare and present data in an effective manner. Use this diagram to build professional presentations for your viewers.


Slide 1 of 3
This business diagram has graphic of 3d lack bar graph. This diagram is a data visualization tool that gives you a simple way to present statistical information. This slide helps your audience examine and interpret the data you present.


Slide 1 of 3
This business diagram displays graphic of pie chart. This business slide contains the concept of business data representation. Use this diagram to build professional presentation for your viewers.


Slide 1 of 3
This business slide displays five staged pie chart. This diagram is a data visualization tool that gives you a simple way to present statistical information. This slide helps your audience examine and interpret the data you present.


Slide 1 of 3
This business diagram displays graphic of five staged process flow diagram. This PPT slide contains the concept of business data representation. Use this diagram to build professional presentation for your viewers.


Slide 1 of 3
Concept of business result analysis has been displayed in this power point template. This PPT contains the colored pie graph with bar graph. Use this PPT for your business and marketing result analysis related presentations.


Slide 1 of 3
This business slide displays six staged pie chart. This diagram is a data visualization tool that gives you a simple way to present statistical information. This slide helps your audience examine and interpret the data you present.


Slide 1 of 3
This business slide displays nine staged pie chart. This diagram is a data visualization tool that gives you a simple way to present statistical information. This slide helps your audience examine and interpret the data you present.


Slide 1 of 3
Key shaped pie graph has been used to design this business diagram. This slide has key graphic with abcd options. Use this amazing slide to present a business plan. Download this slide to impress your viewers.


Slide 1 of 3
This Power Point template has been designed with graphic of bar graph on mobile phone. This business diagram can be used to make business reports. Download this Power Point slide to build quality presentation for your viewers.


Slide 1 of 3
This Power Point template has been designed with graphic of 3d graphic and colored bar graph. Use this slide to represent six steps of any business process. Use this diagram for your business presentations and get exclusive comments on your efforts.


Slide 1 of 3
Display the concept of result analysis in your business presentation. This PPT slide contains the graphic of six pie charts. Use this PPT slide for your business and marketing data related presentations.


Slide 1 of 3
Graphic of fish bone has been used to design this Power Point template slide. This PPT slide contains the concept of problem analysis and root cause analysis. Use this PPT slide and display process of root cause analysis for any field. This PPT slide is very well designed for business and production related problem analysis.


Slide 1 of 3
Develop competitive advantage with this image which contains 3d pie chart with five steps. Use this image to define steps of business process with this image of pie chart. This image is an excellent tool to give an ideal presentation.


Slide 1 of 3
This image slide displays bar graph. This image has been designed with graphic of 3d multicolor bar graph of solid cylinder shape. Use this image slide, in your presentations to express views on finance, growth and success. This image slide may also be used to exhibit any information which requires visual presentation in your presentations. This image slide will enhance the quality of your presentations.


Slide 1 of 3
This high quality image is designed with pie chart. Use this image to make business reports. Use this outstanding image in presentations relating to data analysis and reports. Go ahead and add charm to your presentations.


Slide 1 of 3
This high quality image is designed with pie chart. Use this image to make business reports. Use this outstanding image in presentations relating to data analysis and reports. Go ahead and add charm to your presentations.


Slide 1 of 3
Your Listeners Will Never Doodle. Our Business Framework Model Results Display On Timeline Roadmap Diagram Sales Diagram Power point Templates Will Hold Their Concentration.


Slide 1 of 3
Knock On The Door To Success With Our Sales Diagram Pie Chart For Financial Result Business Diagram Powerpoint Templates. Be Assured Of Gaining Entry. Give Them A Dose Of Your Ability. It Will Go Down Well With Our Sales Diagram Pie Chart For Financial Result Business Diagram Powerpoint Templates.


Slide 1 of 3
Our Sales Diagram Financial Result Display Bar Graph Diagram Business Framework Model Powerpoint Templates Deliver At Your Doorstep. Let Them In For A Wonderful Experience. Dig Out The Dope With Our Sales Diagram Financial Result Display Bar Graph Diagram Business Framework Model Powerpoint Templates. Your Thoughts Will Expose The Truth.


Slide 1 of 3
Document Your Views On Our Business Cycle Diagram Financial Result Ratings Diagram Strategy Diagram Powerpoint Templates. They Will Create A Strong Impression. Plan Your Documentary Shot By Shot. Break Them Down On Our Business Cycle Diagram Financial Result Ratings Diagram Strategy Diagram Powerpoint Templates.


Slide 1 of 3
Analyze Ailments On Our Business Cycle Diagram Annual Growth Of Financial Result Strategic Management Powerpoint Templates. Bring Out The Thinking Doctor In You. Dock Your Thoughts With Our Business Cycle Diagram Annual Growth Of Financial Result Strategic Management Powerpoint Templates. They Will Launch Them Into Orbit.


Slide 1 of 3
Your Listeners Will Never Doodle. Our Business Cycle Diagram Three Results of One Line Strategic Management Powerpoint Templates Will Hold Their Concentration. Do The One Thing With Your Thoughts. Uphold Custom With OurBusiness Cycle Diagram Three Results of One Line Strategic Management Powerpoint Templates.


Slide 1 of 3
Analyse ailments on our Business Diagram 3 Staged Result Funnel Diagram Business Cycle Diagram Powerpoint Templates. Bring out the thinking doctor in you. Dock your thoughts with our Business Diagram 3 Staged Result Funnel Diagram Business Cycle Diagram Powerpoint Templates. They will launch them into orbit.


Slide 1 of 3
Be The Doer With Our Sales_Diagram_Contributing_Causes_And_Their_Result_Business_Cycle_Diagram Powerpoint Templates. Put Your Thoughts Into Practice.
SHOW
- 60
- 120
- 180
DISPLAYING: 60 of 304 Item(s)
Page