AI PPT Maker
Templates
PPT Bundles
Design Services
Business PPTs
Business Plan
Management
Strategy
Introduction PPT
Roadmap
Self Introduction
Timelines
Process
Marketing
Agenda
Technology
Medical
Startup Business Plan
Cyber Security
Dashboards
SWOT
Proposals
Education
Pitch Deck
Digital Marketing
KPIs
Project Management
Product Management
Artificial Intelligence
Target Market
Communication
Supply Chain
Google Slides
Research Services
 One Pagers
All Categories
Business pie chart PowerPoint Presentation Templates and Google Slides
SHOW
- 60
- 120
- 180
DISPLAYING: 60 of 607 Item(s)
Page

Slide 1 of 12
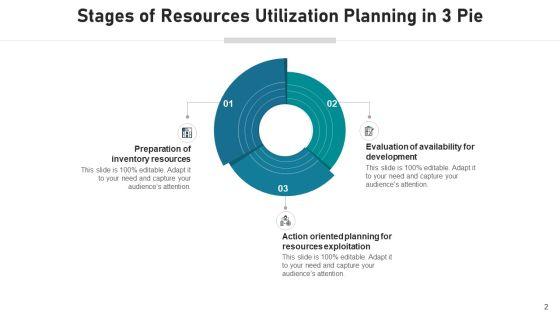
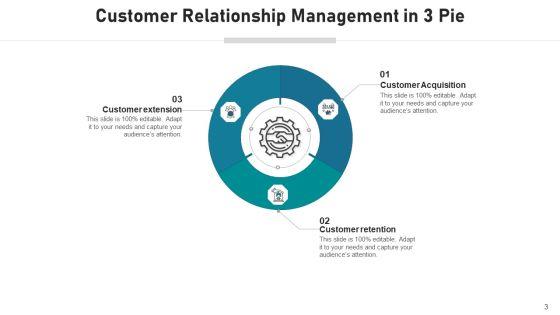
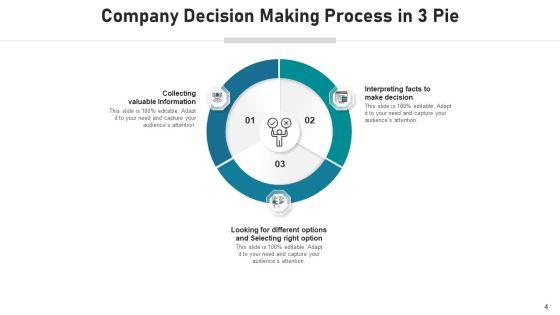
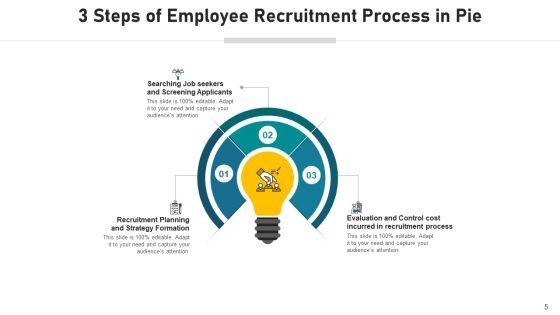
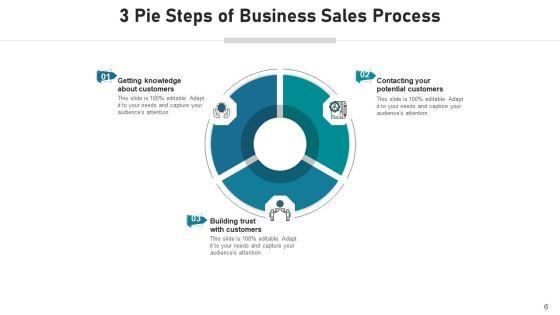
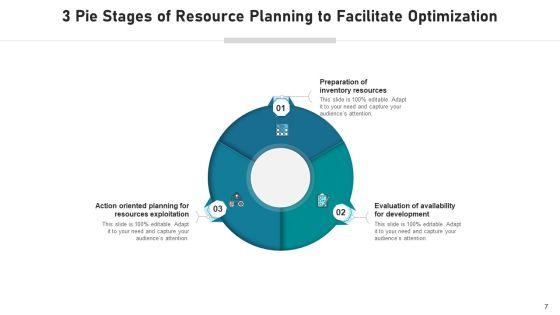
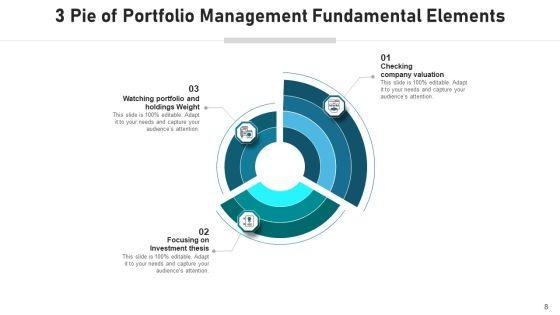
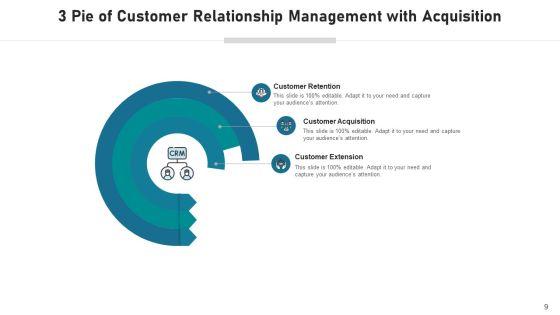
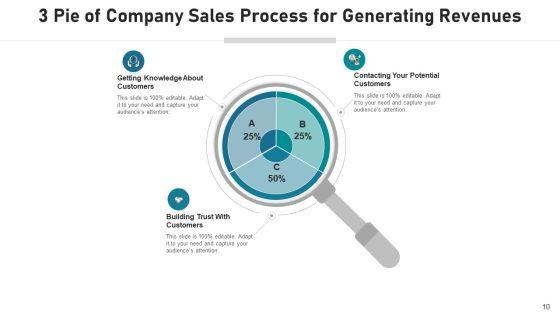
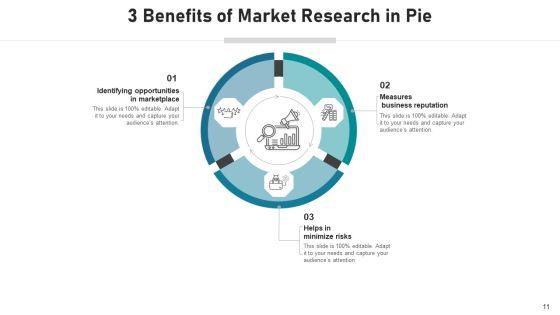
Improve your presentation delivery using this three piece pie chart measures business ppt powerpoint presentation complete deck with slides. Support your business vision and objectives using this well-structured PPT deck. This template offers a great starting point for delivering beautifully designed presentations on the topic of your choice. Comprising twelve this professionally designed template is all you need to host discussion and meetings with collaborators. Each slide is self-explanatory and equipped with high-quality graphics that can be adjusted to your needs. Therefore, you will face no difficulty in portraying your desired content using this PPT slideshow. This PowerPoint slideshow contains every important element that you need for a great pitch. It is not only editable but also available for immediate download and utilization. The color, font size, background, shapes everything can be modified to create your unique presentation layout. Therefore, download it now.


Slide 1 of 7
This is a business expenditure analysis pie charts ppt infographic template. This is a three stage process. The stages in this process are pie, business, marketing, finance, success.


Slide 1 of 6
Presenting this set of slides with name pie chart to survey business outcomes ppt powerpoint presentation file slide portrait. The topics discussed in these slides are business outcomes, business results, business output. This is a completely editable PowerPoint presentation and is available for immediate download. Download now and impress your audience.


Slide 1 of 6
Measuring Team Performance Business People On Pie Chart Ppt Powerpoint Presentation Gallery Smartart
This is a measuring team performance business people on pie chart ppt powerpoint presentation gallery smartart. This is a five stage process. The stages in this process are team performance, member performance, group performance.


Slide 1 of 6
This is a pie chart to survey business outcomes ppt powerpoint presentation infographic template gridlines. This is a seven stage process. The stages in this process are business outcomes, business results, business output.


Slide 1 of 6
This is a 3d pie chart business plan ppt powerpoint presentation model guidelines. This is a four stage process. The stages in this process are art, colouring, paint brush.


Slide 1 of 5
Presenting this set of slides with name business outcomes analysis business man with pie bar and line chart ppt powerpoint presentation professional graphics download. This is a three stage process. The stages in this process are business outcomes, business results, business output. This is a completely editable PowerPoint presentation and is available for immediate download. Download now and impress your audience.


Slide 1 of 5
This is a business outcomes analysis business man with pie bar and line chart ppt powerpoint presentation infographics visual aids. This is a three stage process. The stages in this process are business outcomes, business results, business output.


Slide 1 of 5
This is a pie chart companys business model canvas ppt powerpoint presentation ideas show. This is a three stage process. The stages in this process are pie chart, finance, marketing, analysis, business.


Slide 1 of 5
This is a business operational plan pie charts ppt powerpoint presentation templates. This is a three stage process. The stages in this process are finance, business, marketing, percentage.


Slide 1 of 5
This is a big data business benefits pie charts ppt powerpoint presentation backgrounds. This is a four stage process. The stages in this process are business, marketing, icons, strategy, management.


Slide 1 of 5
This is a pie chart for evaluating business success ppt powerpoint presentation inspiration. This is a three stage process. The stages in this process are business, strategy, marketing, analysis, pie chart.


Slide 1 of 4
This is a business model with pie charts for market share powerpoint slide themes. This is a three stage process. The stages in this process are management, marketing, pie chart, business, finance.


Slide 1 of 4
This is a business model pie chart powerpoint slide template. This is a three stage process. The stages in this process are business, finance, management, marketing, pie chart.


Slide 1 of 4
This PowerPoint template has been designed with graphics of four pie charts This diagram can be used to display financial planning and business analysis. Capture the attention of your audience with this slide.
Slide 1 of 4
This dashboard template contains graphics of pie chart with icons. This dashboard PowerPoint template helps to display business analysis in a visual manner. Download this template to make impressive presentations.


Slide 1 of 3
Our above PPT slide contains diagram of pentagon infographic. It helps to display steps of corporate marketing. Use this diagram to impart more clarity to data and to create more sound impact on viewers.


Slide 1 of 3
This business slide contains graphics of pie chart with team members. This PowerPoint template is suitable to present comparison of teams performances. Use this business diagram to present your work in a more smart and precise manner.
Slide 1 of 3
Our compelling template consists with a design of pie chart with seven business icons. This slide has been professionally designed to exhibit financial ratio analysis. This template offers an excellent background to build impressive presentation.
Slide 1 of 3
This PowerPoint template has been designed with four pie charts and icons. This diagram is suitable for sales and marketing presentations. This professional slide helps in making an instant impact on viewers.


Slide 1 of 3
Visually support your presentation with our above template showing pie chart. This slide has been professionally designed to present business statistics. This template offers an excellent background to build impressive presentation.


Slide 1 of 3
Visually support your presentation with our above template showing pie chart on magnifying glass. This slide has been professionally designed to emphasize the concept of market research and analysis. Deliver amazing presentations to mesmerize your audience.
Slide 1 of 3
Strategy and planning can be displayed with this business diagram. This slide contains the graphic of icons around pie chart Use this editable slide to build quality presentation for your viewers.


Slide 1 of 3
Our above slide display graphics of pie chart on a scale. Download this diagram slide to display competitive analysis of business. Adjust the above diagram in your business presentations to visually support your content.
Slide 1 of 3
Download this diagram to displays marketing strategy. This business diagram contains the graphic of icons on pie graph. Use this template to highlight the key issues of your presentation.


Slide 1 of 3
This template displays pie chart business infographic. You may download this business slide for result analysis. Amplify your thoughts via this appropriate business template.


Slide 1 of 3
Our professionally designed business diagram is as an effective tool for communicating business ideas and strategies for corporate planning. It contains graphics of pie chart with percentage ratio. Convey your views with this diagram slide. It will amplify the strength of your logic.
Slide 1 of 3
Our professionally designed business diagram is as an effective tool for communicating business ideas and strategies for corporate planning. It contains graphics of pie chart with icons. Convey your views with this diagram slide. It will amplify the strength of your logic.


Slide 1 of 3
Our professionally designed business diagram is as an effective tool for communicating business ideas and strategies for corporate planning. It contains graphics of pie chart on mobile. Convey your views with this diagram slide. It will amplify the strength of your logic.


Slide 1 of 3
This slide has been designed with pie chart in shape of lock. This diagram contains the concept of trading costs, finance and marketing. Use this slide for your business related presentations.
Slide 1 of 3
This professional business diagram slide has been designed with pie chart and icons. It contains concept of financial analysis. Use this slide to build exclusive presentations for your viewers.
Slide 1 of 3
This business slide contains graphics of pie chart with business icons. Download this impressive diagram to present marketing performance measurement. This image slide is best to present your newer thoughts.


Slide 1 of 3
Six staged pie chart is used to design this business slide. Download this diagram to make business and financial reports. Use our above diagram to express information in a visual way.


Slide 1 of 3
This power point template has been designed with graphic of three circular pie chart. This pie chart is suitable for financial data representation. Use this PPt for your business and finance related presentations.


Slide 1 of 3
Four staged pie chart and percentage values has been used to design this power point template. This PPT contains the concept of financial result analysis. Use this PPT for business and marketing related presentations.


Slide 1 of 3
This power point template slide has been crafted with graphic of pie chart and three persons. This PPT contains the concept of option representation for marketing targets. This PPT diagram is suitable for marketing presentations.


Slide 1 of 3
This power point template slide has been crafted with graphic of pie chart ,persons and seven options. This PPT contains the concept of option representation for business targets. This PPT diagram is can be used business and marketing presentations.


Slide 1 of 3
This power point template slide has been crafted with graphic of pie chart ,persons and four options. This PPT contains the concept of option representation for targets selection. This PPT diagram is can be used business and sales presentations.


Slide 1 of 3
This power point template slide has been crafted with graphic of pie chart, persons and five options. This PPT contains the concept of option representation for target achievement. Use this PPT diagram for business and marketing targets related topics in any presentations.


Slide 1 of 3
This power point template slide has been crafted with graphic of pie chart and magnifier. This PPT contains the concept of performance indication. Use this PPT for data technology and business related presentations.


Slide 1 of 3
This power point template diagram has been crafted with graphic of leader and team. This PPT contains the concept of target achievement. This PPT diagram is well crafted for business and sales target related topics in any presentation.


Slide 1 of 3
Three different pie charts are used to designed this power point template slide. This PPT slide contains the concept of result analysis. Use this PPT slide for your data and process related presentations.


Slide 1 of 3
Four staged pie chart and percentage values are used to design this business slide. Download this diagram to make business and financial reports. Use our above diagram to express information in a visual way.


Slide 1 of 3
This business diagram has been designed with graphic of business people and pie chart with percentage. This diagram is designed to depict team meeting on financial matter. This diagram offers a way for your audience to visually conceptualize the process.


Slide 1 of 3
This diagram is designed with four colorful pie charts. Download this diagram to analyze the key points. This diagram offers a way for your audience to visually conceptualize the process.


Slide 1 of 3
Five sequential pie charts are used to craft this power point template. This PPT contains the concept of process flow and result analysis. Use this PPT for your business and sales related presentations and build quality presentation for your viewers.


Slide 1 of 3
This slide displays graphic six staged pie charts. Download this diagram to present and compare business data. Use this diagram to display business process workflows in any presentation.


Slide 1 of 3
This diagram displays human face graphic divided into sections. This section can be used for data display. Use this diagram to build professional presentations for your viewers.


Slide 1 of 3
This business diagram displays graphic of pie charts in shape of flasks. This business slide is suitable to present and compare business data. Use this diagram to build professional presentations for your viewers.


Slide 1 of 3
This business diagram displays graphic of pie charts. This business slide is suitable to present and compare business data. Use this diagram to build professional presentations for your viewers.


Slide 1 of 3
This business slide displays 3d colorful pie graph with magnifier. This diagram is a data visualization tool that gives you a simple way to present statistical information. This slide helps your audience examine and interpret the data you present.


Slide 1 of 3
This PowerPoint template displays technology gadgets with various business charts. Use this diagram slide, in your presentations to make business reports for statistical analysis. You may use this diagram to impart professional appearance to your presentations.


Slide 1 of 3
This business slide displays alarm clock with pie chart. This diagram is a data visualization tool that gives you a simple way to present statistical information. This slide helps your audience examine and interpret the data you present.


Slide 1 of 3
This business slide displays pie chart with timeline graphics. This diagram has been designed with graphic of with four arrows representing yearly data. Use this diagram, in your presentations to display process steps, stages, for business management.


Slide 1 of 3
This Power Point diagram has been crafted with pie chart in shape of lock. It contains diagram of lock pie chart to compare and present data in an effective manner. Use this diagram to build professional presentations for your viewers.


Slide 1 of 3
This business diagram displays graphic of five staged process flow diagram. This PPT slide contains the concept of business data representation. Use this diagram to build professional presentation for your viewers.


Slide 1 of 3
This business slide displays pie chart. This diagram is a data visualization tool that gives you a simple way to present statistical information. This slide helps your audience examine and interpret the data you present.


Slide 1 of 3
Display the concept of result analysis in your business presentation. This PPT slide contains the graphic of six pie charts. Use this PPT slide for your business and marketing data related presentations.


Slide 1 of 3
This business plan power point template has been designed with pie chart in octagon shape. This PPT contains the concept of result analysis for any business process. Use this PPT for business and sales related presentations.


Slide 1 of 3
This Power Point template has been designed with graphic of target dart. This PPT diagram contains the concept of information communication. Use this PPT in your business communication related presentations.
SHOW
- 60
- 120
- 180
DISPLAYING: 60 of 607 Item(s)
Page
