 AI PPT Maker
 Templates
 PPT Bundles
 Design Services
 Business PPTs
 Business Plan
 Management
 Strategy
 Introduction PPT
 Roadmap
 Self Introduction
 Timelines
 Process
 Marketing
 Agenda
 Technology
 Medical
 Startup Business Plan
 Cyber Security
 Dashboards
 SWOT
SWOT Proposals
 Education
 Pitch Deck
 Digital Marketing
 KPIs
KPIs Project Management
 Product Management
 Artificial Intelligence
 Target Market
 Communication
 Supply Chain
 Google Slides
 Research Services
 One Pagers
 All Categories
Business metrics PowerPoint Presentation Templates and Google Slides
SHOW
- 60
- 120
- 180
DISPLAYING: 60 of 352 Item(s)
Page


Induce strategic thinking by presenting this complete deck. Enthrall your audience by deploying this thought provoking PPT deck. It can be downloaded in both standard and widescreen aspect ratios, thus making it a complete package to use and deploy. Convey your thoughts and actions using the fourty three slides presented in this complete deck. Additionally, feel free to alter its components like color, graphics, design, etc, to create a great first impression. Grab it now by clicking on the download button below.


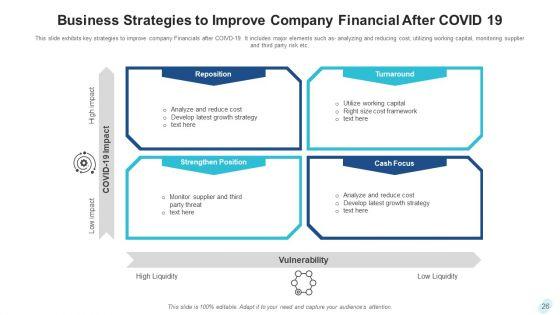
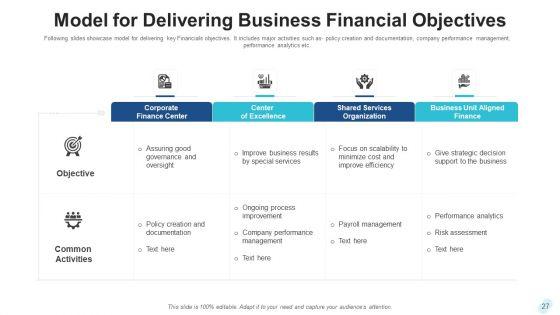
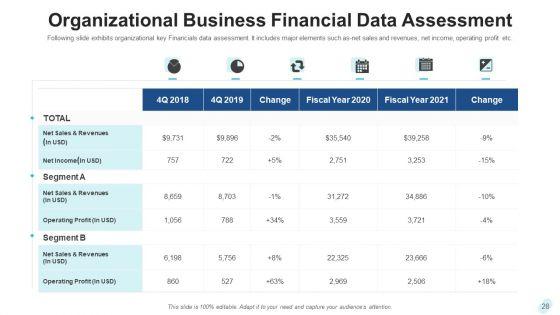

Improve your presentation delivery using this business financial metrics data analysis ppt powerpoint presentation complete deck with slides. Support your business vision and objectives using this well-structured PPT deck. This template offers a great starting point for delivering beautifully designed presentations on the topic of your choice. Comprising twenty nine this professionally designed template is all you need to host discussion and meetings with collaborators. Each slide is self-explanatory and equipped with high-quality graphics that can be adjusted to your needs. Therefore, you will face no difficulty in portraying your desired content using this PPT slideshow. This PowerPoint slideshow contains every important element that you need for a great pitch. It is not only editable but also available for immediate download and utilization. The color, font size, background, shapes everything can be modified to create your unique presentation layout. Therefore, download it now.


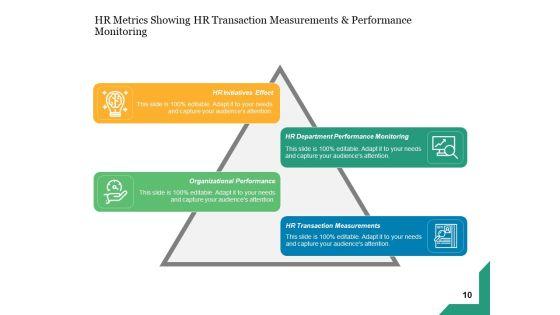


Boost your confidence and team morale with this well-structured human resource metrics business gear ppt powerpoint presentation complete deck. This prefabricated set gives a voice to your presentation because of its well-researched content and graphics. Our experts have added all the components very carefully, thus helping you deliver great presentations with a single click. Not only that, it contains a set of sixteen slides that are designed using the right visuals, graphics, etc. Various topics can be discussed, and effective brainstorming sessions can be conducted using the wide variety of slides added in this complete deck. Apart from this, our PPT design contains clear instructions to help you restructure your presentations and create multiple variations. The color, format, design anything can be modified as deemed fit by the user. Not only this, it is available for immediate download. So, grab it now.


If designing a presentation takes a lot of your time and resources and you are looking for a better alternative, then this Business Metrics Pyramid Ppt PowerPoint Presentation Complete Deck With Slides is the right fit for you. This is a prefabricated set that can help you deliver a great presentation on the topic. All the twelve slides included in this sample template can be used to present a birds-eye view of the topic. These slides are also fully editable, giving you enough freedom to add specific details to make this layout more suited to your business setting. Apart from the content, all other elements like color, design, theme are also replaceable and editable. This helps in designing a variety of presentations with a single layout. Not only this, you can use this PPT design in formats like PDF, PNG, and JPG once downloaded. Therefore, without any further ado, download and utilize this sample presentation as per your liking.


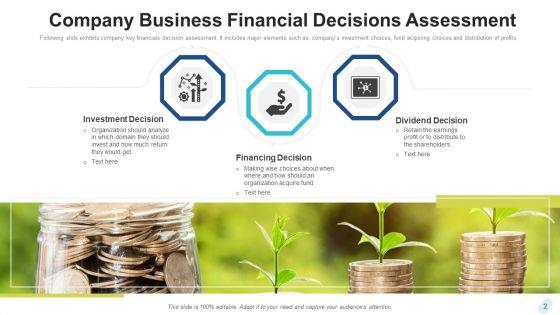
This is a business development metrics and scorecard ppt powerpoint slides. This is a four stage process. The stages in this process are business development strategy formulation, assessment of business development strategy, continuous improvement and review strategy, business development, change plan and improvement in strategy.


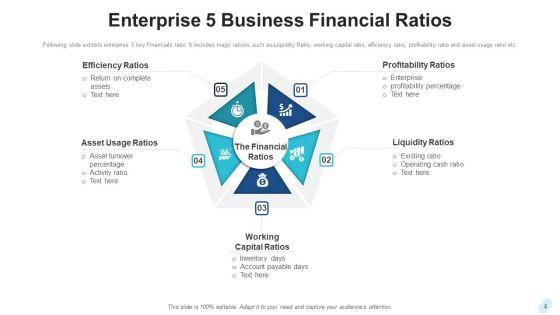
Presenting this set of slides with name bizbok business architecture metrics and measures ppt powerpoint presentation file design templates. This is a three stage process. The stages in this process are business strategy, business architecture, actionable plans, management, marketing. This is a completely editable PowerPoint presentation and is available for immediate download. Download now and impress your audience.


Presenting this set of slides with name metrics business effectiveness ppt powerpoint presentation slides example topics cpb. This is a five stage process. The stages in this process are metrics business effectiveness. This is a completely editable PowerPoint presentation and is available for immediate download. Download now and impress your audience.
Presenting this set of slides with name business metrics examples ppt powerpoint presentation icon clipart images cpb. This is a three stage process. The stages in this process are marketing, business, management, planning, strategy. This is a completely editable PowerPoint presentation and is available for immediate download. Download now and impress your audience.
Presenting this set of slides with name business metrics example ppt powerpoint presentation icon infographic template cpb. This is a three stage process. The stages in this process are marketing, business, management, planning, strategy. This is a completely editable PowerPoint presentation and is available for immediate download. Download now and impress your audience.


This slide covers details regarding key metrics associated to online business in terms of marketing spend, leads achievement, social outreach, website visitors, leads by channel, campaign metrics. Presenting you an exemplary Determine Key Performance Metrics Associated To Digital Business One Pager Documents. Our one-pager comprises all the must-have essentials of an inclusive document. You can edit it with ease, as its layout is completely editable. With such freedom, you can tweak its design and other elements to your requirements. Download this Determine Key Performance Metrics Associated To Digital Business One Pager Documents brilliant piece now.


Presenting you a fantastic Determine Key Performance Metrics Associated To E Commerce Business One Pager Documents. This piece is crafted on hours of research and professional design efforts to ensure you have the best resource. It is completely editable and its design allow you to rehash its elements to suit your needs. Get this Determine Key Performance Metrics Associated To E Commerce Business One Pager Documents A4 One-pager now.


Following slide illustrates customer service dashboard covering details such as request answered, total requests, total revenue and support cost revenue. It also includes customer satisfaction score, customer retention in a 12 months format. Deliver and pitch your topic in the best possible manner with this Metrics To Measure Business Performance Customer Service Dashboard Sample PDF. Use them to share invaluable insights on Requests Answered 2022, Total Requests 2022, Total Revenue 2022 and impress your audience. This template can be altered and modified as per your expectations. So, grab it now.


Mentioned slide covers customer satisfaction dashboard with a 12-month format. It includes customer satisfaction details by region and by district. Deliver an awe inspiring pitch with this creative Metrics To Measure Business Performance Customer Satisfaction Dashboard Summary PDF bundle. Topics like Best Demonstrated, Worst Demonstrated, 2020 can be discussed with this completely editable template. It is available for immediate download depending on the needs and requirements of the user.


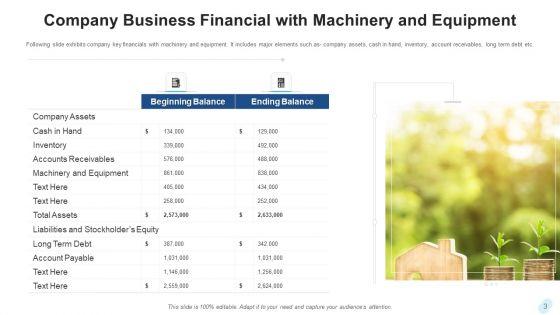
Following slide covers cash flow dashboard covering details like beginning cash on hand, cash going in, cash going out, profit or loss and ending cash on hand. It also includes detail of accounts receivable and payable. Deliver an awe inspiring pitch with this creative Metrics To Measure Business Performance Cash Flow Dashboard Rules PDF bundle. Topics like Beginning Cash Hand, Cash Going Out, Accounts Payable, Accounts Receivable can be discussed with this completely editable template. It is available for immediate download depending on the needs and requirements of the user.


This diagram has been designed with framework of key metrics required for different company situations. This diagram contains rectangle of operating value drivers with four sections inside it representing terms like growth of net Income, multiyear DCF of economic profit, net income, return on sales, ROIC-WACC, and economic profit. Use this as a major element in streamlining any business process.


Analyze Ailments On Our Business Cycle Diagram Dashboard Design Business Metrics Marketing Diagram Powerpoint Templates. Bring Out The Thinking Doctor In You. Dock Your Thoughts With Our Business Cycle Diagram Dashboard Design Business Metrics Marketing Diagram Powerpoint Templates. They Will Launch Them Into Orbit.


This slide showcases BI dashboard to ensure smooth working of shipping and logistics operations. It includes KPIs such as vehicle cost trend, price per unit, fuel consumption, distance, accident, etc. Showcasing this set of slides titled Business Intelligence Dashboard Showcasing Fleet Management Metrics Elements PDF. The topics addressed in these templates are Cost Trend, Price Per Unit Trend, Vehicle Cost Trend. All the content presented in this PPT design is completely editable. Download it and make adjustments in color, background, font etc. as per your unique business setting.


Mentioned slide outlines the performance of an effective internal communication strategy based on certain metrics. The various KPIs include employee participation, satisfaction and HR activities Coming up with a presentation necessitates that the majority of the effort goes into the content and the message you intend to convey. The visuals of a PowerPoint presentation can only be effective if it supplements and supports the story that is being told. Keeping this in mind our experts created Developing A Successful Business Communication Plan Internal Communication Metrics Inspiration PDF to reduce the time that goes into designing the presentation. This way, you can concentrate on the message while our designers take care of providing you with the right template for the situation.


This slide covers the B2B marketing transformation success metrics such as influenced pipelines, overall numbers of engaged accounts, marketing qualified accounts, individual campaign and channel metrics etc. If you are looking for a format to display your unique thoughts, then the professionally designed Digital Marketing Toolkit Business To Business Marketing Transformation Success Metrics Sample PDF is the one for you. You can use it as a Google Slides template or a PowerPoint template. Incorporate impressive visuals, symbols, images, and other charts. Modify or reorganize the text boxes as you desire. Experiment with shade schemes and font pairings. Alter, share or cooperate with other people on your work. Download Digital Marketing Toolkit Business To Business Marketing Transformation Success Metrics Sample PDF and find out how to give a successful presentation. Present a perfect display to your team and make your presentation unforgettable.

This slide represents the KPI dashboard to track and monitor management of talent by the HR department. It includes details related to talent satisfaction, talent turnover rate, fired talents etc. This modern and well-arranged Tools For HR Business Analytics HR Talent Management Key Metrics Structure PDF provides lots of creative possibilities. It is very simple to customize and edit with the Powerpoint Software. Just drag and drop your pictures into the shapes. All facets of this template can be edited with Powerpoint, no extra software is necessary. Add your own material, put your images in the places assigned for them, adjust the colors, and then you can show your slides to the world, with an animated slide included.


This slide represents key metrics dashboard to analyze the engagement of employees in the organization. It includes details related to KPIs such as engagement score, response rate, net promoter score etc. Make sure to capture your audiences attention in your business displays with our gratis customizable Tools For HR Business Analytics Employee Engagement Key Performance Metrics Brochure PDF. These are great for business strategies, office conferences, capital raising or task suggestions. If you desire to acquire more customers for your tech business and ensure they stay satisfied, create your own sales presentation with these plain slides.
This slide covers the dashboard for analyzing blogging KPIs such as performance, published posts, views, new blog subscribers, top blog posts by pageviews, top blog posts by CTR, etc. Retrieve professionally designed Marketing Success Metrics Dashboard For Tracking Business Blog Kpis Brochure PDF to effectively convey your message and captivate your listeners. Save time by selecting pre-made slideshows that are appropriate for various topics, from business to educational purposes. These themes come in many different styles, from creative to corporate, and all of them are easily adjustable and can be edited quickly. Access them as PowerPoint templates or as Google Slides themes. You dont have to go on a hunt for the perfect presentation because Slidegeeks got you covered from everywhere.


Presenting you a fantastic The Retail Industry Business Yearly Sheet Performance Metrics17 One Pager Documents. This piece is crafted on hours of research and professional design efforts to ensure you have the best resource. It is completely editable and its design allow you to rehash its elements to suit your needs. Get this The Retail Industry Business Yearly Sheet Performance Metrics17 One Pager Documents A4 One-pager now.


Pitch your topic with ease and precision using this Metrics Depicting Business Operations Metrics Diagrams PDF. This layout presents information on Metrics Depicting, Business, Operations Metrics. It is also available for immediate download and adjustment. So, changes can be made in the color, design, graphics or any other component to create a unique layout.


This slide covers score for data obtained from core business activities and process. It includes quality metrics such as accuracy, completeness, consistency, integrity, timeliness, uniqueness and validity for data from business partners, finance, material management, sales, etc. Showcasing this set of slides titled Data Quality Kpis Metrics Scorecard For Core Business Processes Topics PDF. The topics addressed in these templates are Data Quality, Errors, Reports. All the content presented in this PPT design is completely editable. Download it and make adjustments in color, background, font etc. as per your unique business setting.


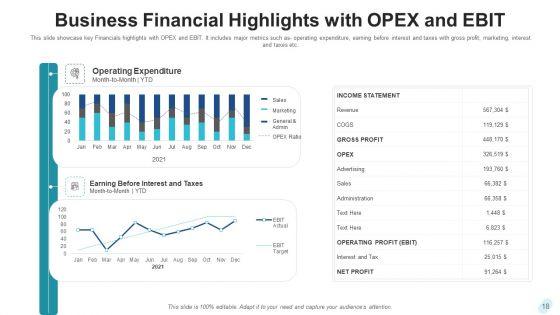
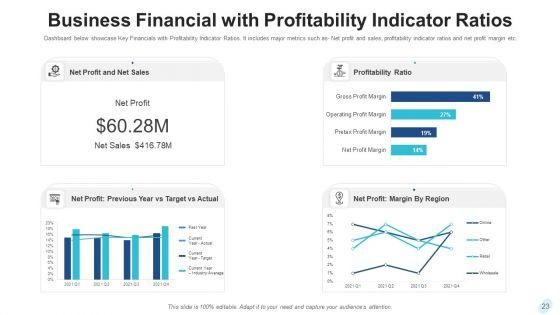
The following slide outlines key performance indicator KPI dashboard showcasing various financial metrics of the organization. The key metrics are gross revenue, product revenue, service revenue, gross profit, net profit etc. Formulating a presentation can take up a lot of effort and time, so the content and message should always be the primary focus. The visuals of the PowerPoint can enhance the presenters message, so our Estimating Business Overall Kpi Metrics Dashboard Highlighting Organization Revenue Clipart PDF was created to help save time. Instead of worrying about the design, the presenter can concentrate on the message while our designers work on creating the ideal templates for whatever situation is needed. Slidegeeks has experts for everything from amazing designs to valuable content, we have put everything into Estimating Business Overall Kpi Metrics Dashboard Highlighting Organization Revenue Clipart PDF.
SHOW
- 60
- 120
- 180
DISPLAYING: 60 of 352 Item(s)
Page