AI PPT Maker
Templates
PPT Bundles
Design Services
Business PPTs
Business Plan
Management
Strategy
Introduction PPT
Roadmap
Self Introduction
Timelines
Process
Marketing
Agenda
Technology
Medical
Startup Business Plan
Cyber Security
Dashboards
SWOT
Proposals
Education
Pitch Deck
Digital Marketing
KPIs
Project Management
Product Management
Artificial Intelligence
Target Market
Communication
Supply Chain
Google Slides
Research Services
 One Pagers
All Categories
Business graph PowerPoint Presentation Templates and Google Slides
SHOW
- 60
- 120
- 180
DISPLAYING: 60 of 3993 Item(s)
Page


Slide 1 of 12
Improve your presentation delivery using this high low medium graph business activities ppt powerpoint presentation complete deck with slides. Support your business vision and objectives using this well-structured PPT deck. This template offers a great starting point for delivering beautifully designed presentations on the topic of your choice. Comprising twelve this professionally designed template is all you need to host discussion and meetings with collaborators. Each slide is self-explanatory and equipped with high-quality graphics that can be adjusted to your needs. Therefore, you will face no difficulty in portraying your desired content using this PPT slideshow. This PowerPoint slideshow contains every important element that you need for a great pitch. It is not only editable but also available for immediate download and utilization. The color, font size, background, shapes everything can be modified to create your unique presentation layout. Therefore, download it now.


Slide 1 of 12
Presenting this set of slides with name circular graph symbol business ideation employee analysis financial analysis ppt powerpoint presentation complete deck. The topics discussed in these slides are business ideation, employee analysis, financial analysis, data distribution, growth analysis. This is a completely editable PowerPoint presentation and is available for immediate download. Download now and impress your audience.


Slide 1 of 7
This is a strategic planning exercises for business groups powerpoint graphics. This is a five stage process. The stages in this process are visioning exercises, values voting, stakeholder analysis, swot analysis, group strategy and goal.


Slide 1 of 7
This is a an awesome pitch for new business powerpoint graphics. This is a ten stage process. The stages in this process are the problem, proprietary tech, elevator pitch, competition, marketing plan, business model, money, market size, the solution, team.


Slide 1 of 7
This is a budgeting strategy for business powerpoint slides graphics. This is a six stage process. The stages in this process are dynamic accounting systems, cost base, timing, contingencies, production schedule, budget profiling.


Slide 1 of 7
This is a business training example diagram ppt background graphics. This is a one stage process. The stages in this process are teamwork, management, planning, strategy, business.


Slide 1 of 7
This is a business problem solving approach ppt background graphics. This is a four stage process. The stages in this process are business goal, dependent variables, independent variables, business drivers and relationship.


Slide 1 of 7
This is a business case development framework presentation graphics. This is a nine stage process. The stages in this process are action plans and recommendations, benefits, objectives, issues, problem statement, facts, gap analysis, potential performance, actual performance.


Slide 1 of 7
This is a business service resource planning powerpoint graphics. This is a four stage process. The stages in this process are crm, demand and capacity planning, engagement management, service delivery management, erp and corporate dashboards, new business, repeat business, strategic business, scope change, pipeline monitoring, what if scenarios, utilization planning, future capacity planning, statements of work details, activity and milestone scheduling, resource assignment, financial planning, changes, issues, and risks management, progress tracking and re planning, status reporting, financial re forecasting, client deliverables, billing data, client satisfaction, financial management, forecast revenue and margins by services line region customer and project, track revenue by billable resources, monitor project expenditure, monitor work in progress, plan billable milestones.


Slide 1 of 7
This is a business communications management plan template powerpoint graphics. This is a four stage process. The stages in this process are Project Name, Project Manager, Sponsoring Organization, Plan Data, Stakeholder Name, Organization, Responsibility, Contact Information, Internal Stakeholder.


Slide 1 of 7
This is a business information gathering powerpoint graphics. This is a one stage process. The stages in this process are laptop, business, technology, presentation, information.


Slide 1 of 7
This is a initial business baseline assessment template ppt background graphics. This is a seven stage process. The stages in this process are sense intent, know context, qualitative assessment, know people, frame insights, manage progress, realize offerings.


Slide 1 of 7
This is a promoting global business template powerpoint slide graphics. This is a ten stage process. The stages in this process are budgeting, publicity, message creation, media selection, campaign evaluation, advertising, trade fairs, personal selling, public relations, direct marketing.


Slide 1 of 7
This is a skills for business management diagram powerpoint graphics. This is a six stage process. The stages in this process are managing relationship, testing and tracking, managing self, sale marketing skills, managing team, managing communication, people management skill.


Slide 1 of 7
This is a business mechanics ppt template presentation graphics. This is a five stage process. The stages in this process are call management, issue management, knowledge management, service management, workflow automation.


Slide 1 of 7
This is a business information system example powerpoint graphics. This is a seven stage process. The stages in this process are information system, telecommunications, document management, integrated information flows, hardware, crm contact relation management, process management.


Slide 1 of 7
This is a big data business cases and applications ppt powerpoint graphics. This is a five stage process. The stages in this process are services, consulting and strategy, applications, infrastructure, data.


Slide 1 of 7
This is a business achievements analysis diagram powerpoint graphics. This is a seven stage process. The stages in this process are strategize, measurement, innovate, evaluation, optimization, propagate, success.


Slide 1 of 7
This is a e business strategy template powerpoint slide graphics. This is a four stage process. The stages in this process are strategy, tools, promote, optimize.


Slide 1 of 7
This is a business order management system diagram presentation graphics. This is a seven stage process. The stages in this process are fulfillment monitoring, order processing, sales return, order acceptance, purchase order, financial control, order orchestration.


Slide 1 of 7
This is a business motion management template powerpoint slide graphics. This is a six stage process. The stages in this process are vender coordination, space and furniture, technology, move planning, people, project closeout.


Slide 1 of 7
This is a business interrelationship graphic design powerpoint presentation examples. This is a six stage process. The stages in this process are data integration, performance management, sales, accounting, assemble product, decision support systems.


Slide 1 of 7
This is a business to business erp integration diagram powerpoint graphics. This is a five stage process. The stages in this process are customer relationship management, manufacturing resources planning, finance resources management, supply chain management, human resources management.


Slide 1 of 7
This is a example of enterprise business capabilities ppt presentation graphics. This is a three stage process. The stages in this process are be familiar with, value streams, information.


Slide 1 of 7
This is a graphic design for business ppt layout powerpoint slide information. This is a four stage process. The stages in this process are banner, paperwork, web, saving.


Slide 1 of 7
This is a valuing a business example powerpoint slide graphics. This is a four stage process. The stages in this process are risk factors, competition, valuation, public comparable.


Slide 1 of 7
This is a business progress in 2017 example powerpoint graphics. This is a four stage process. The stages in this process are plan, success, concept, milestone.


Slide 1 of 7
This is a business strategy of digital brands cape ppt powerpoint graphics. This is a six stage process. The stages in this process are linked in, tools, facebook, vision, twitter, brand promise.


Slide 1 of 7
This is a effective management system for business powerpoint slide graphics. This is a five stage process. The stages in this process are culture, assurance, leadership, competence, capability.


Slide 1 of 7
This is a business development process flow diagram powerpoint graphics. This is a three stage process. The stages in this process are Invest, Implement, Validate.


Slide 1 of 7
This is a business core values diagram powerpoint graphics. This is a six stage process. The stages in this process are integrity, customer focus, mutual respect, teamwork, innovation, quality conscious.


Slide 1 of 7
This is a graphic design for business ppt layout powerpoint templates. This is a seven stage process. The stages in this process are comments, website, savings, sell, paperwork, graphics, seo.


Slide 1 of 7
This is a external and internal business metrics for price optimization ppt powerpoint graphics. This is a two stage process. The stages in this process are tour business metrics, detailed market prices, business rules for pricing, prices adjusted automatically at any scale.


Slide 1 of 7
This is a business culture and value illustration powerpoint graphics. This is a five stage process. The stages in this process are culture, performance, change, innovation, execution, growth.




Slide 1 of 7
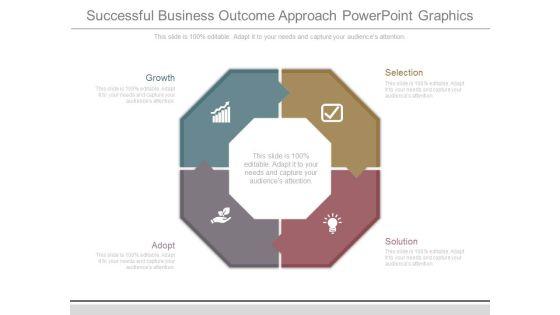
This is a successful business outcome approach powerpoint graphics. This is a four stage process. The stages in this process are selection, solution, adopt, growth.


Slide 1 of 7
This is a long term business strategy graph powerpoint slide presentation tips. This is a three stage process. The stages in this process are today, tomorrow, future.



Slide 1 of 7
This is a creating a successful business plan powerpoint graphics. This is a four stage process. The stages in this process are business plan, success, analysis, problem, solution.


Slide 1 of 7
This is a buy a business plan example ppt presentation graphics. This is a seven stage process. The stages in this process are brand perception, pricing sensitivity, customer segmentation, usage and analysis, sourcing preferences, customer satisfaction, loyalty analysis.


Slide 1 of 7
This is a business plan pricing diagram presentation graphics. This is a four stage process. The stages in this process are design, evaluate, implement, assess.


Slide 1 of 7
This is a evaluate a business idea for start up ppt powerpoint slide graphics. This is a seven stage process. The stages in this process are research, plan, fund, develop, evaluate, market, test.


Slide 1 of 7
This is a range of customer business processes ppt powerpoint graphics. This is a three stage process. The stages in this process are facilitate, improve, transform, core business systems, new model applications and delivery, platform based outsourcing.


Slide 1 of 7
This is a business financial growth ppt powerpoint graphics. This is a five stage process. The stages in this process are financial growth, investment, reporting, growth, security and analysis.


Slide 1 of 7
This is a levels of business analysis strategy ppt presentation graphics. This is a three stage process. The stages in this process are corporate strategy, business unit strategy, operational strategy.



Slide 1 of 7
This is a business reengineering definition and principles slide graphics. This is a six stage process. The stages in this process are business reengineering definition and principles, business reengineering examples, business reengineering framework, business reengineering project life cycle, business reengineering teams and infrastructures, total quality management business reengineering.


Slide 1 of 7
This is a product information management business template presentation graphics. This is a two stage process. The stages in this process are enterprise pim, supply, sell, crm systems, supply chain management, retail, ecommerce, mobile, emarketing, direct print, market place, data warehouse, warehouse management, erp systems, agencies, photographers, market place, data pools, consultant copywriters, vendor feeds.


Slide 1 of 7
This is a business management experience diagram powerpoint graphics. This is a three stage process. The stages in this process are strategy, leadership skills, innovative business models.


Slide 1 of 7
This is a business management information pathway diagram presentation graphics. This is a five stage process. The stages in this process are high school diploma or ged, less than 1 year, 1 3 years, bachelor s degree 4 years, advanced degree4 years.


Slide 1 of 7
This is a business solutions for growth graphics ppt example. This is a four stage process. The stages in this process are product, market, delivery, growth, product standardization, fast response to new market requirements, going in to the cloud, rapid global expansion, off the shelf business solution for faster go to market and simplified implementation, mobile payment, tokenization, omni channel, paperless banking, instant payments, software as a service saas delivery, growth in exiting and new market.


Slide 1 of 7
This is a business management consultant diagram powerpoint graphics. This is a three stage process. The stages in this process are marketing, finance, advisory, you.


Slide 1 of 7
This is a business analysis services sample diagram presentation graphics. This is a three stage process. The stages in this process are hierarchy in business service, analysis service, management and planning service, management and planning service, elicitation service, analysis and documentation service, communication service, assessment and validation service, telecommunications, entertainment and media, internet web services.


Slide 1 of 7
This is a social enterprise business ideas ppt powerpoint graphics. This is a four stage process. The stages in this process are social brand external, social business, initiatives, social enterprise internal, infrastructure.


Slide 1 of 7
This is a business management entrepreneurship diagram powerpoint slide graphics. This is a nine stage process. The stages in this process are finding the required resources, using networks extensively, motivation to make a difference, spotting and exploiting opportunities, overcoming obstacles, controlling the business, financial, social, aesthetic capital, managing risk, showing determination in the face of adversity.\n\n\n\n


Slide 1 of 7
This is a business web marketing diagram presentation graphics. This is a ten stage process. The stages in this process are web design, searching, marketing, blogging, interface, newsfeed, security, forum, online shop, advertising.


Slide 1 of 7
This is a business event planning template powerpoint graphics. This is a five stage process. The stages in this process are evaluation, implementation, concept planning, research, strategic planning.


Slide 1 of 7
This is a business plan with bar graph powerpoint guide. This is a four stage process. The stages in this process are sales, years, net profit, gross profit.


Slide 1 of 7
This is a small business crm solutions diagram powerpoint graphics. This is a eight stage process. The stages in this process are business reports, analytics, workflow automation, sales force automation, marketing, lead management, hr management, customer care, crm system.


Slide 1 of 7
This is a business intelligence roadmap dashboard ppt powerpoint graphic. This is a five stage process. The stages in this process are strategy roadmap, stakeholder management, architectural blueprint, capability improvement, implementation planning.


Slide 1 of 7
This is a international business strategy powerpoint graphics. This is a four stage process. The stages in this process are global strategy, transnational strategy, multidomestic strategy, international strategy.


Slide 1 of 6
Presenting this set of slides with name timeline showing five stages of business growth ppt powerpoint presentation portfolio graphic tips. This is a five stage process. The stages in this process are business evolution, business development, business growth. This is a completely editable PowerPoint presentation and is available for immediate download. Download now and impress your audience.
Slide 1 of 6
Presenting this set of slides with name bar graph for four years business result analysis ppt powerpoint presentation icon show. The topics discussed in these slides are financial targets, financial goals, growth profitability. This is a completely editable PowerPoint presentation and is available for immediate download. Download now and impress your audience.
SHOW
- 60
- 120
- 180
DISPLAYING: 60 of 3993 Item(s)
Page
