AI PPT Maker
Templates
PPT Bundles
Design Services
Business PPTs
Business Plan
Management
Strategy
Introduction PPT
Roadmap
Self Introduction
Timelines
Process
Marketing
Agenda
Technology
Medical
Startup Business Plan
Cyber Security
Dashboards
SWOT
Proposals
Education
Pitch Deck
Digital Marketing
KPIs
Project Management
Product Management
Artificial Intelligence
Target Market
Communication
Supply Chain
Google Slides
Research Services
One Pagers
All Categories
Business Data Analysis PowerPoint Presentation Templates and Google Slides
SHOW
- 60
- 120
- 180
DISPLAYING: 60 of 262 Item(s)
Page


Slide 1 of 29
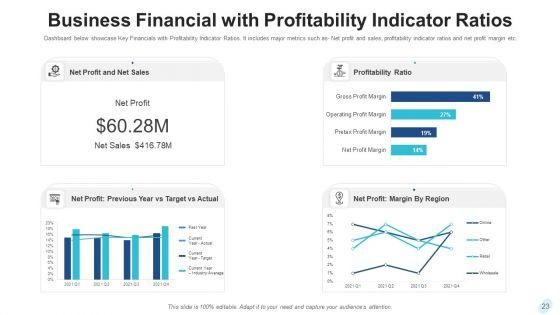
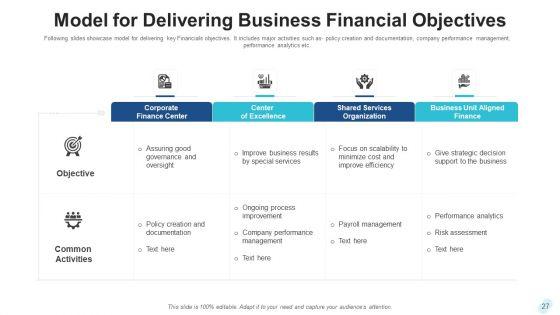
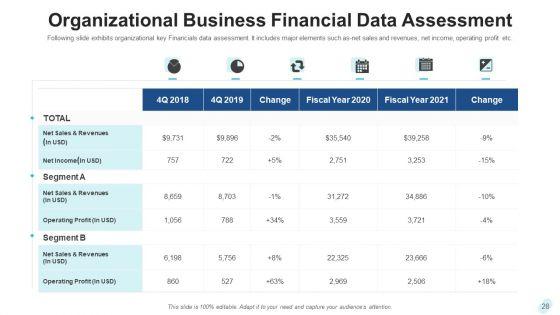
Improve your presentation delivery using this business financial metrics data analysis ppt powerpoint presentation complete deck with slides. Support your business vision and objectives using this well-structured PPT deck. This template offers a great starting point for delivering beautifully designed presentations on the topic of your choice. Comprising twenty nine this professionally designed template is all you need to host discussion and meetings with collaborators. Each slide is self-explanatory and equipped with high-quality graphics that can be adjusted to your needs. Therefore, you will face no difficulty in portraying your desired content using this PPT slideshow. This PowerPoint slideshow contains every important element that you need for a great pitch. It is not only editable but also available for immediate download and utilization. The color, font size, background, shapes everything can be modified to create your unique presentation layout. Therefore, download it now.


Slide 1 of 29
Pitch yourself both in house and outside by utilizing this complete deck. This business data analysis ppt powerpoint presentation complete deck with slides focuses on key fundamentals of the topic, displayed using different slides. With a total of tewnty nine slides, this template is the best tool you can use to persuade your audience. It will not only help you create great presentations but also induce strategic thinking because of its well researched content and graphics. You can easily personalize any of the elements to suit your unique business setting. Additionally, it can be saved in PNG, JPG, and PDF formats to save your time and resources.


Slide 1 of 12
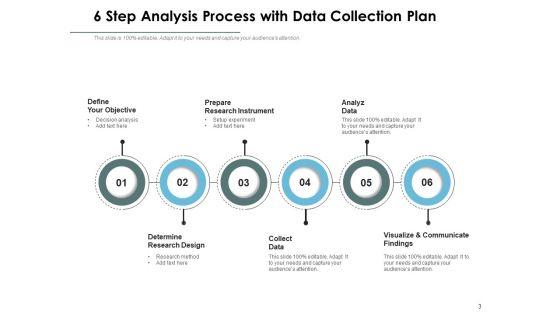
Share a great deal of information on the topic by deploying this data analysis plan business circles ppt powerpoint presentation complete deck. Support your ideas and thought process with this prefabricated set. It includes a set of twelve slides, all fully modifiable and editable. Each slide can be restructured and induced with the information and content of your choice. You can add or remove large content boxes as well, to make this PPT slideshow more personalized. Its high-quality graphics and visuals help in presenting a well-coordinated pitch. This PPT template is also a resourceful tool to take visual cues from and implement the best ideas to help your business grow and expand. The main attraction of this well-formulated deck is that everything is editable, giving you the freedom to adjust it to your liking and choice. Changes can be made in the background and theme as well to deliver an outstanding pitch. Therefore, click on the download button now to gain full access to this multifunctional set.


Slide 1 of 12
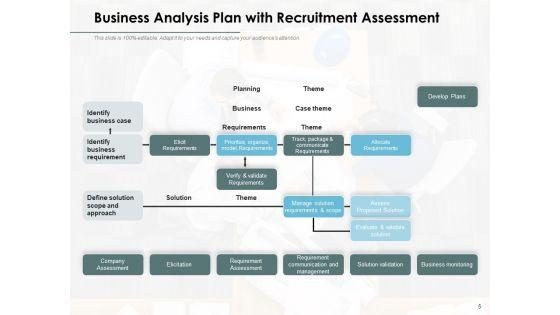
Boost your confidence and team morale with this well-structured structure of a data analysis report framework business ppt powerpoint presentation complete deck. This prefabricated set gives a voice to your presentation because of its well-researched content and graphics. Our experts have added all the components very carefully, thus helping you deliver great presentations with a single click. Not only that, it contains a set of twelve slides that are designed using the right visuals, graphics, etc. Various topics can be discussed, and effective brainstorming sessions can be conducted using the wide variety of slides added in this complete deck. Apart from this, our PPT design contains clear instructions to help you restructure your presentations and create multiple variations. The color, format, design anything can be modified as deemed fit by the user. Not only this, it is available for immediate download. So, grab it now.


Slide 1 of 12
Presenting this set of slides with name data analysis tools process business ppt powerpoint presentation complete deck. The topics discussed in these slides are process, business, strategic, analyst, checklist. This is a completely editable PowerPoint presentation and is available for immediate download. Download now and impress your audience.


Slide 1 of 12
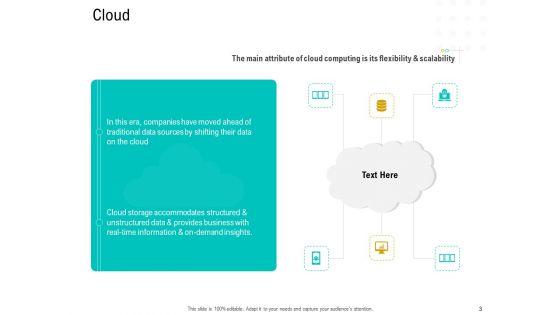
Presenting this set of slides with name data centre trend analysis business ppt powerpoint presentation complete deck. The topics discussed in these slides are trend analysis, business, cloud storage, various sources, data integration. This is a completely editable PowerPoint presentation and is available for immediate download. Download now and impress your audience.


Slide 1 of 12
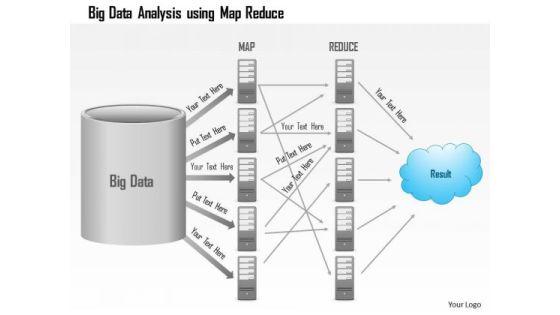
Presenting this set of slides with name big data analysis icon data analytic business ppt powerpoint presentation complete deck. The topics discussed in these slides are data analytic, business, growth, gear, magnifying glass. This is a completely editable PowerPoint presentation and is available for immediate download. Download now and impress your audience.


Slide 1 of 6
This is a business data analysis inventory and accounts payable days ppt powerpoint presentation layouts professional. This is a three stage process. The stages in this process are business analytics, ba, organizations data.


Slide 1 of 6
This is a business analysis data charts and reports ppt powerpoint presentation ideas portrait. This is a three stage process. The stages in this process are business metrics, business kpi, business dashboard.


Slide 1 of 5
This is a business analysis data monitoring vector icon ppt powerpoint presentation ideas design ideas. This is a one stage process. The stages in this process are feedback loop icon, evaluation icon, assessment icon.


Slide 1 of 3
This PowerPoint template graphics of meter chart. Download this PPT chart to simplify business data analysis. This PowerPoint slide is of great help in the business sector to make realistic presentations and provides effective way of presenting your newer thoughts.


Slide 1 of 3
This PowerPoint slide has a theme for financial data analysis. This image has been designed to display concept of financial planning and analysis. Deliver amazing presentations to mesmerize your audience using this image


Slide 1 of 3
This business diagram displays three flasks. You may use this slide for data analysis. Make your mark with this unique slide. Create an impression that will endure.


Slide 1 of 3
This business diagram has been designed with graphics of slider. You may download this professional slide to display data trends. Transmit your thoughts via this slide.


Slide 1 of 3
Graphic of test tube with lock and headphone icons have been used to design this Power Point template. You may use this diagram for data analysis and research. Present your views using our innovative slide and be assured of leaving a lasting impression.


Slide 1 of 3
This PPT slide has been designed with big data metrics and magnifying glass. This diagram helps to portray concept of data analysis and data search. Download this diagram to make professional presentations.


Slide 1 of 3
This PowerPoint template has been designed with graphic of iceberg diagram. This diagram slide depicts concept of big data problem and analysis Download this diagram to create professional presentations.


Slide 1 of 3
Explain the concept of sample advantages and benefits of big data analysis with this unique diagram. This slide contains the graphic of data icons. Use this slide to present data analysis and modeling related topics in any presentation.


Slide 1 of 3
This slide has been designed with graphic of circular source diagram. This diagram contains the concept of data source sensors and feeds of database files. Download this editable slide to build an exclusive presentation for your viewers.


Slide 1 of 3
This PowerPoint template has been designed with graphic of server and data transfer network. This slide contains the steps of big data, map, reduce and result. Use this editable diagram for data technology related presentations.


Slide 1 of 3
This unique diagram has been designed with graphic of magnifier on blue color text of bag data. This slide depicts concept of big data analysis. This professional diagram can be used for data communication and analysis related topics.


Slide 1 of 3
This PowerPoint template has been designed with graphic of magnifier on big data text. This magnifier is magnifying the binary data. This slide can be used to represent topics like binary, programming, coding etc.


Slide 1 of 3
Explain the complexity and analysis with this unique PowerPoint template. This technology diagram contains the graphic of three V's to display data complexity. Use this diagram to make professional presentations.


Slide 1 of 3
This diagram displays human face graphic with colored graph. This diagram can be used to represent strategy, planning, thinking of business plan. Display business options in your presentations by using this creative diagram.


Slide 1 of 3
This business diagram displays graphic of pie charts in shape of flasks. This business slide is suitable to present and compare business data. Use this diagram to build professional presentations for your viewers.


Slide 1 of 3
This business diagram displays graphic of pie charts in shape of magnifying glasses This business slide is suitable to present and compare business data. Use this diagram to build professional presentations for your viewers.


Slide 1 of 3
This business diagram displays graphic of pie charts. This business slide is suitable to present and compare business data. Use this diagram to build professional presentations for your viewers.


Slide 1 of 3
This PowerPoint template displays technology gadgets with various business charts. Use this diagram slide, in your presentations to make business reports for statistical analysis. You may use this diagram to impart professional appearance to your presentations.


Slide 1 of 3
This business slide displays pie chart. This diagram is a data visualization tool that gives you a simple way to present statistical information. This slide helps your audience examine and interpret the data you present.


Slide 1 of 3
This Power Point template has been designed with graphic of colored bar graph. Use this slide to represent five steps of any business process. Use this diagram for your business presentations and get exclusive comments on your efforts.


Slide 1 of 3
This business slide displays pie charts with percentage ratios. This diagram is a data visualization tool that gives you a simple way to present statistical information. This slide helps your audience examines and interprets the data you present.


Slide 1 of 3
Double Your Chances With Our business strategy 5 staged data analysis strategic plan example ppt slide Powerpoint Templates. The Value Of Your Thoughts Will Increase Two-Fold. Charm The Audience With Your Thoughts. Add Our Process and Flows Powerpoint Templates And They Will Be Dotty For You.


Slide 1 of 3
Our quantitative data analysis 3d pie chart for business statistics Powerpoint Templates Allow You To Do It With Ease. Just Like Picking The Low Hanging Fruit.


Slide 1 of 3
Put Them On The Same Page With Our quantitative data analysis 3d pie chart for business process Powerpoint Templates . Your Team Will Sing From The Same Sheet.


Slide 1 of 3
Double Up Our microsoft excel data analysis 3d chart for business observation Powerpoint Templates With Your Thoughts. They Will Make An Awesome Pair.


Slide 1 of 3
Double Your Chances With Our microsoft excel data analysis 3d change in business process chart Powerpoint Templates . The Value Of Your Thoughts Will Increase Two-Fold.


Slide 1 of 3
Ring The Duck With Our examples of data analysis market driven plotting the business values powerpoint slides Templates . Acquire The Points With Your Ideas.


Slide 1 of 3
Duct It Through With Our examples of data analysis market 3d business trend series chart Powerpoint Templates . Your Ideas Will Reach Into Their Minds Intact.


Slide 1 of 3
Drum It Out Loud And Clear On Our examples of data analysis market 3d business on regular intervals Powerpoint Templates . Your Words Will Ring In Their Ears.


Slide 1 of 3
Our examples of data analysis market 3d business intelligence and Powerpoint Templates Are Dual Purpose. They Help Instruct And Inform At The Same Time.


Slide 1 of 3
However Dry Your Topic Maybe. Make It Catchy With Our examples of data analysis market 3d business inspection procedure chart Powerpoint Templates .


Slide 1 of 3
Use Our data analysis template driven line chart for business trends powerpoint slides Templates As The Bit. Drill Your Thoughts Into Their Minds.


Slide 1 of 3
Do Not Allow Things To Drift. Ring In Changes With Our data analysis template driven line chart for business performance powerpoint slides Templates .


Slide 1 of 3
Your Thoughts Are Dripping With Wisdom. Lace It With Our data analysis template driven line chart for business information powerpoint slides Templates .


Slide 1 of 3
Bottle Your Thoughts In Our data analysis template driven line chart business graph powerpoint slides Templates . Pass It Around For Your Audience To Sip.


Slide 1 of 3
Display Your Drive On Our data analysis template driven express business facts pie chart powerpoint slides Templates . Invigorate The Audience With Your Fervor.


Slide 1 of 3
Add Some Dramatization To Your Thoughts. Our data analysis on excel driven stock chart for business growth powerpoint slides Templates Make Useful Props.


Slide 1 of 3
Break The Deadlock With Our data analysis on excel driven sets of business information powerpoint slides Templates . Let The Words Start To Flow.


Slide 1 of 3
Make Some Dough With Our data analysis on excel 3d chart to monitor business process Powerpoint Templates . Your Assets Will Rise Significantly.


Slide 1 of 3
Our data analysis on excel 3d chart to incorporate business information Powerpoint Templates Allow You To Do It With Ease. Just Like Picking The Low Hanging Fruit.


Slide 1 of 3
Edit Your Work With Our data analysis in excel column chart for business project Powerpoint Templates . They Will Help You Give The Final Form.


Slide 1 of 3
Our data analysis in excel column chart for business analytics Powerpoint Templates Heighten Concentration. Your Audience Will Be On The Edge.


Slide 1 of 3
Your Grasp Of Economics Is Well Known. Help Your Audience Comprehend Issues With Our data analysis in excel area chart for business process Powerpoint Templates .


Slide 1 of 3
Plan For All Contingencies With Our data analysis in excel 3d compare yearly business performance Powerpoint Templates . Douse The Fire Before It Catches.


Slide 1 of 3
Connect The Dots With Our data analysis in excel 3d bar chart for business trends Powerpoint Templates . Watch The Whole Picture Clearly Emerge.


Slide 1 of 3
Knock On The Door To Success With Our data analysis in excel 3d bar chart for business statistics Powerpoint Templates . Be Assured Of Gaining Entry.


Slide 1 of 3
Our data analysis in excel 3d bar chart for business information Powerpoint Templates Deliver At Your Doorstep. Let Them In For A Wonderful Experience.


Slide 1 of 3
Open Up Doors That Lead To Success. Our data analysis excel driven pie chart for business stratregy powerpoint slides Templates Provide The Handles.


Slide 1 of 3
Dominate Proceedings With Your Ideas. Our data analysis excel business tool scatter chart Powerpoint Templates Will Empower Your Thoughts.
SHOW
- 60
- 120
- 180
DISPLAYING: 60 of 262 Item(s)
Page