AI PPT Maker
Templates
PPT Bundles
Design Services
Business PPTs
Business Plan
Management
Strategy
Introduction PPT
Roadmap
Self Introduction
Timelines
Process
Marketing
Agenda
Technology
Medical
Startup Business Plan
Cyber Security
Dashboards
SWOT
Proposals
Education
Pitch Deck
Digital Marketing
KPIs
Project Management
Product Management
Artificial Intelligence
Target Market
Communication
Supply Chain
Google Slides
Research Services
One Pagers
All Categories
Business Dashboard PowerPoint Presentation Templates and Google Slides
SHOW
- 60
- 120
- 180
DISPLAYING: 60 of 1052 Item(s)
Page


Slide 1 of 34
Presenting this set of slides with name business commodity market kpis proposal ppt powerpoint presentation complete deck with slides. The topics discussed in these slides are marketing, techniques, analytics, work contract, cost estimation. This is a completely editable PowerPoint presentation and is available for immediate download. Download now and impress your audience.


Slide 1 of 16
Improve your presentation delivery using this Business Intelligence KPI Dashboard Ppt PowerPoint Presentation Complete Deck With Slides. Support your business vision and objectives using this well-structured PPT deck. This template offers a great starting point for delivering beautifully designed presentations on the topic of your choice. Comprising sixteen this professionally designed template is all you need to host discussion and meetings with collaborators. Each slide is self-explanatory and equipped with high-quality graphics that can be adjusted to your needs. Therefore, you will face no difficulty in portraying your desired content using this PPT slideshow. This PowerPoint slideshow contains every important element that you need for a great pitch. It is not only editable but also available for immediate download and utilization. The color, font size, background, shapes everything can be modified to create your unique presentation layout. Therefore, download it now.


Slide 1 of 15
Improve your presentation delivery using this Success Kpis For Business Analytics Transformation Ppt PowerPoint Presentation Complete With Slides. Support your business vision and objectives using this well-structured PPT deck. This template offers a great starting point for delivering beautifully designed presentations on the topic of your choice. Comprising fifteen this professionally designed template is all you need to host discussion and meetings with collaborators. Each slide is self-explanatory and equipped with high-quality graphics that can be adjusted to your needs. Therefore, you will face no difficulty in portraying your desired content using this PPT slideshow. This PowerPoint slideshow contains every important element that you need for a great pitch. It is not only editable but also available for immediate download and utilization. The color, font size, background, shapes everything can be modified to create your unique presentation layout. Therefore, download it now.


Slide 1 of 12
If designing a presentation takes a lot of your time and resources and you are looking for a better alternative, then this cost saving kpi business team ppt powerpoint presentation complete deck with slides is the right fit for you. This is a prefabricated set that can help you deliver a great presentation on the topic. All the twelve slides included in this sample template can be used to present a birds-eye view of the topic. These slides are also fully editable, giving you enough freedom to add specific details to make this layout more suited to your business setting. Apart from the content, all other elements like color, design, theme are also replaceable and editable. This helps in designing a variety of presentations with a single layout. Not only this, you can use this PPT design in formats like PDF, PNG, and JPG once downloaded. Therefore, without any further ado, download and utilize this sample presentation as per your liking.


Slide 1 of 12
Improve your presentation delivery using this driving business value with internet of things dashboard ppt powerpoint presentation complete deck. Support your business vision and objectives using this well-structured PPT deck. This template offers a great starting point for delivering beautifully designed presentations on the topic of your choice. Comprising twelve slides this professionally designed template is all you need to host discussion and meetings with collaborators. Each slide is self-explanatory and equipped with high-quality graphics that can be adjusted to your needs. Therefore, you will face no difficulty in portraying your desired content using this PPT slideshow. This PowerPoint slideshow contains every important element that you need for a great pitch. It is not only editable but also available for immediate download and utilization. The color, font size, background, shapes everything can be modified to create your unique presentation layout. Therefore, download it now.


Slide 1 of 7
This is a kpi with business planning presentation pictures. This is a eight stage process. The stages in this process are marketing, business, management.


Slide 1 of 7
This is a business kpi dashboard diagram powerpoint slides. This is a four stage process. The stages in this process are kpi tracking, activity planning, targeting, data management.


Slide 1 of 7
This is a business alternatives analysis dashboard powerpoint ideas. This is a two stage process. The stages in this process are strategy, marketing, business, finance, donut.


Slide 1 of 7
This is a business support services kpis powerpoint slides. This is a six stage process. The stages in this process are activities, outcomes, vision and action, work life awareness, leveraging diversity, performance reporting.


Slide 1 of 7
This is a business strategy scorecard dashboard ppt slides. This is a five stage process. The stages in this process are marketing, logistics, production, planning, combined strategy.


Slide 1 of 7
This is a business analytics dashboard diagram. This is a one stage process. The stages in this process are analytics, decision, data, business, statistics.


Slide 1 of 7
This is a business intelligence roadmap dashboard ppt powerpoint graphic. This is a five stage process. The stages in this process are strategy roadmap, stakeholder management, architectural blueprint, capability improvement, implementation planning.


Slide 1 of 6
This is a logistics kpi metrics business ppt powerpoint presentation ideas infographics. This is a four stage process. The stages in this process are finance, marketing, management, investment, analysis.


Slide 1 of 6
This is a logistics kpi metrics business ppt powerpoint presentation layouts microsoft. This is a two stage process. The stages in this process are finance, marketing, management, investment, analysis.


Slide 1 of 6
This is a sales performance dashboard business ppt powerpoint presentation pictures visuals . This is a three stage process. The stages in this process are finance, marketing, management, investment, analysis.


Slide 1 of 6
This is a cash flow statement kpis business ppt powerpoint presentation gallery introduction. This is a four stage process. The stages in this process are compare, marketing, business, management, planning.


Slide 1 of 6
This is a key business metrics dashboard ppt powerpoint presentation file objects. This is a five stage process. The stages in this process are business, management, marketing, dashboard.


Slide 1 of 6
This is a business sales dashboard revenue summary report ppt powerpoint presentation pictures structure. This is a two stage process. The stages in this process are business analytics, ba, organizations data.


Slide 1 of 6
This is a dashboard business marketing ppt powerpoint presentation icon maker. This is a three stage process. The stages in this process are finance, marketing, management, investment, analysis.


Slide 1 of 6
This is a dashboard marketing business ppt powerpoint presentation gallery slide portrait. This is a three stage process. The stages in this process are finance, marketing, management, investment, analysis.


Slide 1 of 6
This is a business review and performance assessment dashboards ppt powerpoint presentation infographics show. This is a four stage process. The stages in this process are year in review, yearly highlights, countdowns.


Slide 1 of 6
This is a financial management kpi metrics business ppt powerpoint presentation styles diagrams. This is a four stage process. The stages in this process are finance, marketing, management, investment, analysis.


Slide 1 of 6
This is a financial management kpi dashboards business ppt powerpoint presentation inspiration designs. This is a six stage process. The stages in this process are finance, marketing, management, investment, analysis.


Slide 1 of 6
This is a business kpi and benchmarking competence results success ppt powerpoint presentation icon graphic images. This is a four stage process. The stages in this process are best practice, best technique, best procedure.


Slide 1 of 6
This is a financial management kpi metrics business ppt powerpoint presentation model example. This is a three stage process. The stages in this process are finance, marketing, management, investment, analysis.


Slide 1 of 6
This is a financial management kpi dashboards business ppt powerpoint presentation infographic template deck. This is a four stage process. The stages in this process are finance, marketing, management, investment, analysis.


Slide 1 of 6
This is a key business metrics dashboard ppt powerpoint presentation icon graphics design. This is a five stage process. The stages in this process are finance, marketing, management, investment, analysis.


Slide 1 of 6
This is a 70 dashboard business management ppt powerpoint presentation model portfolio. This is a four stage process. The stages in this process are dashboard, business, marketing, management, planning.


Slide 1 of 6
This is a financial management kpi metrics business ppt powerpoint presentation gallery file formats. This is a four stage process. The stages in this process are finance, marketing, management, investment, analysis.


Slide 1 of 6
This is a financial management kpi dashboards business ppt powerpoint presentation show gridlines. This is a four stage process. The stages in this process are finance, marketing, management, investment, analysis.


Slide 1 of 5
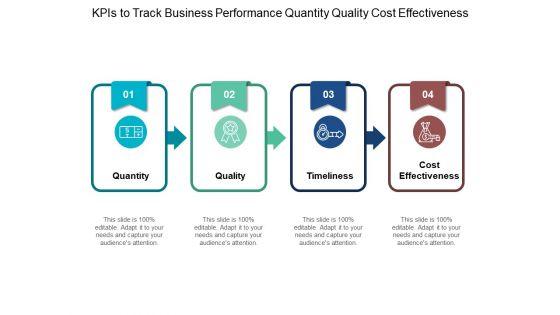
Presenting this set of slides with name kpis to track business performance quantity quality cost effectiveness ppt powerpoint presentation styles show. This is a four stage process. The stages in this process are Marketing, Business, Management, Planning, Strategy. This is a completely editable PowerPoint presentation and is available for immediate download. Download now and impress your audience.


Slide 1 of 5
This is a marketing management kpi metrics business ppt powerpoint presentation show shapes. This is a four stage process. The stages in this process are compare, marketing, business, management, planning.


Slide 1 of 5
This is a marketing management dashboard business ppt powerpoint presentation show format. This is a four stage process. The stages in this process are finance, marketing, management, investment, analysis.


Slide 1 of 5
This is a key business metrics dashboard ppt powerpoint presentation outline model cpb. This is a six stage process. The stages in this process are key business metrics dashboard.


Slide 1 of 5
This is a business kpi dashboard ppt powerpoint presentation styles deck cpb. This is a four stage process. The stages in this process are business kpi dashboard.


Slide 1 of 5
This is a kpi business analyst ppt powerpoint presentation ideas layouts cpb. This is a three stage process. The stages in this process are kpi business analyst.


Slide 1 of 5
This is a cash flow statement kpis business ppt powerpoint presentation infographics demonstration. This is a four stage process. The stages in this process are business, management, planning, strategy, marketing.


Slide 1 of 5
This is a business kpi ppt powerpoint presentation infographics format cpb. This is a four stage process. The stages in this process are business kpi.


Slide 1 of 5
This is a financial kpis for business growth liquidity efficiency and solvency ppt powerpoint presentation summary gridlines. This is a seven stage process. The stages in this process are dashboard, kpi, metrics.


Slide 1 of 5
This is a business performance dashboard icon ppt powerpoint presentation file images. This is a five stage process. The stages in this process are production management, production performance, production improvement.


Slide 1 of 5
This is a event planning services online business directories business dashboards ppt powerpoint presentation file background images. This is a four stage process. The stages in this process are event planning services, online business directories, business dashboards.


Slide 1 of 5
This is a business analytics dashboard capital budgeting automation lead management ppt powerpoint presentation influencers. This is a two stage process. The stages in this process are business analytics dashboard, capital budgeting automation, lead management.


Slide 1 of 5
This is a kpis of business divisions reach visitors processing time ppt powerpoint presentation slides outfit. This is a three stage process. The stages in this process are kpi proposal, kpi plan, kpi scheme.


Slide 1 of 5
This is a business growth kpis ppt powerpoint presentation file good. This is a five stage process. The stages in this process are cost reduction strategies.


Slide 1 of 5
This is a performance business dashboard ppt powerpoint presentation visuals. This is a four stage process. The stages in this process are dashboard, speedometer, report, business, marketing.


Slide 1 of 5
This is a dashboards for effective business administration powerpoint slide influencers. This is a four stage process. The stages in this process are customer, internal business processes, financial, learning and growth.


Slide 1 of 5
This is a dashboards for measuring business performance ppt icon. This is a three stage process. The stages in this process are dashboard, measuring, management, speedometer, icons, strategy.


Slide 1 of 5
This is a business performance dashboard analysis diagram powerpoint slides. This is a three stage process. The stages in this process are measure, business, management, presentation, process.


Slide 1 of 5
This is a business management dashboard design ppt slides show. This is a four stage process. The stages in this process are crm system, property system, asset system, finance system.


Slide 1 of 5
This is a business kpi dashboard diagram powerpoint templates. This is a six stage process. The stages in this process are analytics, cost per sales, reporting, kpis, dashboard, visualization.


Slide 1 of 5
This is a business dashboard diagram ppt powerpoint slides. This is a three stage process. The stages in this process are low, medium, high.


Slide 1 of 5
This is a business company dashboards ppt powerpoint slide show. This is a four stage process. The stages in this process are presentation, finance, management, business, strategy, success.


Slide 1 of 5
This is a build dashboard for business diagram powerpoint show. This is a four stage process. The stages in this process are average internal pv examination lead time, average entry variance, average internal audit lead time, amount contribution.


Slide 1 of 4
This is a dashboard business intelligence diagram powerpoint slides. This is a four stage process. The stages in this process are quickbase, flexible, simple, organized.


Slide 1 of 4
This is a business object dashboard slide good ppt example. This is a seven stage process. The stages in this process are engineering, construction, finance, environment, safety, operations, maintenance.


Slide 1 of 4
This is a business metrics dashboard slide powerpoint templates. This is a five stage process. The stages in this process are cash flow, turnover, productivity, customer satisfaction, net income.


Slide 1 of 4
This is a business management dashboard slide powerpoint graphics. This is a four stage process. The stages in this process are property system, crm system, asset system, finance system.


Slide 1 of 4
This is a business kpi dashboard slide powerpoint presentation templates. This is a four stage process. The stages in this process are sales, marketing, budget, people.


Slide 1 of 4
This is a business metrics dashboard presentation powerpoint example. This is a two stage process. The stages in this process are facebook, twitter.


Slide 1 of 4
This is a business intelligence performance dashboard ppt powerpoint slides. This is a six stage process. The stages in this process are total revenue, detailed profit of top product line, part capacity allocation, market share, customer satisfaction, quality notification.
SHOW
- 60
- 120
- 180
DISPLAYING: 60 of 1052 Item(s)
Page