AI PPT Maker
Templates
PPT Bundles
Design Services
Business PPTs
Business Plan
Management
Strategy
Introduction PPT
Roadmap
Self Introduction
Timelines
Process
Marketing
Agenda
Technology
Medical
Startup Business Plan
Cyber Security
Dashboards
SWOT
Proposals
Education
Pitch Deck
Digital Marketing
KPIs
Project Management
Product Management
Artificial Intelligence
Target Market
Communication
Supply Chain
Google Slides
Research Services
 One Pagers
All Categories
Data-visualization PowerPoint Presentation Templates and Google Slides
SHOW
- 60
- 120
- 180
DISPLAYING: 60 of 120 Item(s)
Page


Slide 1 of 51
You will save yourself your energy and hours of time when you choose to use this impactful PowerPoint Deck. This Linked Data Visualization Ppt PowerPoint Presentation Complete Deck With Slides has been tailor-made to your business needs which ensures that you will always be prepared for that next meeting. Worry cant touch you when you present in your area of expertise using this PPT Template Bundle. With a modern design and easy to follow structure, this PowerPoint Presentation has fifity one slides, which ensures that you can cover you need to without much work. Create your next presentation using this PPT Theme to deliver a memorable performance.


Slide 1 of 7
This is a big data visual tool box diagram ppt infographic template. This is a five stage process. The stages in this process are volume, cloud, velocity, big data, variety.


Slide 1 of 7
This is a data visualization and predictive analysis chart ppt slides. This is a nine stage process. The stages in this process are business requirement, data exploration, data selection, data preparation, design model, validate model, deploy model, analyze results, update model, revalidate.


Slide 1 of 6
This is a financial waterfall chart for data visualization ppt powerpoint presentation ideas elements. This is a five stage process. The stages in this process are sales waterfall, waterfall chart, business.


Slide 1 of 5
Presenting this set of slides with name customer data visualization ppt powerpoint presentation model templates cpb. This is an editable Powerpoint three stages graphic that deals with topics like customer data visualization to help convey your message better graphically. This product is a premium product available for immediate download and is 100 percent editable in Powerpoint. Download this now and use it in your presentations to impress your audience.


Slide 1 of 5
Presenting this set of slides with name personal data visualization on computer screen ppt powerpoint presentation show layout ideas. This is a one stage process. The stages in this process are data visualization icon, research analysis, business focus. This is a completely editable PowerPoint presentation and is available for immediate download. Download now and impress your audience.


Slide 1 of 5
Presenting this set of slides with name data reports visualization vector ppt powerpoint presentation visual aids deck. The topics discussed in these slides are data visualization icon, research analysis, business focus. This is a completely editable PowerPoint presentation and is available for immediate download. Download now and impress your audience.


Slide 1 of 5
Presenting this set of slides with name predictive data visualization ppt powerpoint presentation infographics design ideas cpb. This is an editable Powerpoint five stages graphic that deals with topics like predictive data visualization to help convey your message better graphically. This product is a premium product available for immediate download and is 100 percent editable in Powerpoint. Download this now and use it in your presentations to impress your audience.


Slide 1 of 5
Presenting this set of slides with name marketing data visualization ppt powerpoint presentation infographics rules cpb. This is an editable Powerpoint four stages graphic that deals with topics like marketing data visualization to help convey your message better graphically. This product is a premium product available for immediate download and is 100 percent editable in Powerpoint. Download this now and use it in your presentations to impress your audience.


Slide 1 of 5
Presenting this set of slides with name data visualization tool ppt powerpoint presentation summary visuals cpb. This is an editable Powerpoint five stages graphic that deals with topics like data visualization tool to help convey your message better graphically. This product is a premium product available for immediate download and is 100 percent editable in Powerpoint. Download this now and use it in your presentations to impress your audience.


Slide 1 of 5
Presenting this set of slides with name employee competency assessment table data visualization ppt powerpoint presentation infographic template grid. The topics discussed in these slides are marketing, business, management, planning, strategy. This is a completely editable PowerPoint presentation and is available for immediate download. Download now and impress your audience.
Slide 1 of 5
This is a data visualization vector icon with text holders ppt powerpoint presentation summary design inspiration. The topics discussed in this diagram are data management icon, big data icon. This is a completely editable PowerPoint presentation, and is available for immediate download.
Slide 1 of 5
This is a data visualization ppt powerpoint presentation icon brochure cpb. This is a six stage process. The stages in this process are data visualization.


Slide 1 of 5
This is a business value data visualization ppt powerpoint presentation infographic template background images cpb. This is a three stage process. The stages in this process are business value data visualization.


Slide 1 of 5
This is a data analytics visualization ppt powerpoint presentation visual aids portfolio cpb. This is a five stage process. The stages in this process are data analytics visualization.


Slide 1 of 5
This is a bar plot for data visualization ppt powerpoint presentation pictures guide. This is a four stage process. The stages in this process are scatter plot, probability plots, plot diagram.


Slide 1 of 5
This is a personal data visualization on computer screen ppt powerpoint presentation infographics vector. This is a three stage process. The stages in this process are data visualization icon, data management icon.


Slide 1 of 5
This is a data reports visualization vector ppt powerpoint presentation portfolio grid. This is a three stage process. The stages in this process are data visualization icon, data management icon.


Slide 1 of 5
This is a four steps process for data visualization ppt powerpoint presentation infographic template inspiration. This is a four stage process. The stages in this process are circle process 4 arrows, circle cycle 4 arrows, circular process 4 arrows.


Slide 1 of 5
This is a data visualizations program management ppt powerpoint presentation gallery styles. This is a four stage process. The stages in this process are data visualizations, program management.


Slide 1 of 5
This is a project data visualization techniques bulb ppt powerpoint presentation example file. This is a five stage process. The stages in this process are idea, bulb, planning, visualization, techniques, project data.


Slide 1 of 5
This is a data visualization for market ppt example. This is a six stage process. The stages in this process are tree map chart, exploded pie chart, semi circle chart, bubble chart, line chart, stacked chart, series.


Slide 1 of 4
This is a dashboard data visualization ppt powerpoint slides design. This is a four stage process. The stages in this process are business, presentation, success, marketing, finance.


Slide 1 of 3
Graphic of workflow has been used to design this diagram. This diagram slide depicts the concept of data visualization from data access. This diagrams suitable for technology and internet related presentations.


Slide 1 of 3
Your Listeners Will Never Doodle. Our business plan and strategy 4 stages for data visualization strategic planning template ppt slide Powerpoint Templates Will Hold Their Concentration. Do The One Thing With Your Thoughts. Uphold Custom With Our Process and Flows Powerpoint Templates.


Slide 1 of 3
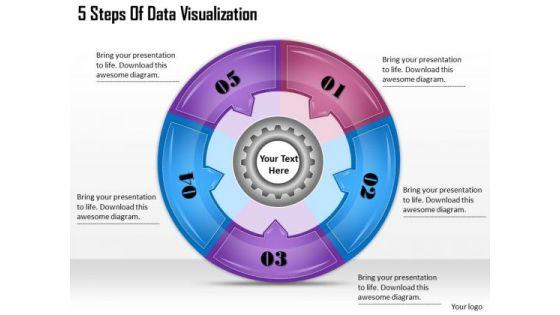
Delight Them With Our Timeline Ppt Template 5 Steps Of Data Visualization Powerpoint Templates.


Slide 1 of 3
We present our stages data visualization of stack overflow short business plan template PowerPoint Slides.Download and present our Advertising PowerPoint Templates because Our PowerPoint Templates and Slides are truly out of this world. Even the MIB duo has been keeping tabs on our team. Present our Competition PowerPoint Templates because You canTake a leap off the starting blocks with our PowerPoint Templates and Slides. They will put you ahead of the competition in quick time. Download and present our Business PowerPoint Templates because Our PowerPoint Templates and Slides come in all colours, shades and hues. They help highlight every nuance of your views. Use our Shapes PowerPoint Templates because you can Set pulses racing with our PowerPoint Templates and Slides. They will raise the expectations of your team. Use our Targets PowerPoint Templates because you should once Tap the ingenuity of our PowerPoint Templates and Slides. They are programmed to succeed.Use these PowerPoint slides for presentations relating to Legal, pressure, heap, documents, file, messy, copy, bureaucracy, order, business, problems, chaos, stack, pile, occupation, finance, data, cardboard, supply, report, vertical, folders, tall, paperwork, stacking, up, overflowing, high, excess, group, objects, paper, over-sized, organization, archive, working, angle, space, drudgery, organized, office, large, ideas, 3d. The prominent colors used in the PowerPoint template are Blue, Gray, White. Optimize your business cyclewith our Stages Data Visualization Of Stack Overflow Short Business Plan Template PowerPoint Slides. You'll deliver your best presentation yet.


Slide 1 of 3
We present our stages data visualization of stack overflow online business plan software PowerPoint Slides.Download and present our Advertising PowerPoint Templates because Our PowerPoint Templates and Slides will let you Clearly mark the path for others to follow. Download and present our Competition PowerPoint Templates because Our PowerPoint Templates and Slides will let Your superior ideas hit the target always and everytime. Download our Business PowerPoint Templates because Timeline crunches are a fact of life. Meet all deadlines using our PowerPoint Templates and Slides. Download and present our Shapes PowerPoint Templates because Our PowerPoint Templates and Slides are innately eco-friendly. Their high recall value negate the need for paper handouts. Use our Targets PowerPoint Templates because You can Hit the nail on the head with our PowerPoint Templates and Slides. Embed your ideas in the minds of your audience.Use these PowerPoint slides for presentations relating to Legal, pressure, heap, documents, file, messy, copy, bureaucracy, order, business, problems, chaos, stack, pile, occupation, finance, data, cardboard, supply, report, vertical, folders, tall, paperwork, stacking, up, overflowing, high, excess, group, objects, paper, over-sized, organization, archive, working, angle, space, drudgery, organized, office, large, ideas, 3d. The prominent colors used in the PowerPoint template are Blue, Gray, White. Assist the audience to comprehend with our Stages Data Visualization Of Stack Overflow Online Business Plan Software PowerPoint Slides. They will always be in your debt.

Slide 1 of 3
We present our data visualization of stack overflow template for writing business plan PowerPoint Slides.Download our Business PowerPoint Templates because Our PowerPoint Templates and Slides will embellish your thoughts. See them provide the desired motivation to your team. Present our Process and Flows PowerPoint Templates because Our PowerPoint Templates and Slides are the chords of your song. String them along and provide the lilt to your views. Use our Flow Charts PowerPoint Templates because Our PowerPoint Templates and Slides are effectively colour coded to prioritise your plans They automatically highlight the sequence of events you desire. Use our Shapes PowerPoint Templates because You can Bask in the warmth of our PowerPoint Templates and Slides. Enjoy the heartfelt glowing response of your listeners. Use our Triangles PowerPoint Templates because Our PowerPoint Templates and Slides help you meet the demand of the Market. Just browse and pick the slides that appeal to your intuitive senses.Use these PowerPoint slides for presentations relating to Saturation, strip, saturated, line, spectrum, pantone, bright, diagram, circle, sampler, guide, element, paint, scale,shape, ten, multicolored, palette, illustration, spectral, guidance, chart, collection, abstraction, selection, choice, visible, variation, painter, contrast, ,gradient, pattern, chooser, analyzer. The prominent colors used in the PowerPoint template are Blue navy, White, Gray. Get to the core of the issue. Bring out the essence with our Data Visualization Of Stack Overflow Template For Writing Business Plan PowerPoint Slides.

Slide 1 of 3
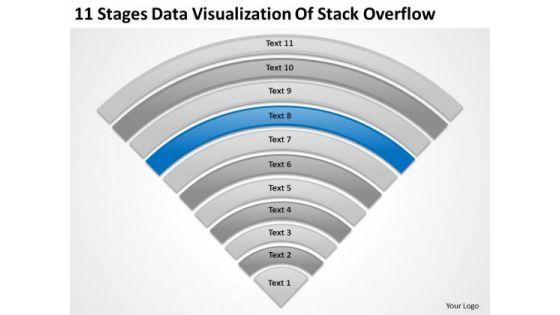
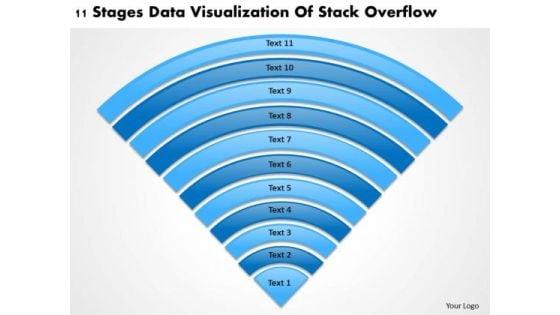
We present our 11 stages data visualization of stack overflow how make business plan PowerPoint Slides.Download our Triangles PowerPoint Templates because You canTake a leap off the starting blocks with our PowerPoint Templates and Slides. They will put you ahead of the competition in quick time. Download our Process and Flows PowerPoint Templates because Our PowerPoint Templates and Slides will provide weight to your words. They will bring out the depth of your thought process. Present our Shapes PowerPoint Templates because Our PowerPoint Templates and Slides will Activate the energies of your audience. Get their creative juices flowing with your words. Present our Semicircles PowerPoint Templates because our PowerPoint Templates and Slides will give your ideas the shape. Download our Business PowerPoint Templates because It will get your audience in sync.Use these PowerPoint slides for presentations relating to Saturation, strip, saturated, line, spectrum, pantone, bright, diagram, circle, sampler, guide, element, paint, scale,shape, label, multicolored, palette, illustration, spectral, guidance, chart, collection, abstraction, selection, choice, visible, variation, painter, contrast, ,gradient, pattern, chooser, analyzer, eleven, steps. The prominent colors used in the PowerPoint template are Blue, Gray, Black. Identify likely ares of failure. Alert your team with our 11 Stages Data Visualization Of Stack Overflow How Make Business Plan PowerPoint Slides.


Slide 1 of 3
We present our 11 stages data visualization of stack overflow download business plan PowerPoint templates.Use our Triangles PowerPoint Templates because you should once Tap the ingenuity of our PowerPoint Templates and Slides. They are programmed to succeed. Download our Process and Flows PowerPoint Templates because Our PowerPoint Templates and Slides will give good value for money. They also have respect for the value of your time. Download our Shapes PowerPoint Templates because Our PowerPoint Templates and Slides will embellish your thoughts. See them provide the desired motivation to your team. Download and present our Semicircles PowerPoint Templates because It can be used to Set your controls for the heart of the sun. Our PowerPoint Templates and Slides will be the propellant to get you there. Download and present our Business PowerPoint Templates because Your ideas provide food for thought. Our PowerPoint Templates and Slides will help you create a dish to tickle the most discerning palate.Use these PowerPoint slides for presentations relating to Saturation, strip, saturated, line, spectrum, pantone, bright, diagram, circle, sampler, guide, element, paint, scale,shape, label, multicolored, palette, illustration, spectral, guidance, chart, collection, abstraction, selection, choice, visible, variation, painter, contrast, ,gradient, pattern, chooser, analyzer, eleven, steps. The prominent colors used in the PowerPoint template are Blue light, White, Gray. Discerning clients can be very demanding. But even they will findour 11 Stages Data Visualization Of Stack Overflow Download Business Plan PowerPoint Templates exceptional.


Slide 1 of 3
We present our 11 stages data visualization of stack overflow business plan format PowerPoint Slides.Present our Semicircles PowerPoint Templates because Our PowerPoint Templates and Slides are the chords of your song. String them along and provide the lilt to your views. Present our Business PowerPoint Templates because Our PowerPoint Templates and Slides are effectively colour coded to prioritise your plans They automatically highlight the sequence of events you desire. Use our Triangles PowerPoint Templates because Our PowerPoint Templates and Slides are created with admirable insight. Use them and give your group a sense of your logical mind. Present our Process and Flows PowerPoint Templates because Our PowerPoint Templates and Slides will let Your superior ideas hit the target always and everytime. Use our Shapes PowerPoint Templates because Our PowerPoint Templates and Slides will Activate the energies of your audience. Get their creative juices flowing with your words.Use these PowerPoint slides for presentations relating to Saturation, strip, saturated, line, spectrum, pantone, bright, diagram, circle, sampler, guide, element, paint, scale,shape, label, multicolored, palette, illustration, spectral, guidance, chart, collection, abstraction, selection, choice, visible, variation, painter, contrast, ,gradient, pattern, chooser, analyzer, eleven, steps. The prominent colors used in the PowerPoint template are Blue, Black, White. Approach any ambiguity with assurance. Achieve better balance with our 11 Stages Data Visualization Of Stack Overflow Business Plan Format PowerPoint Slides.


Slide 1 of 3
We present our stages data visualization of stack overflow company business plan PowerPoint Slides.Download our Business PowerPoint Templates because you should Whip up a frenzy with our PowerPoint Templates and Slides. They will fuel the excitement of your team. Use our Leadership PowerPoint Templates because It can Leverage your style with our PowerPoint Templates and Slides. Charm your audience with your ability. Present our Layers PowerPoint Templates because You will get more than you ever bargained for. Present our Shapes PowerPoint Templates because Our PowerPoint Templates and Slides will help you be quick off the draw. Just enter your specific text and see your points hit home. Use our Triangles PowerPoint Templates because Our PowerPoint Templates and Slides will generate and maintain the level of interest you desire. They will create the impression you want to imprint on your audience.Use these PowerPoint slides for presentations relating to layers, icon, stratum, 3d, surface, isolated, segment, grow, blank, presentation, illustration, section, cutting, coat, set, background, thickness, spread, multiple. The prominent colors used in the PowerPoint template are Blue light, Blue navy, White. Our Stages Data Visualization Of Stack Overflow Company Business Plan PowerPoint Slides will ensure your ideas are noticed. You will be glad you tried us out.


Slide 1 of 2
This slide illustrates graphical representation of visualization abilities of artificial intelligence on social media. It includes total impressions, total clicks, performance review etc. Pitch your topic with ease and precision using this Social Media Artificial Intelligence Data Visualization Capabilities Dashboard Inspiration PDF. This layout presents information on Artificial Intelligence, Data Visualization Capabilities. It is also available for immediate download and adjustment. So, changes can be made in the color, design, graphics or any other component to create a unique layout.


Slide 1 of 2
This slide represents the principles of linked data, such as using uniform resource identifier names, utilizing HTTP URIs for identification, standards to deliver information to users, and adding links of other uniform resource identifiers. The best PPT templates are a great way to save time, energy, and resources. Slidegeeks have 100 percent editable powerpoint slides making them incredibly versatile. With these quality presentation templates, you can create a captivating and memorable presentation by combining visually appealing slides and effectively communicating your message. Download Linked Data Visualization Principles Of Linked Data System Ppt Outline Portrait PDF from Slidegeeks and deliver a wonderful presentation.


Slide 1 of 2
This slide describes the data quality dashboard for linked data by covering details of account information quality, contact details quality, financial data quality, and missing account information. Create an editable Linked Data Visualization Data Quality Dashboard For Linked Data Pictures PDF that communicates your idea and engages your audience. Whether youre presenting a business or an educational presentation, pre-designed presentation templates help save time. Linked Data Visualization Data Quality Dashboard For Linked Data Pictures PDF is highly customizable and very easy to edit, covering many different styles from creative to business presentations. Slidegeeks has creative team members who have crafted amazing templates. So, go and get them without any delay.


Slide 1 of 2
This slide represents the data visualization with an augmented analytics dashboard covering sales, spending per customer, gross profit, unique customers, unique purchase, and gross profit. Deliver an awe inspiring pitch with this creative Augmented Analytics Implementation IT Data Visualization With Augmented Analytics Microsoft PDF bundle. Topics like Category Contribution, Category Year To Year Growth, Top Products, Sales, Gross Profit can be discussed with this completely editable template. It is available for immediate download depending on the needs and requirements of the user.


Slide 1 of 2
This slide represents another data visualization research tool that provides a high level of compatibility and is also a popular tool for commercial use.Presenting Departments Of Visualization Research Highcharts As Data Visualization Research Tool Ideas PDF to provide visual cues and insights. Share and navigate important information on four stages that need your due attention. This template can be used to pitch topics like Integrate Interactive, Necessitates The Purchase, Javascript Chart Framework In addtion, this PPT design contains high resolution images, graphics, etc, that are easily editable and available for immediate download.


Slide 1 of 2
This slide depicts google charts as the tool for data visualization, which can extract data from various sources, including SQL, databases, google sheets.This is a Departments Of Visualization Research Google Charts Tool For Data Visualization Themes PDF template with various stages. Focus and dispense information on five stages using this creative set, that comes with editable features. It contains large content boxes to add your information on topics like Popular Free Alternative, Create Dynamic Data, Including SQL Databases You can also showcase facts, figures, and other relevant content using this PPT layout. Grab it now.


Slide 1 of 2
Departments Of Visualization Research Different Types Of Analysis For Data Visualization Summary PDF
This slide describes the different types of analysis for data visualization, such as univariate analysis, bivariate analysis, and multivariate analysis.This is a Departments Of Visualization Research Different Types Of Analysis For Data Visualization Summary PDF template with various stages. Focus and dispense information on five stages using this creative set, that comes with editable features. It contains large content boxes to add your information on topics like Multivariate Analysis, Assess Practically, Univariate Analysis You can also showcase facts, figures, and other relevant content using this PPT layout. Grab it now.
Slide 1 of 2
This slide describes that using visualization in academic areas caters to easy detection of trendy data sets and helps understand the data. Presenting Departments Of Visualization Research Data Visualization Helps In Academic Research Icons PDF to provide visual cues and insights. Share and navigate important information on six stages that need your due attention. This template can be used to pitch topics like Eliminating Irrelevant, Visualizations Condense, Employed Successfully In addtion, this PPT design contains high resolution images, graphics, etc, that are easily editable and available for immediate download.


Slide 1 of 2
This slide depicts the D3 as the data visualization research tool based on java and includes various tools and techniques for data processing, layout algorithms, and generating graphics.Presenting Departments Of Visualization Research D3 Data Driven Documents As Data Visualization Structure PDF to provide visual cues and insights. Share and navigate important information on seven stages that need your due attention. This template can be used to pitch topics like Manipulation Documentation, Visualization Components, Generating Graphics In addtion, this PPT design contains high resolution images, graphics, etc, that are easily editable and available for immediate download.


Slide 1 of 2
Departments Of Visualization Research Bivariate Analysis Techniques For Data Visualization Ideas PDF
This slide describes the second analysis technique, bivariate analysis for data visualization, which includes three plots line, bar, and scatter.This is a Departments Of Visualization Research Bivariate Analysis Techniques For Data Visualization Ideas PDF template with various stages. Focus and dispense information on three stages using this creative set, that comes with editable features. It contains large content boxes to add your information on topics like Effective In Evaluating, Displaying Basic, Range Of Applications, Including You can also showcase facts, figures, and other relevant content using this PPT layout. Grab it now.


Slide 1 of 2
This slide depicts the univariate analysis technique for data visualization, including distribution, box and whisker, and the violin plot.This is a Departments Of Visualization Research Univariate Analysis Techniques For Data Visualization Microsoft PDF template with various stages. Focus and dispense information on three stages using this creative set, that comes with editable features. It contains large content boxes to add your information on topics like Distribution Plot, Box And Whisker Plot, Violin Plot You can also showcase facts, figures, and other relevant content using this PPT layout. Grab it now.


Slide 1 of 2
This slide depicts google charts as the tool for data visualization, which can extract data from various sources, including SQL, databases, google sheets. This is a graphical representation of research it google charts tool for data visualization introduction pdf template with various stages. Focus and dispense information on five stages using this creative set, that comes with editable features. It contains large content boxes to add your information on topics like dynamic, databases, sources, technology. You can also showcase facts, figures, and other relevant content using this PPT layout. Grab it now.


Slide 1 of 2
This slide describes that using visualization in academic areas caters to easy detection of trendy data sets and helps understand the data. Presenting graphical representation of research it data visualization helps in academic research microsoft pdf to provide visual cues and insights. Share and navigate important information on six stages that need your due attention. This template can be used to pitch topics like data visualization helps in academic research. In addtion, this PPT design contains high resolution images, graphics, etc, that are easily editable and available for immediate download.


Slide 1 of 2
This slide represents another data visualization research tool that provides a high level of compatibility and is also a popular tool for commercial use. This is a graphical representation of research it highcharts as data visualization research demonstration pdf template with various stages. Focus and dispense information on four stages using this creative set, that comes with editable features. It contains large content boxes to add your information on topics like highcharts as data visualization research tool. You can also showcase facts, figures, and other relevant content using this PPT layout. Grab it now.


Slide 1 of 2
This slide describes the different types of analysis for data visualization, such as univariate analysis, bivariate analysis, and multivariate analysis. This is a graphical representation of research it different types of analysis for data visualization structure pdf template with various stages. Focus and dispense information on five stages using this creative set, that comes with editable features. It contains large content boxes to add your information on topics like different types of analysis for data visualization. You can also showcase facts, figures, and other relevant content using this PPT layout. Grab it now.
Slide 1 of 2
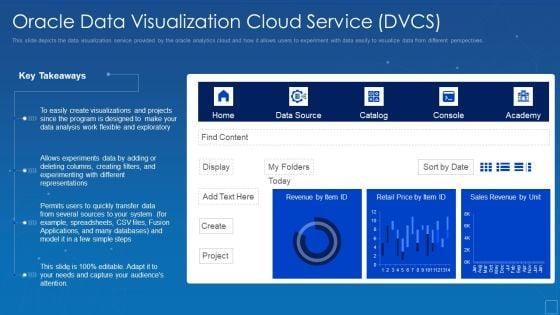
This slide depicts the data visualization service provided by the oracle analytics cloud and how it allows users to experiment with data easily to visualize data from different perspectives. Deliver an awe inspiring pitch with this creative oracle cloud data analytics administration it oracle data visualization cloud service dvcs inspiration pdf bundle. Topics like experiments, representations, sources, visualizations can be discussed with this completely editable template. It is available for immediate download depending on the needs and requirements of the user.


Slide 1 of 2
This slide represents the predictive analytics solution of the oracle analytics cloud and how it is helpful to predict outputs and display quickly with the help of ML. Deliver an awe inspiring pitch with this creative oracle analytics cloud solutions powerful data visualization template pdf bundle. Topics like oracle analytics cloud solutions powerful data visualization can be discussed with this completely editable template. It is available for immediate download depending on the needs and requirements of the user.
Slide 1 of 2
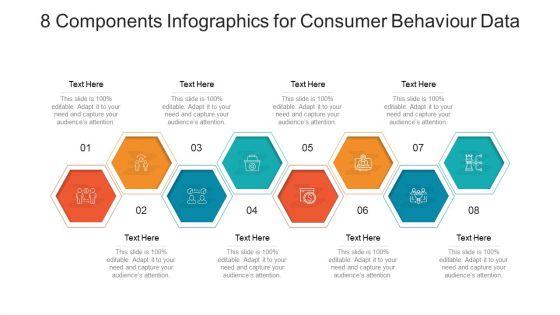
Presenting 8 components infographics for consumer behaviour data ppt visual aids portfolio pdf to dispense important information. This template comprises eight stages. It also presents valuable insights into the topics including 8 components infographics for consumer behaviour data. This is a completely customizable PowerPoint theme that can be put to use immediately. So, download it and address the topic impactfully.
Slide 1 of 2
Presenting key nodes with data visualization vector icon ppt powerpoint presentation icon example introduction pdf to dispense important information. This template comprises three stages. It also presents valuable insights into the topics including key nodes with data visualization vector icon. This is a completely customizable PowerPoint theme that can be put to use immediately. So, download it and address the topic impactfully.

Slide 1 of 2
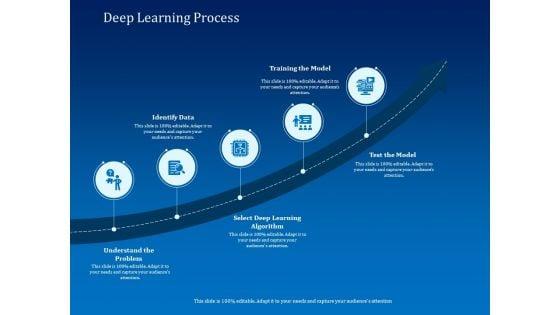
Presenting back propagation program ai deep learning process identify data ppt visual aids inspiration pdf to provide visual cues and insights. Share and navigate important information on five stages that need your due attention. This template can be used to pitch topics like identify data, training model, test model, deep learning algorithm. In addition, this PPT design contains high-resolution images, graphics, etc, that are easily editable and available for immediate download.


Slide 1 of 2
Presenting key skills for statistical analyst with data visualization ppt powerpoint presentation gallery elements pdf. to dispense important information. This template comprises six stages. It also presents valuable insights into the topics including machine, learning, statistical skills analyst, testing skills, analytical tools, knowledge. This is a completely customizable PowerPoint theme that can be put to use immediately. So, download it and address the topic impactfully.


Slide 1 of 2
Showcasing this set of slides titled marketing automation stack model with data visualization ppt powerpoint presentation file show pdf. The topics addressed in these templates are analysis, communicating, optimizing. All the content presented in this PPT design is completely editable. Download it and make adjustments in color, background, font etc. as per your unique business setting.


Slide 1 of 2
Presenting this set of slides with name online marketing assessment with data visualization ppt powerpoint presentation gallery background images pdf. The topics discussed in these slides are strategy, data analysis, optimization. This is a completely editable PowerPoint presentation and is available for immediate download. Download now and impress your audience.


Slide 1 of 2
Presenting this set of slides with name theoretical perspective on media and technology with data visualization ppt powerpoint presentation file background image pdf. This is a three stage process. The stages in this process are methodology, visualization, criteria. This is a completely editable PowerPoint presentation and is available for immediate download. Download now and impress your audience.


Slide 1 of 2
Presenting this set of slides with name stages of marketing reasearch with data visualization ppt powerpoint presentation styles ideas pdf. This is a six stage process. The stages in this process are define the objective, gather data, analyze your data, visualize your data, interpretation your result. This is a completely editable PowerPoint presentation and is available for immediate download. Download now and impress your audience.


Slide 1 of 2
Presenting this set of slides with name ratio plot graph for data visualization ppt powerpoint presentation ideas outfit pdf. The topics discussed in these slides are ratio, value, days. This is a completely editable PowerPoint presentation and is available for immediate download. Download now and impress your audience.


Slide 1 of 2
Presenting this set of slides with name financial graph for data visualization ppt powerpoint presentation slides picture pdf. The topics discussed in these slides are mean ration, year. This is a completely editable PowerPoint presentation and is available for immediate download. Download now and impress your audience.
SHOW
- 60
- 120
- 180
DISPLAYING: 60 of 120 Item(s)
Page
