AI PPT Maker
Templates
PPT Bundles
Design Services
Business PPTs
Business Plan
Management
Strategy
Introduction PPT
Roadmap
Self Introduction
Timelines
Process
Marketing
Agenda
Technology
Medical
Startup Business Plan
Cyber Security
Dashboards
SWOT
Proposals
Education
Pitch Deck
Digital Marketing
KPIs
Project Management
Product Management
Artificial Intelligence
Target Market
Communication
Supply Chain
Google Slides
Research Services
 One Pagers
All Categories
Average activity PowerPoint Presentation Templates and Google Slides
5 Item(s)


Slide 1 of 2
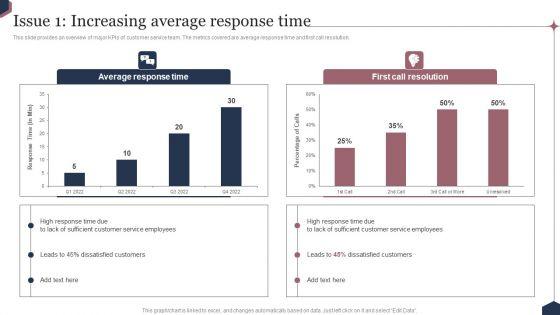
This slide provides an overview of major KPIs of customer service team. The metrics covered are average response time and first call resolution. Slidegeeks is here to make your presentations a breeze with Enhance Customer Engagement Through After Sales Activities Issue 1 Increasing Average Response Time Information PDF With our easy to use and customizable templates, you can focus on delivering your ideas rather than worrying about formatting. With a variety of designs to choose from, you are sure to find one that suits your needs. And with animations and unique photos, illustrations, and fonts, you can make your presentation pop. So whether you are giving a sales pitch or presenting to the board, make sure to check out Slidegeeks first.


Slide 1 of 2
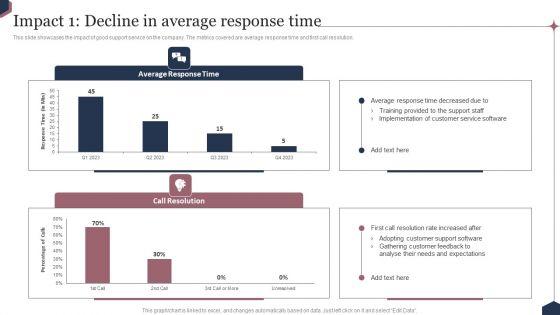
This slide showcases the impact of good support service on the company. The metrics covered are average response time and first call resolution. Get a simple yet stunning designed Enhance Customer Engagement Through After Sales Activities Impact 1 Decline In Average Response Time Pictures PDF. It is the best one to establish the tone in your meetings. It is an excellent way to make your presentations highly effective. So, download this PPT today from Slidegeeks and see the positive impacts. Our easy to edit Enhance Customer Engagement Through After Sales Activities Impact 1 Decline In Average Response Time Pictures PDF can be your go-to option for all upcoming conferences and meetings. So, what are you waiting for Grab this template today.
Slide 1 of 2
This slide provides information regarding essential DevOps activities management dashboard in terms of revenue by hour, storefront users, errors by host, response time by app, etc. Deliver and pitch your topic in the best possible manner with this devops activities management dashboard average icons pdf. Use them to share invaluable insights on devops activities management dashboard and impress your audience. This template can be altered and modified as per your expectations. So, grab it now.


Slide 1 of 2
Deliver an awe inspiring pitch with this creative inorganic growth business activity ratios average ppt pictures graphics pdf bundle. Topics like inventory turnover, receivables turnover can be discussed with this completely editable template. It is available for immediate download depending on the needs and requirements of the user.


Slide 1 of 2
Presenting this set of slides with name company amalgamation activity ratios average ppt show examples pdf. The topics discussed in these slides are inventory, receivables, sales. This is a completely editable PowerPoint presentation and is available for immediate download. Download now and impress your audience.
5 Item(s)
