- Sign up
- Sign In
 AI PPT Maker
 Templates
 PPT Bundles
 Design Services
 Business PPTs
 Business Plan
 Management
 Strategy
 Introduction PPT
 Roadmap
 Self Introduction
 Timelines
 Process
 Marketing
 Agenda
 Technology
 Medical
 Startup Business Plan
 Cyber Security
 Dashboards
 SWOT
SWOT Proposals
 Education
 Pitch Deck
 Digital Marketing
 KPIs
KPIs Project Management
 Product Management
 Artificial Intelligence
 Target Market
 Communication
 Supply Chain
 Google Slides
 Research Services
 One Pagers
 All Categories
Analytics visualization PowerPoint Presentation Templates and Google Slides
59 Item(s)


Presenting this set of slides with name visual analytics vector icon ppt powerpoint presentation visual aids show. This is a three stage process. The stages in this process are data visualization icon, research analysis, business focus. This is a completely editable PowerPoint presentation and is available for immediate download. Download now and impress your audience.


Presenting this set of slides with name sales analytics resources ppt powerpoint presentation gallery visuals cpb. This is an editable Powerpoint four stages graphic that deals with topics like sales analytics resources to help convey your message better graphically. This product is a premium product available for immediate download and is 100 percent editable in Powerpoint. Download this now and use it in your presentations to impress your audience.


Presenting this set of slides with name visual analytics tools ppt powerpoint presentation inspiration format cpb. This is an editable Powerpoint three stages graphic that deals with topics like visual analytics tools to help convey your message better graphically. This product is a premium product available for immediate download and is 100 percent editable in Powerpoint. Download this now and use it in your presentations to impress your audience.


Presenting this set of slides with name data analytics strategy ppt powerpoint presentation visual aids layouts cpb. This is a six stage process. The stages in this process are data analytics strategy. This is a completely editable PowerPoint presentation and is available for immediate download. Download now and impress your audience.


Presenting this set of slides with name competitive intelligence web analytics ppt powerpoint presentation slides visual aids cpb. The topics discussed in these slides are competitive intelligence web analytics. This is a completely editable PowerPoint presentation and is available for immediate download. Download now and impress your audience.


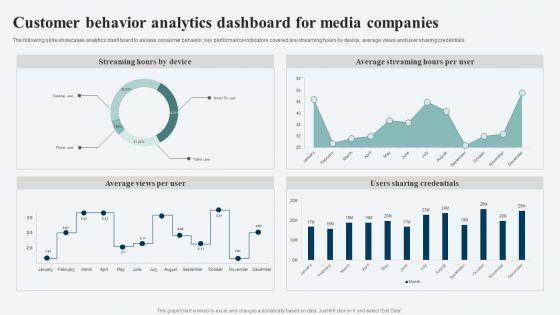

The following slide showcases analytics dashboard to assess consumer behavior. key performance indicators covered are streaming hours by device, average views and user sharing credentials. Showcasing this set of slides titled Customer Behavior Analytics Dashboard For Media Companies Ppt Ideas Visuals PDF. The topics addressed in these templates are Streaming Hours Device, Average Streaming Hours, Per User, Users Sharing Credentials. All the content presented in this PPT design is completely editable. Download it and make adjustments in color, background, font etc. as per your unique business setting.


This template depicts that intuitive search-driven analytics gives users an easy way to ask questions, receive suggestions on what to query, and visualize their data. Deliver an awe inspiring pitch with this creative Information Visualizations Playbook How To Overcome Search Driven Analytics Barriers Guidelines PDF bundle. Topics like Analytics System, Data And Insights, Search Driven Analytics can be discussed with this completely editable template. It is available for immediate download depending on the needs and requirements of the user.


This template depicts that with interactive BI visualization and predictive modeling in the same enterprise analytics platform, organizations can easily collaborate on initiatives that make recommended actions accessible to the business. Deliver and pitch your topic in the best possible manner with this Information Visualizations Playbook How To Bridge Business Intelligence And Predictive Analytics Challenges Themes PDF. Use them to share invaluable insights on Business Users, Operationalize Data Science, Num Devices and impress your audience. This template can be altered and modified as per your expectations. So, grab it now.


This slide provides information regarding cognitive analytics architecture representing different layers such as physical data layer, physical hardware layer, hardware abstraction layer, low - level data services layer. Deliver and pitch your topic in the best possible manner with this Cognitive Visualizations Computing Strategy Addressing Cognitive Analytics Contd Introduction PDF. Use them to share invaluable insights on Physical Data Layer, Physical Hardware, Hardware Abstraction and impress your audience. This template can be altered and modified as per your expectations. So, grab it now.


Pitch your topic with ease and precision using this Visual Analytical KPI Dashboard For Data Warehouse Template PDF This layout presents information on Machine Learning Based, Volume Change, Revenue Change It is also available for immediate download and adjustment. So, changes can be made in the color, design, graphics or any other component to create a unique layout.


This slide represents the data visualization with an augmented analytics dashboard covering sales, spending per customer, gross profit, unique customers, unique purchase, and gross profit. Deliver an awe inspiring pitch with this creative Augmented Analytics Implementation IT Data Visualization With Augmented Analytics Microsoft PDF bundle. Topics like Category Contribution, Category Year To Year Growth, Top Products, Sales, Gross Profit can be discussed with this completely editable template. It is available for immediate download depending on the needs and requirements of the user.


This slide shows visual analytics, the last branch of visualization research, which emerged from the advancements in the other two branches and mainly focused on analytical reasoning.Presenting Departments Of Visualization Research Visual Analytics Branch Of Visualization Research Information PDF to provide visual cues and insights. Share and navigate important information on five stages that need your due attention. This template can be used to pitch topics like Information Visualization, Advancements In Scientific, Interactive Visual Interface In addtion, this PPT design contains high resolution images, graphics, etc, that are easily editable and available for immediate download.


Presenting acquiring big data analytics and visualization ideas pdf to dispense important information. This template comprises four stages. It also presents valuable insights into the topics including data sources, acquire, manage. This is a completely customizable PowerPoint theme that can be put to use immediately. So, download it and address the topic impactfully.


This slide defines the checklist for effective data science integration in business, and it includes an understanding of business requirements, compelling communication, and so on. Presenting checklist for effective data analytics integration in business resources ppt visual aids pdf to provide visual cues and insights. Share and navigate important information on six stages that need your due attention. This template can be used to pitch topics like resources, analysis. In addtion, this PPT design contains high resolution images, graphics, etc, that are easily editable and available for immediate download.


This slide depicts the tasks performed by a Database Administrator and skills that he should possess, such as backup and recovery, data modeling and design, and distributive computing. Presenting data analytics tasks and skills of database administrator ppt visual aids pdf to provide visual cues and insights. Share and navigate important information on six stages that need your due attention. This template can be used to pitch topics like data security, database systems, distributive computing, information. In addtion, this PPT design contains high resolution images, graphics, etc, that are easily editable and available for immediate download.


This slide shows visual analytics, the last branch of visualization research, which emerged from the advancements in the other two branches and mainly focused on analytical reasoning. This is a graphical representation of research it visual analytics branch background pdf template with various stages. Focus and dispense information on five stages using this creative set, that comes with editable features. It contains large content boxes to add your information on topics like visual analytics branch of visualization research. You can also showcase facts, figures, and other relevant content using this PPT layout. Grab it now.
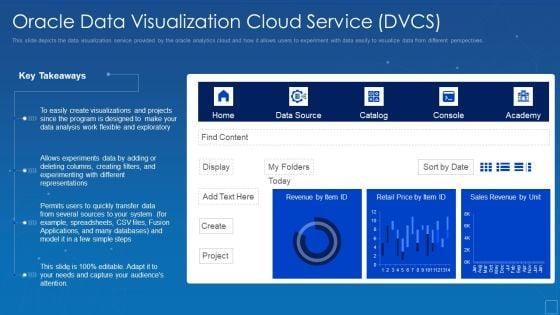
This slide depicts the data visualization service provided by the oracle analytics cloud and how it allows users to experiment with data easily to visualize data from different perspectives. Deliver an awe inspiring pitch with this creative oracle cloud data analytics administration it oracle data visualization cloud service dvcs inspiration pdf bundle. Topics like experiments, representations, sources, visualizations can be discussed with this completely editable template. It is available for immediate download depending on the needs and requirements of the user.


This slide represents the predictive analytics solution of the oracle analytics cloud and how it is helpful to predict outputs and display quickly with the help of ML. Deliver an awe inspiring pitch with this creative oracle analytics cloud solutions powerful data visualization template pdf bundle. Topics like oracle analytics cloud solutions powerful data visualization can be discussed with this completely editable template. It is available for immediate download depending on the needs and requirements of the user.


This slide represents the machine learning engineers tasks and skills, including a deep knowledge of machine learning, ML algorithms, and Python and C. This is a data analytics it tasks and skills of machine learning engineer ppt gallery visual aids pdf template with various stages. Focus and dispense information on six stages using this creative set, that comes with editable features. It contains large content boxes to add your information on topics like knowledge of machine learning, python, c plus, ml algorithms. You can also showcase facts, figures, and other relevant content using this PPT layout. Grab it now.


This slide shows the difference between Business Intelligence and Data Science based on the factors such as concept, scope, data, storage, procedure and tools. Deliver an awe inspiring pitch with this creative data analytics it business intelligence bi with data science ppt file visuals pdf bundle. Topics like concept, scope, data, storage, procedure, tools can be discussed with this completely editable template. It is available for immediate download depending on the needs and requirements of the user.


Presenting comparing two choices illustration for analytical database ppt powerpoint presentation file visual aids pdf to dispense important information. This template comprises two stages. It also presents valuable insights into the topics including comparing two choices illustration for analytical database. This is a completely customizable PowerPoint theme that can be put to use immediately. So, download it and address the topic impactfully.


Presenting duty list visual of predictive analytics promotions ppt powerpoint presentation outline layout ideas pdf to dispense important information. This template comprises three stages. It also presents valuable insights into the topics including duty list visual of predictive analytics promotions. This is a completely customizable PowerPoint theme that can be put to use immediately. So, download it and address the topic impactfully.


Presenting 3 overlapping circles visual for accounts receivable data analytics ppt powerpoint presentation gallery background pdf to dispense important information. This template comprises three stages. It also presents valuable insights into the topics including 3 overlapping circles visual for accounts receivable data analytics. This is a completely customizable PowerPoint theme that can be put to use immediately. So, download it and address the topic impactfully.


Presenting stages of new product design with business analytics ppt powerpoint presentation file visual aids pdf to dispense important information. This template comprises eight stages. It also presents valuable insights into the topics including idea generation, screening of ideas, testing the concept. This is a completely customizable PowerPoint theme that can be put to use immediately. So, download it and address the topic impactfully.


This is a healthcare management healthcare management data analytics architecture ppt file visuals pdf template with various stages. Focus and dispense information on two stages using this creative set, that comes with editable features. It contains large content boxes to add your information on topics like line of business, external sources, management, performance improvement, financial management. You can also showcase facts, figures, and other relevant content using this PPT layout. Grab it now.


This is a nursing administration healthcare management data analytics architecture ppt visual aids pictures pdf template with various stages. Focus and dispense information on two stages using this creative set, that comes with editable features. It contains large content boxes to add your information on topics like line of business, external sources, management, performance improvement, financial management. You can also showcase facts, figures, and other relevant content using this PPT layout. Grab it now.


Presenting cover letter for site analytic and audit proposal ppt slides visual aids pdf to provide visual cues and insights. Share and navigate important information on one stages that need your due attention. This template can be used to pitch topics like cover letter. In addtion, this PPT design contains high resolution images, graphics, etc, that are easily editable and available for immediate download.


Deliver an awe inspiring pitch with this creative timeframe for site analytic and audit proposal template ppt infographic template visuals pdf bundle. Topics like discovery or kick off meeting, research and audit, present strategy can be discussed with this completely editable template. It is available for immediate download depending on the needs and requirements of the user.


Deliver an awe inspiring pitch with this creative analytics where does big data come from ppt visual aids styles pdf bundle. Topics like transactions, log data, social media can be discussed with this completely editable template. It is available for immediate download depending on the needs and requirements of the user.
Presenting this set of slides with name business visual analytics vector icon ppt powerpoint presentation pictures background pdf. This is a three stage process. The stages in this process are business visual analytics vector icon. This is a completely editable PowerPoint presentation and is available for immediate download. Download now and impress your audience.


Presenting this set of slides with name visual health plan trends analytics ppt powerpoint presentation inspiration slideshow cpb pdf. This is an editable Powerpoint six stages graphic that deals with topics like visual health plan trends analytics to help convey your message better graphically. This product is a premium product available for immediate download and is 100 percent editable in Powerpoint. Download this now and use it in your presentations to impress your audience.


Presenting this set of slides with name web analytics trends ppt powerpoint presentation layouts visual aids cpb pdf. This is an editable Powerpoint six stages graphic that deals with topics like web analytics trends to help convey your message better graphically. This product is a premium product available for immediate download and is 100 percent editable in Powerpoint. Download this now and use it in your presentations to impress your audience.


Presenting this set of slides with name operational analytics use cases ppt powerpoint presentation professional visual aids cpb pdf. This is an editable Powerpoint one stages graphic that deals with topics like operational analytics use cases to help convey your message better graphically. This product is a premium product available for immediate download and is 100 percent editable in Powerpoint. Download this now and use it in your presentations to impress your audience.


Presenting this set of slides with name monitoring analytics ppt powerpoint presentation visual aids inspiration cpb. This is an editable Powerpoint four stages graphic that deals with topics like monitoring analytics to help convey your message better graphically. This product is a premium product available for immediate download and is 100 percent editable in Powerpoint. Download this now and use it in your presentations to impress your audience.


Presenting this set of slides with name data visualization in business analytics ppt powerpoint presentation portfolio file formats. This is a three stage process. The stages in this process are data visualization, business analytics. This is a completely editable PowerPoint presentation and is available for immediate download. Download now and impress your audience.


Presenting this set of slides with name data visualization techniques data analytics ppt powerpoint presentation outline clipart images cpb. This is an editable Powerpoint six stages graphic that deals with topics like data visualization techniques data analytics to help convey your message better graphically. This product is a premium product available for immediate download and is 100 percent editable in Powerpoint. Download this now and use it in your presentations to impress your audience.


This slide shows visual analytics, the last branch of visualization research, which emerged from the advancements in the other two branches and mainly focused on analytical reasoning. Want to ace your presentation in front of a live audience Our Branches For Visual Analytics Branch Of Visualization Research And Development Slides PDF can help you do that by engaging all the users towards you. Slidegeeks experts have put their efforts and expertise into creating these impeccable powerpoint presentations so that you can communicate your ideas clearly. Moreover, all the templates are customizable, and easy-to-edit and downloadable. Use these for both personal and commercial use.


This slide shows visual analytics, the last branch of visualization research, which emerged from the advancements in the other two branches and mainly focused on analytical reasoning. Make sure to capture your audiences attention in your business displays with our gratis customizable Data And Information Visualization Visual Analytics Branch Of Visualization Research Designs PDF. These are great for business strategies, office conferences, capital raising or task suggestions. If you desire to acquire more customers for your tech business and ensure they stay satisfied, create your own sales presentation with these plain slides.


This slide defines the framework for adopting changes based on the analysis conducted by the organization. It includes information related to identifying specific areas that require change and implementing the change .Presenting Analytics Based Change Acceptance Model In Organization Ppt PowerPoint Presentation Infographics Visual Aids PDF to dispense important information. This template comprises three stages. It also presents valuable insights into the topics including Adoption Analytics, Designing Change, Measuring Assessment. This is a completely customizable PowerPoint theme that can be put to use immediately. So, download it and address the topic impactfully.


This template illustrates that the high performance computation engine of the analytics software company, the data platform connects to various data sources, automates the data preparation workflow, and scales to big data scenarios. Deliver an awe inspiring pitch with this creative Information Visualizations Playbook How To Overcome Analytics From All The Data At Scale Challenges Mockup PDF bundle. Topics like Purchases, Marketing, Data Pipeline can be discussed with this completely editable template. It is available for immediate download depending on the needs and requirements of the user.


Deliver an awe inspiring pitch with this creative Information Visualizations Playbook Data Management Framework After Data Analytics Solution Formats PDF bundle. Topics like Data Discovery, Data Sharing, Data Harmonization can be discussed with this completely editable template. It is available for immediate download depending on the needs and requirements of the user.


This template depicts that the big data under control is a significant challenge for businesses. It also illustrates that Organizations need for data and analytics has exceeded the volume of insights that companies can currently generate. Presenting Information Visualizations Playbook The Problem With Todays BI Projects Data Analytics Playbook Portrait PDF to provide visual cues and insights. Share and navigate important information on five stages that need your due attention. This template can be used to pitch topics like Business Users, Specialized Data Analysts, Data Driven Insights. In addtion, this PPT design contains high resolution images, graphics, etc, that are easily editable and available for immediate download.


This template covers the facts about bigdata, business intelligence and data analytics. It also depicts that enterprise data and analytics solutions will drive growth and revenue, when optimized for different businesses. This is a Information Visualizations Playbook The Escalating Value Of Data And Analytics Portrait PDF template with various stages. Focus and dispense information on eight stages using this creative set, that comes with editable features. It contains large content boxes to add your information on topics like Data Driven Organizations, Acquire New Customers, Profitable. You can also showcase facts, figures, and other relevant content using this PPT layout. Grab it now.


This template covers the data analytics company final thoughts at the end of the e book. Presenting Information Visualizations Playbook Final Thoughts For Data Analytics Playbook Pictures PDF to provide visual cues and insights. Share and navigate important information on five stages that need your due attention. This template can be used to pitch topics like Organization, Business Insights, Growth. In addtion, this PPT design contains high resolution images, graphics, etc, that are easily editable and available for immediate download.


This template covers the problems while implementing BI and predictive analytics in the organization. The challenges are undefined KPIs and metrics, and unable to hire right data science talent. Presenting Information Visualizations Playbook Business Intelligence And Predictive Analytics Challenges Icons PDF to provide visual cues and insights. Share and navigate important information on two stages that need your due attention. This template can be used to pitch topics like Raw Data Organized, Security Vulnerabilities, Perform Analysis. In addtion, this PPT design contains high resolution images, graphics, etc, that are easily editable and available for immediate download.


This template covers the problems while implementing analytics from all the data, at scale in the organization. The challenges are large and complex data and analytic slowdown. Presenting Information Visualizations Playbook Analytics From All The Data At Scale Challenges Structure PDF to provide visual cues and insights. Share and navigate important information on two stages that need your due attention. This template can be used to pitch topics like Complex Data, Analytic Slowdown. In addtion, this PPT design contains high resolution images, graphics, etc, that are easily editable and available for immediate download.
59 Item(s)