- Sign up
- Sign In
 AI PPT Maker
 Templates
 PPT Bundles
 Design Services
 Business PPTs
 Business Plan
 Management
 Strategy
 Introduction PPT
 Roadmap
 Self Introduction
 Timelines
 Process
 Marketing
 Agenda
 Technology
 Medical
 Startup Business Plan
 Cyber Security
 Dashboards
 SWOT
SWOT Proposals
 Education
 Pitch Deck
 Digital Marketing
 KPIs
KPIs Project Management
 Product Management
 Artificial Intelligence
 Target Market
 Communication
 Supply Chain
 Google Slides
 Research Services
 One Pagers
 All Categories
Analytics kpi dashboard PowerPoint Presentation Templates and Google Slides
52 Item(s)


The following slide depicts paid advertisement campaign management dashboard to evaluate campaign success and facilitate investment decisions. It includes elements such as impressions, cost, clicks, cost per click, performance metrics by source etc. There are so many reasons you need a Guide For Marketing Analytics To Improve Decisions Paid Ad Campaign Performance Assessment KPI Dashboard Microsoft PDF. The first reason is you cannot spend time making everything from scratch, Thus, Slidegeeks has made presentation templates for you too. You can easily download these templates from our website easily.


The following slide depicts email campaign performance analytical dashboard to connect with audience and gather real time insights. It includes elements such as emails sent, unique subscribers, opens, clicks, investment and revenue by campaign type etc. Create an editable Guide For Marketing Analytics To Improve Decisions Email Campaign Performance Evaluation KPI Dashboard Summary PDF that communicates your idea and engages your audience. Whether youre presenting a business or an educational presentation, pre designed presentation templates help save time. Guide For Marketing Analytics To Improve Decisions Email Campaign Performance Evaluation KPI Dashboard Summary PDF is highly customizable and very easy to edit, covering many different styles from creative to business presentations. Slidegeeks has creative team members who have crafted amazing templates. So, go and get them without any delay.


The following slide outlines key performance indicator KPI dashboard that can assist marketers to evaluate brand performance on social media channels. The metrics covered are age group, gender, brand perception, branding themes, celebrity analysis, etc. Take your projects to the next level with our ultimate collection of Brand Analytics KPI Dashboard For Organization Ppt PowerPoint Presentation Diagram PDF. Slidegeeks has designed a range of layouts that are perfect for representing task or activity duration, keeping track of all your deadlines at a glance. Tailor these designs to your exact needs and give them a truly corporate look with your own brand colors they will make your projects stand out from the rest.


The following slide outlines key performance indicator KPI dashboard that can assist marketers to evaluate brand performance on social media channels. The metrics covered are age group, gender, brand perception, branding themes, celebrity analysis, etc. Present like a pro with Market Analysis Overview And Different Categories Brand Analytics Kpi Dashboard For Organization Rules PDF Create beautiful presentations together with your team, using our easy to use presentation slides. Share your ideas in real time and make changes on the fly by downloading our templates. So whether you are in the office, on the go, or in a remote location, you can stay in sync with your team and present your ideas with confidence. With Slidegeeks presentation got a whole lot easier. Grab these presentations today.


In this business intelligence dashboard is displayed to help company in real time monitoring and reporting of relevant details. It includes KPIs such as visits, average session duration, bounce rate, page views, traffic sources, etc. Showcasing this set of slides titled Business Intelligence And Web Analytics Dashboard To Track Marketing Kpis Inspiration PDF. The topics addressed in these templates are Goal Conversion, Track Marketing Kpis, Web Analytics Dashboard. All the content presented in this PPT design is completely editable. Download it and make adjustments in color, background, font etc. as per your unique business setting.


The following slide outlines key performance indicator KPI dashboard that can assist marketers to evaluate brand performance on social media channels. The metrics covered are age group, gender, brand perception, branding themes, celebrity analysis, etc. Boost your pitch with our creative Creating Positioning Techniques For Market Research Brand Analytics Kpi Dashboard For Organization Slides PDF. Deliver an awe-inspiring pitch that will mesmerize everyone. Using these presentation templates you will surely catch everyones attention. You can browse the ppts collection on our website. We have researchers who are experts at creating the right content for the templates. So you do not have to invest time in any additional work. Just grab the template now and use them.


The following slide outlines key performance indicator KPI dashboard that can assist marketers to evaluate brand performance on social media channels. The metrics covered are age group, gender, brand perception, branding themes, celebrity analysis, etc. Do you have an important presentation coming up Are you looking for something that will make your presentation stand out from the rest Look no further than Market Research Assessment Of Target Market Requirements Brand Analytics Kpi Dashboard For Organization Clipart PDF. With our professional designs, you can trust that your presentation will pop and make delivering it a smooth process. And with Slidegeeks, you can trust that your presentation will be unique and memorable. So why wait Grab Market Research Assessment Of Target Market Requirements Brand Analytics Kpi Dashboard For Organization Clipart PDF today and make your presentation stand out from the rest.


Following slide demonstrates dashboard for tracking financial data which can be used by organisation for effective cashflow management. It includes key elements such as total expenses and incomes, monthly expenses and income, actual and estimated expense and income list. Showcasing this set of slides titled KPI Dashboard For Business Big Financial Data Analytics Diagrams PDF. The topics addressed in these templates are KPI Dashboard, Business Big Financial, Data Analytics. All the content presented in this PPT design is completely editable. Download it and make adjustments in color, background, font etc. as per your unique business setting.


The slide depicts the dashboard of recruitment analytics monitoring depicting candidate by source, candidate workflow, candidate status, new application, application source vs hired and reasons for decline. Do you have to make sure that everyone on your team knows about any specific topic I yes, then you should give KPI Dashboard For Monitoring Recruitment Analytics Professional PDF a try. Our experts have put a lot of knowledge and effort into creating this impeccable KPI Dashboard For Monitoring Recruitment Analytics Professional PDF. You can use this template for your upcoming presentations, as the slides are perfect to represent even the tiniest detail. You can download these templates from the Slidegeeks website and these are easy to edit. So grab these today.


The following slide exhibits detailed view of companys revenue-related website metrics. It helps in determining initiatives and areas for organisational improvement. It includes information about visitors, gross volume, etc. Pitch your topic with ease and precision using this KPI Dashboard For Marketing Website Analytics Summary PDF. This layout presents information on Visitors, Leads, Qualified Leads, Customers, Gross Volume, Successful Payment. It is also available for immediate download and adjustment. So, changes can be made in the color, design, graphics or any other component to create a unique layout.
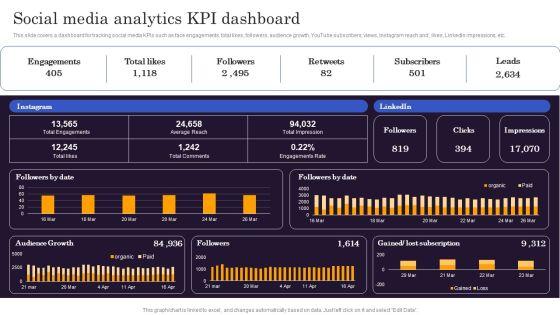

This slide covers a dashboard for tracking social media KPIs such as face engagements, total likes, followers, audience growth, YouTube subscribers, views, Instagram reach and , likes, LinkedIn impressions, etc. Find a pre designed and impeccable Marketers Guide To Data Analysis Optimization Social Media Analytics KPI Dashboard Clipart PDF. The templates can ace your presentation without additional effort. You can download these easy to edit presentation templates to make your presentation stand out from others. So, what are you waiting for Download the template from Slidegeeks today and give a unique touch to your presentation.
This slide covers the KPI dashboard for analyzing SEO metrics such as authority score, organic traffic, organic keywords, paid keywords, ref. Domains, site audit, link-building tool, organic traffic, on-page SEO checker, backlink audit, etc. This Marketers Guide To Data Analysis Optimization KPI Dashboard For Tracking SEO Analytics Template PDF from Slidegeeks makes it easy to present information on your topic with precision. It provides customization options, so you can make changes to the colors, design, graphics, or any other component to create a unique layout. It is also available for immediate download, so you can begin using it right away. Slidegeeks has done good research to ensure that you have everything you need to make your presentation stand out. Make a name out there for a brilliant performance.


This slide represents the dashboard representing key metrics to analyze the performance of overall workforce. It includes details related to absence rate, benefits satisfaction, engagement index etc. Here you can discover an assortment of the finest PowerPoint and Google Slides templates. With these templates, you can create presentations for a variety of purposes while simultaneously providing your audience with an eye-catching visual experience. Download Tools For HR Business Analytics Workforce Performance Analysis KPI Dashboard Pictures PDF to deliver an impeccable presentation. These templates will make your job of preparing presentations much quicker, yet still, maintain a high level of quality. Slidegeeks has experienced researchers who prepare these templates and write high-quality content for you. Later on, you can personalize the content by editing the Tools For HR Business Analytics Workforce Performance Analysis KPI Dashboard Pictures PDF.
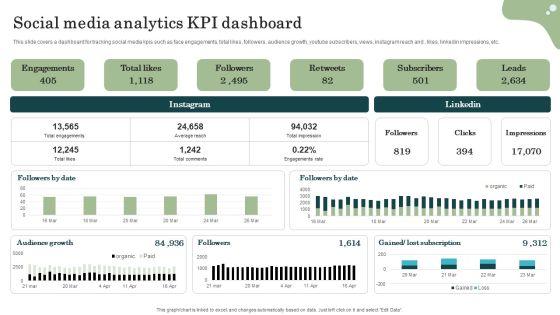
This slide covers a dashboard for tracking social media kpis such as face engagements, total likes, followers, audience growth, youtube subscribers, views, instagram reach and , likes, linkedin impressions, etc. Find a pre-designed and impeccable Marketing Success Metrics Social Media Analytics KPI Dashboard Elements PDF. The templates can ace your presentation without additional effort. You can download these easy-to-edit presentation templates to make your presentation stand out from others. So, what are you waiting for Download the template from Slidegeeks today and give a unique touch to your presentation.
This slide covers the KPI dashboard for analyzing SEO metrics such as authority score, organic traffic, organic keywords, paid keywords, ref. Domains, site audit, link-building tool, organic traffic, on-page SEO checker, backlink audit, etc. This Marketing Success Metrics KPI Dashboard For Tracking Seo Analytics Background PDF from Slidegeeks makes it easy to present information on your topic with precision. It provides customization options, so you can make changes to the colors, design, graphics, or any other component to create a unique layout. It is also available for immediate download, so you can begin using it right away. Slidegeeks has done good research to ensure that you have everything you need to make your presentation stand out. Make a name out there for a brilliant performance.
This slide covers a dashboard for analysing the metrics of the website landing page. It includes KPIs such as conversions, conversion rate, sessions, bounce rate, engagement sickness, etc. Do you have an important presentation coming up Are you looking for something that will make your presentation stand out from the rest Look no further than Optimizing Marketing Analytics To Enhance Organizational Growth Website Landing Page KPI Tracking Dashboard Graphics PDF. With our professional designs, you can trust that your presentation will pop and make delivering it a smooth process. And with Slidegeeks, you can trust that your presentation will be unique and memorable. So why wait Grab Optimizing Marketing Analytics To Enhance Organizational Growth Website Landing Page KPI Tracking Dashboard Graphics PDF today and make your presentation stand out from the rest.
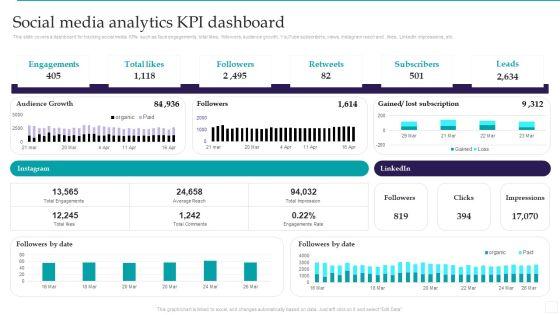
This slide covers a dashboard for tracking social media KPIs such as face engagements, total likes, followers, audience growth, YouTube subscribers, views, Instagram reach and , likes, LinkedIn impressions, etc. From laying roadmaps to briefing everything in detail, our templates are perfect for you. You can set the stage with your presentation slides. All you have to do is download these easy to edit and customizable templates. Optimizing Marketing Analytics To Enhance Organizational Growth Social Media Analytics KPI Dashboard Graphics PDF will help you deliver an outstanding performance that everyone would remember and praise you for. Do download this presentation today.
This slide covers the dashboard for analysing paid search metrics such as ad cost, clicks, impressions, click-through rate, cost per conversion, conversion rate, cost per click, etc. Do you have to make sure that everyone on your team knows about any specific topic I yes, then you should give Optimizing Marketing Analytics To Enhance Organizational Growth KPI Dashboard For Tracking Inspiration PDF a try. Our experts have put a lot of knowledge and effort into creating this impeccable Optimizing Marketing Analytics To Enhance Organizational Growth KPI Dashboard For Tracking Inspiration PDF. You can use this template for your upcoming presentations, as the slides are perfect to represent even the tiniest detail. You can download these templates from the Slidegeeks website and these are easy to edit. So grab these today.
This slide covers the KPI dashboard for analyzing SEO metrics such as authority score, organic traffic, organic keywords, paid keywords, ref. Domains, site audit, link-building tool, organic traffic, on-page SEO checker, backlink audit, etc. There are so many reasons you need a Optimizing Marketing Analytics To Enhance Organizational Growth KPI Dashboard For Tracking Paid Ad Campaign Template PDF. The first reason is you can not spend time making everything from scratch, Thus, Slidegeeks has made presentation templates for you too. You can easily download these templates from our website easily.


The following slide outlines key performance indicator KPI dashboard that can assist marketers to evaluate brand performance on social media channels. The metrics covered are age group, gender, brand perception, branding themes, celebrity analysis, etc. From laying roadmaps to briefing everything in detail, our templates are perfect for you. You can set the stage with your presentation slides. All you have to do is download these easy-to-edit and customizable templates. Comprehensive Market Research Guide Brand Analytics Kpi Dashboard For Organization Brochure PDF will help you deliver an outstanding performance that everyone would remember and praise you for. Do download this presentation today.


This slide shows the dashboard representing data related to human resource operations of the enterprise. It includes key metrics such as vacant positions, YTD personal expenses etc. There are so many reasons you need a Analyzing And Deploying HR Analytics Software Kpi Dashboard Information PDF. The first reason is you cant spend time making everything from scratch, Thus, Slidegeeks has made presentation templates for you too. You can easily download these templates from our website easily.
This slide represents the KPI dashboard to track the multiple cost associated with supply chain in food manufacturing industry. It includes information regarding cash to cash cycle in days, carry cost of inventory along with details of net sales. There are so many reasons you need a Food Processing Industry Latest Insights Trends And Analytics KPI Dashboard For Tracking Supply Chain Costs Demonstration PDF. The first reason is you can not spend time making everything from scratch, Thus, Slidegeeks has made presentation templates for you too. You can easily download these templates from our website easily.


This slide elaborates about the number of incidents that have taken place in cyber security and the malware types with per incident. It also includes the number of open and resolved ticked. Showcasing this set of slides titled Information Technology Security Team Analytics Dashboard With KPI Themes PDF. The topics addressed in these templates are Open Incidents, Resolved Incidents, Open Tickets, Resolved Tickets. All the content presented in this PPT design is completely editable. Download it and make adjustments in color, background, font etc. as per your unique business setting.


This slide represents the dashboard representing key metrics to analyze the performance of overall workforce. It includes details related to absence rate, benefits satisfaction, engagement index etc. Find a pre-designed and impeccable Human Resource Analytics Workforce Performance Analysis KPI Dashboard Structure PDF. The templates can ace your presentation without additional effort. You can download these easy-to-edit presentation templates to make your presentation stand out from others. So, what are you waiting for Download the template from Slidegeeks today and give a unique touch to your presentation.


This slide represents the dashboard representing key metrics to analyze the performance of overall workforce. It includes details related to absence rate, benefits satisfaction, engagement index etc. Take your projects to the next level with our ultimate collection of Business Analytics Application Workforce Performance Analysis KPI Dashboard Template PDF. Slidegeeks has designed a range of layouts that are perfect for representing task or activity duration, keeping track of all your deadlines at a glance. Tailor these designs to your exact needs and give them a truly corporate look with your own brand colors theyll make your projects stand out from the rest.


This slide illustrates construction dashboard for improving capital project outcomes. It also include KPIs such as projects completion, schedule performance index, consumer price index, project status, cost breakdown, etc. Pitch your topic with ease and precision using this Investment Project KPI Dashboard For Construction Analytics Background PDF. This layout presents information on Cost Breakdown, Completion, Progress. It is also available for immediate download and adjustment. So, changes can be made in the color, design, graphics or any other component to create a unique layout.
The following slide shows cyber analytics dashboard to monitor and inspect threats and accordingly plan preventive actions. It includes open and resolved incidents and tickets. Pitch your topic with ease and precision using this Cyber Security Team Analytics Dashboard With KPI Metrics Icons PDF. This layout presents information on Energy Security Team, Digital Security Center, Security Operations Center. It is also available for immediate download and adjustment. So, changes can be made in the color, design, graphics or any other component to create a unique layout.


This slide shows the KPI dashboard to track performance of mobile search engine optimization analytics. It covers KPIs such as Google ranking, site check, sessions, etc. Showcasing this set of slides titled KPI Dashboard To Track Mobile Search Engine Optimization Analytics Performance Introduction PDF. The topics addressed in these templates are KPI Dashboard, Search Engine Optimization, Analytics Performance. All the content presented in this PPT design is completely editable. Download it and make adjustments in color, background, font etc. as per your unique business setting.


Showcasing this set of slides titled Survey Response Results KPI Analytics Dashboard On Personal Finances Guidelines PDF. The topics addressed in these templates are Current Financial, Personal Finance, Obstacles Increase. All the content presented in this PPT design is completely editable. Download it and make adjustments in color, background, font etc. as per your unique business setting.


The following slide presents KPI dashboard to analyse employee task and their contributions. It includes elements such as absenteeism rate, overtime hours, learning and development cost etc. Showcasing this set of slides titled People Centric Work Cuture Analytics Kpi Dashboard Brochure PDF. The topics addressed in these templates are Development Cost, Overall Labor Effectiveness, Absenteeism. All the content presented in this PPT design is completely editable. Download it and make adjustments in color, background, font etc. as per your unique business setting.


The following slide depicts the KPAs of LinkedIn marketing to evaluate marketing effectiveness. It includes elements such as impressions, actions, link clicks, organic and inorganic followers etc. Showcasing this set of slides titled Linkedin Marketing Analytics With KPI Dashboard Ppt PowerPoint Presentation File Inspiration PDF. The topics addressed in these templates are Total Impressions, Total Connections, Inorganic Followers Added. All the content presented in this PPT design is completely editable. Download it and make adjustments in color, background, font etc. as per your unique business setting.


The below slide provides an insights to various KPAs of HR analytics. It includes elements such as extra time worked, leave hours, job order wise workforce expenses, expected versus actual hours etc. Showcasing this set of slides titled HR Analytical Workforce Administration Kpi Dashboard Introduction PDF. The topics addressed in these templates are Workforce Expenses, Administration KPI Dashboard. All the content presented in this PPT design is completely editable. Download it and make adjustments in color, background, font etc. as per your unique business setting.


Pitch your topic with ease and precision using this Visual Analytical KPI Dashboard For Data Warehouse Template PDF This layout presents information on Machine Learning Based, Volume Change, Revenue Change It is also available for immediate download and adjustment. So, changes can be made in the color, design, graphics or any other component to create a unique layout.


Mentioned slide outlines a comprehensive KPI dashboard highlighting web page results using XYZ analytics tool. The key performance indicators kpis mentioned in the slide are visits, page views, average visit duration, bounce rate, etc. Pitch your topic with ease and precision using this kpi dashboard showing web traffic results using analytical techniques inspiration pdf. This layout presents information on bounce rate, traffic sources, analytics. It is also available for immediate download and adjustment. So, changes can be made in the color, design, graphics or any other component to create a unique layout.


Persuade your audience using this Service Level Agreement KPI Dashboard With Graph And Analytics Icon Inspiration PDF. This PPT design covers three stages, thus making it a great tool to use. It also caters to a variety of topics including Service Level, Agreement KPI Dashboard, Graph And Analytics, Icon. Download this PPT design now to present a convincing pitch that not only emphasizes the topic but also showcases your presentation skills.


Presenting Service Level Agreement KPI Dashboard Icon With Analytics And Interfaces Download PDF to dispense important information. This template comprises three stages. It also presents valuable insights into the topics including Service Level Agreement, KPI Dashboard Icon, Analytics And Interfaces. This is a completely customizable PowerPoint theme that can be put to use immediately. So, download it and address the topic impactfully.


The following slide highlights the transportation reporting and analytics dashboard illustrating total order on time pick up, on time delivery, delivery efficiency, shipment lead time, carrier details and address specific pick up, delivery and transit time reports. Presenting Logistics KPI Reporting And Analytics Dashboard Ppt Infographic Template Background PDF to dispense important information. This template comprises one stages. It also presents valuable insights into the topics including On Time Delivery, Total Order, Origin Locations. This is a completely customizable PowerPoint theme that can be put to use immediately. So, download it and address the topic impactfully.


Persuade your audience using this Logistics KPI Metrics And Analytics Dashboard Ppt Slides Images PDF. This PPT design covers four stages, thus making it a great tool to use. It also caters to a variety of topics including Logistics KPI, Metrics And Analytics, Dashboard. Download this PPT design now to present a convincing pitch that not only emphasizes the topic but also showcases your presentation skills.


The following slide outlines key performance indicator KPI dashboard that can assist marketers to evaluate brand performance on social media channels. The metrics covered are age group, gender, brand perception, branding themes, celebrity analysis, etc. Present like a pro with Steps To Effectively Conduct Market Research Brand Analytics KPI Dashboard For Organization Template PDF Create beautiful presentations together with your team, using our easy to use presentation slides. Share your ideas in real time and make changes on the fly by downloading our templates. So whether you are in the office, on the go, or in a remote location, you can stay in sync with your team and present your ideas with confidence. With Slidegeeks presentation got a whole lot easier. Grab these presentations today.


The following slide outlines key performance indicator KPI dashboard that can assist marketers to evaluate brand performance on social media channels. The metrics covered are age group, gender, brand perception, branding themes, celebrity analysis, etc. There are so many reasons you need a Market Research To Determine Business Opportunities Brand Analytics KPI Dashboard For Organization Inspiration PDF. The first reason is you cannot spend time making everything from scratch, Thus, Slidegeeks has made presentation templates for you too. You can easily download these templates from our website easily.


Following slide shows the key performance indicator KPI dashboard which will assist corporates to effectively monitor procurement process. The metrics are number of suppliers, contract compliance, average procurement cycle time, etc. Showcasing this set of slides titled KPI Analytics Dashboard With Sourcing Raw Material Cycle Time Inspiration PDF. The topics addressed in these templates are Kpi Analytics Dashboard, Sourcing Raw Material, Cycle Time. All the content presented in this PPT design is completely editable. Download it and make adjustments in color, background, font etc. as per your unique business setting.


Following slides show the dashboard of financial fraud analytics of organization which will assist in preventing a foreseeing frauds. This includes KPI such as clients alert, risk entity, etc. Pitch your topic with ease and precision using this Financial Scam Analytics KPI Dashboard Of Companies Clipart PDF. This layout presents information on Financial Scam Analytics, Kpi Dashboard Of Companies. It is also available for immediate download and adjustment. So, changes can be made in the color, design, graphics or any other component to create a unique layout.


Persuade your audience using this Vendor Performance KPI Analytical Dashboard Icon For Data Management Background PDF. This PPT design covers three stages, thus making it a great tool to use. It also caters to a variety of topics including Vendor Performance, KPI Analytical Dashboard, Icon Data Management. Download this PPT design now to present a convincing pitch that not only emphasizes the topic but also showcases your presentation skills.


This slide covers contact center reporting and analytics metrics dashboard. It involves metrics such as total unsuccessful calls, competence, activity, agent details and quality rate. Pitch your topic with ease and precision using this Call Center Kpis Reporting And Analytics Dashboard Download PDF. This layout presents information on Activity, Quality, Dashboard. It is also available for immediate download and adjustment. So, changes can be made in the color, design, graphics or any other component to create a unique layout.


This slide represents the data analytics dashboard for production manufacturing and management. It includes details related to KPIs such as rework quantity, labor cost, performance, overall equipment effectiveness etc. Showcasing this set of slides titled Product Manufacturing Data Analytics Kpis Dashboard Guidelines PDF. The topics addressed in these templates are Quantity, Rework Quantity, Manufacturing Cost, Labor Cot. All the content presented in this PPT design is completely editable. Download it and make adjustments in color, background, font etc. as per your unique business setting.


The following slide outlines key performance indicator KPI dashboard that can assist marketers to evaluate brand performance on social media channels. The metrics covered are age group, gender, brand perception, branding themes, celebrity analysis, etc. Boost your pitch with our creative Brand Analytics Kpi Dashboard For Organization Ppt Portfolio Graphics Design PDF. Deliver an awe inspiring pitch that will mesmerize everyone. Using these presentation templates you will surely catch everyones attention. You can browse the ppts collection on our website. We have researchers who are experts at creating the right content for the templates. So you do not have to invest time in any additional work. Just grab the template now and use them.
This slide covers a dashboard for analyzing the metrics of the website landing page. It includes KPIs such as conversions, conversion rate, sessions, bounce rate, engagement sickness, etc. If your project calls for a presentation, then Slidegeeks is your go to partner because we have professionally designed, easy to edit templates that are perfect for any presentation. After downloading, you can easily edit Online Marketing Analytics To Enhance Business Growth Website Landing Page KPI Tracking Dashboard Sample PDF and make the changes accordingly. You can rearrange slides or fill them with different images. Check out all the handy templates


This slide covers a dashboard for tracking social media KPIs such as face engagements, total likes, followers, audience growth, YouTube subscribers, views, Instagram reach and , likes, LinkedIn impressions, etc. Slidegeeks is here to make your presentations a breeze with Online Marketing Analytics To Enhance Business Growth Social Media Analytics KPI Dashboard Brochure PDF With our easy to use and customizable templates, you can focus on delivering your ideas rather than worrying about formatting. With a variety of designs to choose from, you are sure to find one that suits your needs. And with animations and unique photos, illustrations, and fonts, you can make your presentation pop. So whether you are giving a sales pitch or presenting to the board, make sure to check out Slidegeeks first.
This slide covers the KPI dashboard for analyzing SEO metrics such as authority score, organic traffic, organic keywords, paid keywords, ref. Domains, site audit, link-building tool, organic traffic, on-page SEO checker, backlink audit, etc. Get a simple yet stunning designed Online Marketing Analytics To Enhance Business Growth Kpi Dashboard For Tracking SEO Analytics Themes PDF. It is the best one to establish the tone in your meetings. It is an excellent way to make your presentations highly effective. So, download this PPT today from Slidegeeks and see the positive impacts. Our easy to edit Online Marketing Analytics To Enhance Business Growth Kpi Dashboard For Tracking SEO Analytics Themes PDF can be your go to option for all upcoming conferences and meetings. So, what are you waiting for Grab this template today.
This slide covers the dashboard for analyzing paid search metrics such as ad cost, clicks, impressions, click-through rate, cost per conversion, conversion rate, cost per click, etc. Do you have to make sure that everyone on your team knows about any specific topic I yes, then you should give Online Marketing Analytics To Enhance Business Growth Kpi Dashboard For Tracking Paid Ad Campaign Diagrams PDF a try. Our experts have put a lot of knowledge and effort into creating this impeccable Online Marketing Analytics To Enhance Business Growth Kpi Dashboard For Tracking Paid Ad Campaign Diagrams PDF. You can use this template for your upcoming presentations, as the slides are perfect to represent even the tiniest detail. You can download these templates from the Slidegeeks website and these are easy to edit. So grab these today.
This slide covers the dashboard for analyzing email marketing metrics such as overall open rate, click-through rate, click to open ratio, unsubscribe rate, hard bounce rate, soft rate, monthly open rate, total monthly subscribers, etc. There are so many reasons you need a Online Marketing Analytics To Enhance Business Growth Kpi Dashboard For Tracking Email Marketing Mockup PDF. The first reason is you cannot spend time making everything from scratch, Thus, Slidegeeks has made presentation templates for you too. You can easily download these templates from our website easily.
This slide covers the dashboard for analyzing blogging KPIs such as performance, published posts, views, new blog subscribers, top blog posts by pageviews, top blog posts by CTR, etc. Slidegeeks is one of the best resources for PowerPoint templates. You can download easily and regulate Online Marketing Analytics To Enhance Business Growth Dashboard For Tracking Business Blog Kpis Template PDF for your personal presentations from our wonderful collection. A few clicks is all it takes to discover and get the most relevant and appropriate templates. Use our Templates to add a unique zing and appeal to your presentation and meetings. All the slides are easy to edit and you can use them even for advertisement purposes.
52 Item(s)