- Sign up
- Sign In
 AI PPT Maker
 Templates
 PPT Bundles
 Design Services
 Business PPTs
 Business Plan
 Management
 Strategy
 Introduction PPT
 Roadmap
 Self Introduction
 Timelines
 Process
 Marketing
 Agenda
 Technology
 Medical
 Startup Business Plan
 Cyber Security
 Dashboards
 SWOT
SWOT Proposals
 Education
 Pitch Deck
 Digital Marketing
 KPIs
KPIs Project Management
 Product Management
 Artificial Intelligence
 Target Market
 Communication
 Supply Chain
 Google Slides
 Research Services
 One Pagers
 All Categories
Analytics activities PowerPoint Presentation Templates and Google Slides
16 Item(s)


Presenting you an exemplary Activity Flowchart For Big Analytics Project Proposal One Pager Sample Example Document. Our one-pager comprises all the must-have essentials of an inclusive document. You can edit it with ease, as its layout is completely editable. With such freedom, you can tweak its design and other elements to your requirements. Download this Activity Flowchart For Big Analytics Project Proposal One Pager Sample Example Document brilliant piece now.
This slide provides information regarding virtual agents essential activities dashboard in terms of daily number of new conversation, unique users weekly conversations by channel, etc. Do you know about Slidesgeeks Cognitive Analytics Strategy And Techniques Tracking Essential Virtual Agents Activities Dashboard Template PDF These are perfect for delivering any kind od presentation. Using it, create PowerPoint presentations that communicate your ideas and engage audiences. Save time and effort by using our pre designed presentation templates that are perfect for a wide range of topic. Our vast selection of designs covers a range of styles, from creative to business, and are all highly customizable and easy to edit. Download as a PowerPoint template or use them as Google Slides themes.
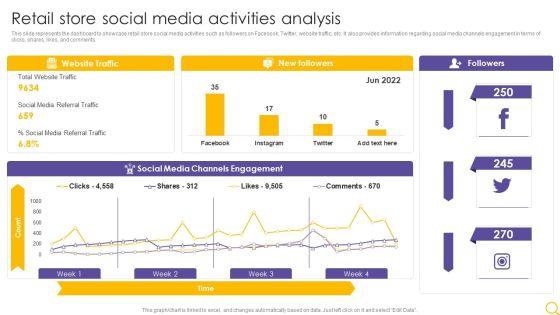
This slide represents the dashboard to showcase retail store social media activities such as followers on Facebook, Twitter, website traffic, etc. It also provides information regarding social media channels engagement in terms of clicks, shares, likes, and comments. Deliver an awe inspiring pitch with this creative Retail Outlet Operational Efficiency Analytics Retail Store Social Media Activities Analysis Portrait PDF bundle. Topics like Website Traffic, New Followers, Social Media Channels can be discussed with this completely editable template. It is available for immediate download depending on the needs and requirements of the user.


This slide shows the dashboard that depicts total number of employees including permanent, fixed contract and temporary with business unit distribution.Deliver an awe inspiring pitch with this creative Automating Key Activities Of HR Manager Dashboard Depicting HR Analytics Of Organization Themes PDF bundle. Topics like Business Distribution, Deliverance Team, Administration can be discussed with this completely editable template. It is available for immediate download depending on the needs and requirements of the user.
This slide portrays information regarding tracking essential activities in intelligence infrastructure dashboard in terms of IT operations, security, business analytics, internet of things, etc. Deliver an awe inspiring pitch with this creative Developing Business Analytics Framework Tracking Intelligence Infrastructure Activities Dashboard Brochure PDF bundle. Topics like Application Delivery, Business Analytics, Internet Of Things can be discussed with this completely editable template. It is available for immediate download depending on the needs and requirements of the user.


Deliver an awe inspiring pitch with this creative improving operational activities enterprise performance scoring and analytics guidelines pdf bundle. Topics like technology, services, information, costs, processes can be discussed with this completely editable template. It is available for immediate download depending on the needs and requirements of the user.


Deliver an awe inspiring pitch with this creative business activities assessment examples performance scoring and analytics demonstration pdf bundle. Topics like technology, vendors, business, processes, structure can be discussed with this completely editable template. It is available for immediate download depending on the needs and requirements of the user.


Introducing our predictive analytics three months roadmap with multiple activities elements. This PPT presentation is Google Slides compatible, therefore, you can share it easily with the collaborators for measuring the progress. Also, the presentation is available in both standard screen and widescreen aspect ratios. So edit the template design by modifying the font size, font type, color, and shapes as per your requirements. As this PPT design is fully editable it can be presented in PDF, JPG and PNG formats.


Introducing our predictive analytics six months roadmap with multiple activities topics. This PPT presentation is Google Slides compatible, therefore, you can share it easily with the collaborators for measuring the progress. Also, the presentation is available in both standard screen and widescreen aspect ratios. So edit the template design by modifying the font size, font type, color, and shapes as per your requirements. As this PPT design is fully editable it can be presented in PDF, JPG and PNG formats.


Introducing our predictive analytics quarterly roadmap with multiple activities ideas. This PPT presentation is Google Slides compatible, therefore, you can share it easily with the collaborators for measuring the progress. Also, the presentation is available in both standard screen and widescreen aspect ratios. So edit the template design by modifying the font size, font type, color, and shapes as per your requirements. As this PPT design is fully editable it can be presented in PDF, JPG and PNG formats.


Introducing our predictive analytics half yearly roadmap with multiple activities formats. This PPT presentation is Google Slides compatible, therefore, you can share it easily with the collaborators for measuring the progress. Also, the presentation is available in both standard screen and widescreen aspect ratios. So edit the template design by modifying the font size, font type, color, and shapes as per your requirements. As this PPT design is fully editable it can be presented in PDF, JPG and PNG formats.


Introducing our predictive analytics five years roadmap with multiple activities ideas. This PPT presentation is Google Slides compatible, therefore, you can share it easily with the collaborators for measuring the progress. Also, the presentation is available in both standard screen and widescreen aspect ratios. So edit the template design by modifying the font size, font type, color, and shapes as per your requirements. As this PPT design is fully editable it can be presented in PDF, JPG and PNG formats.


Showcasing this set of slides titled mobile analytics report with revenue and live activity ppt powerpoint presentation show templates pdf. The topics addressed in these templates are live activity, online users, revenue. All the content presented in this PPT design is completely editable. Download it and make adjustments in color, background, font etc. as per your unique business setting.


Presenting this set of slides with name data analytics for customer activity details ppt powerpoint presentation show graphics template pdf. The topics discussed in these slides are time period, total activity, avg per user, avg per active user. This is a completely editable PowerPoint presentation and is available for immediate download. Download now and impress your audience.


This slide highlights the Experian company revenue which includes the revenue by business activity B2B Data, B2B decisioning and consumer services and revenue by regions North America, Latin America, UK, Ireland and EMEA. Here you can discover an assortment of the finest PowerPoint and Google Slides templates. With these templates, you can create presentations for a variety of purposes while simultaneously providing your audience with an eye catching visual experience. Download Information Analytics Company Outline Revenue By Business Activity And Regions Clipart PDF to deliver an impeccable presentation. These templates will make your job of preparing presentations much quicker, yet still, maintain a high level of quality. Slidegeeks has experienced researchers who prepare these templates and write high quality content for you. Later on, you can personalize the content by editing the Information Analytics Company Outline Revenue By Business Activity And Regions Clipart PDF.
16 Item(s)