dashboard
Loyalty Program Performance Tracking Dashboard Topics PDF
This slide covers the KPI dashboard for analyzing customer loyalty campaign results. It includes metrics such as revenue, liability, NQP accrued, transaction count, members, redemption ratio, etc. Deliver an awe inspiring pitch with this creative Loyalty Program Performance Tracking Dashboard Topics PDF bundle. Topics like Loyalty Program Performance, Tracking Dashboard can be discussed with this completely editable template. It is available for immediate download depending on the needs and requirements of the user.
Referral Program Performance Tracking Dashboard Summary PDF
This slide covers the KPI dashboard for analyzing referral campaign results. It includes metrics such as total revenue generated, monthly recurring revenue, new customers, clicks, cancelled customers, paying customers, etc. Deliver and pitch your topic in the best possible manner with this Referral Program Performance Tracking Dashboard Summary PDF. Use them to share invaluable insights on Referral Program Performance, Tracking Dashboard and impress your audience. This template can be altered and modified as per your expectations. So, grab it now.

Dashboard For Tracking Website Performance Professional PDF
This slide covers the KPI dashboard for analyzing the company website. It includes metrics such as conversions, conversion rate, sessions, stickiness, bounce rate, engagement, etc. Deliver and pitch your topic in the best possible manner with this Dashboard For Tracking Website Performance Professional PDF. Use them to share invaluable insights on Dashboard For Tracking, Website Performance and impress your audience. This template can be altered and modified as per your expectations. So, grab it now.

Workforce Task Schedule Overview Dashboard Microsoft PDF
The slide showcases a dashboard giving a summary of monthly shift details of an employee. It shows shift board, time off, credentials, posted shifts, message board, etc.Pitch your topic with ease and precision using this Workforce Task Schedule Overview Dashboard Microsoft PDF. This layout presents information on Expiring Credentials, Dashboard, Credentials. It is also available for immediate download and adjustment. So, changes can be made in the color, design, graphics or any other component to create a unique layout.

Scrum Task Project Management Dashboard Information PDF
The following slide demonstrates scrum project task management dashboard. It includes information about sprint velocity, scope changes, tasks category, tasks progress, planned, finished, added, removed, bug, story, etc. Pitch your topic with ease and precision using this Scrum Task Project Management Dashboard Information PDF. This layout presents information on Scrum Task Project, Management Dashboard. It is also available for immediate download and adjustment. So, changes can be made in the color, design, graphics or any other component to create a unique layout.

Salary Management Dashboard For Origination Graphics PDF
The following slide highlights the payroll management dashboard for organization illustrating key headings which includes home, task to do, messages, last payroll and trends Pitch your topic with ease and precision using this Salary Management Dashboard For Origination Graphics PDF. This layout presents information on Salary Management Dashboard, Origination. It is also available for immediate download and adjustment. So, changes can be made in the color, design, graphics or any other component to create a unique layout.
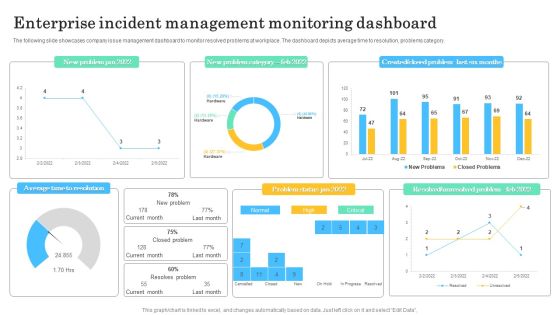
Enterprise Incident Management Monitoring Dashboard Graphics PDF
The following slide showcases company issue management dashboard to monitor resolved problems at workplace. The dashboard depicts average time to resolution, problems category. Pitch your topic with ease and precision using this Enterprise Incident Management Monitoring Dashboard Graphics PDF. This layout presents information on Average Time Resolution, New Problem Category. It is also available for immediate download and adjustment. So, changes can be made in the color, design, graphics or any other component to create a unique layout.
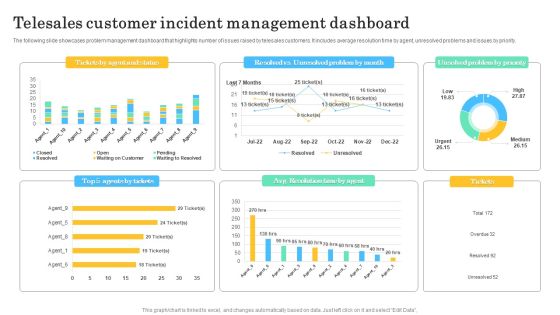
Telesales Customer Incident Management Dashboard Brochure PDF
The following slide showcases problem management dashboard that highlights number of issues raised by telesales customers. It includes average resolution time by agent, unresolved problems and issues by priority. Showcasing this set of slides titled Telesales Customer Incident Management Dashboard Brochure PDF. The topics addressed in these templates are Telesales Customer, Incident Management Dashboard. All the content presented in this PPT design is completely editable. Download it and make adjustments in color, background, font etc. as per your unique business setting.

Client Support Performance Tracking Dashboard Template PDF
This slide shows KPI dashboard which can be used by organizations to track customer service delivery dashboard. It includes customer satisfaction score, total cases received, cases responses, etc. Showcasing this set of slides titled Client Support Performance Tracking Dashboard Template PDF. The topics addressed in these templates are Customer Satisfaction Score, Average, Cases By Product. All the content presented in this PPT design is completely editable. Download it and make adjustments in color, background, font etc. as per your unique business setting.

Defect Management Activity Monitoring Dashboard Information PDF
This slide illustrates summary dashboard for defect planning for project management. It includes defect management, defects by project, defects by type, defects by status, defects by reporter, etc. Pitch your topic with ease and precision using this Defect Management Activity Monitoring Dashboard Information PDF. This layout presents information on Defect Management, Activity Monitoring Dashboard. It is also available for immediate download and adjustment. So, changes can be made in the color, design, graphics or any other component to create a unique layout.
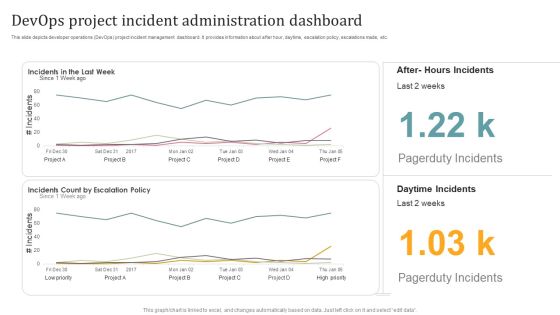
Devops Project Incident Administration Dashboard Diagrams PDF
This slide depicts developer operations DevOps project incident management dashboard. It provides information about after hour, daytime, escalation policy, escalations made, etc. Showcasing this set of slides titled Devops Project Incident Administration Dashboard Diagrams PDF. The topics addressed in these templates are Devops Project Incident, Administration Dashboard. All the content presented in this PPT design is completely editable. Download it and make adjustments in color, background, font etc. as per your unique business setting.
Financial Performance Tracking Dashboard Themes PDF
This slide presents the dashboard which will help firm in tracking the fiscal performance. This dashboard displays revenues and expenses trends and payment received analysis. There are so many reasons you need a Financial Performance Tracking Dashboard Themes PDF. The first reason is you can not spend time making everything from scratch, Thus, Slidegeeks has made presentation templates for you too. You can easily download these templates from our website easily.
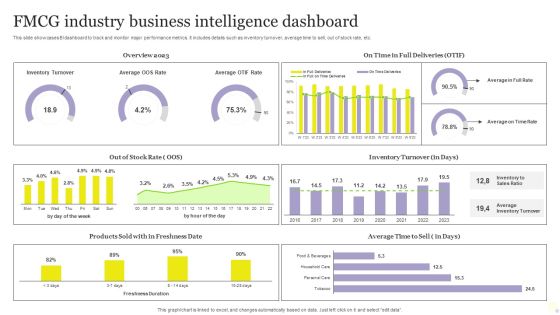
FMCG Industry Business Intelligence Dashboard Mockup PDF
This slide showcases BI dashboard to track and monitor major performance metrics. It includes details such as inventory turnover, average time to sell, out of stock rate, etc. Pitch your topic with ease and precision using this FMCG Industry Business Intelligence Dashboard Mockup PDF. This layout presents information on Average, Inventory Turnover, Business Intelligence Dashboard. It is also available for immediate download and adjustment. So, changes can be made in the color, design, graphics or any other component to create a unique layout.

Dashboard Diagram For Data Segmentation Powerpoint Slides
This PowerPoint template has been designed with graphics of dashboard diagram. You may download this slide for data segmentation and representation. Mesmerize your audience with this unique diagram.

Marketing Kpis Monitor Dashboard Ppt Examples
This is a marketing kpis monitor dashboard ppt examples. This is a five stage process. The stages in this process are awareness, interest, consideration, preference, purchase.

Crm Dashboard Kpis Ppt PowerPoint Presentation Pictures
This is a crm dashboard kpis ppt powerpoint presentation pictures. This is a five stage process. The stages in this process are revenue, acquisition, active subscribers.

Crm Dashboard Kpis Ppt PowerPoint Presentation Rules
This is a crm dashboard kpis ppt powerpoint presentation rules. This is a three stage process. The stages in this process are revenue, acquisition, active subscribers.

Crm Dashboard Kpis Ppt PowerPoint Presentation Layouts
This is a crm dashboard kpis ppt powerpoint presentation layouts. This is a three stage process. The stages in this process are revenue, active subscribers, acquisition.

Business Kpi Dashboard Diagram Powerpoint Slides
This is a business kpi dashboard diagram powerpoint slides. This is a four stage process. The stages in this process are kpi tracking, activity planning, targeting, data management.
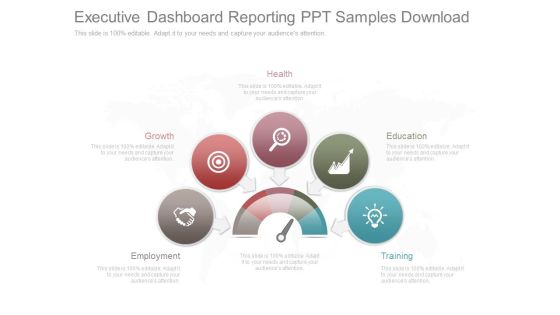
Executive Dashboard Reporting Ppt Samples Download
This is a executive dashboard reporting ppt samples download. This is a five stage process. The stages in this process are health, employment, growth, education, training.

Cost Reporting Dashboard Example Powerpoint Slides
This is a cost reporting dashboard example powerpoint slides. This is a five stage process. The stages in this process are cost, quality, project, process planning, analysis.

Incident Management Dashboard Template Ppt Slides
This is a incident management dashboard template ppt slides. This is a two stage process. The stages in this process are incident status, incident trends.

Dashboard Based Management Template Powerpoint Designs
This is a dashboard based management template powerpoint designs. This is a four stage process. The stages in this process are forecast, report, plan, control.

Balanced Scorecard Dashboard Illustration Ppt Slides
This is a balanced scorecard dashboard illustration ppt slides. This is a five stage process. The stages in this process are business benefits, financials, schedule, technology, customer.
Strategy Management System Dashboard Ppt Slides
This is a strategy management system dashboard ppt slides. This is a five stage process. The stages in this process are direction, situation analysis, evaluation, execution, alignment.
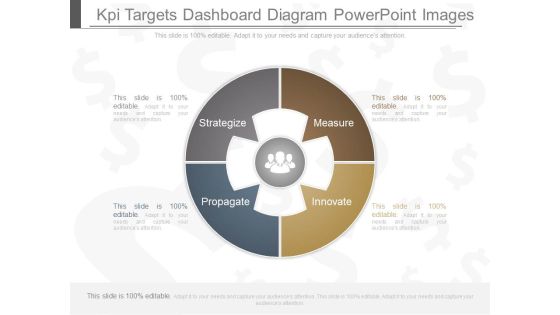
Kpi Targets Dashboard Diagram Powerpoint Images
This is a kpi targets dashboard diagram powerpoint images. This is a four stage process. The stages in this process are strategize, measure, propagate, innovate.

Investment Performance Measurement Dashboard Ppt Sample
This is an investment performance measurement dashboard ppt sample. This is a three stage process. The stages in this process are infrastructure, property, credit opportunities.

Balanced Scorecard Customer Dashboard Ppt Slides
This is a balanced scorecard customer dashboard ppt slides. This is a five stage process. The stages in this process are processes, partner, technology, stakeholders, people.

Business Strategy Scorecard Dashboard Ppt Slides
This is a business strategy scorecard dashboard ppt slides. This is a five stage process. The stages in this process are marketing, logistics, production, planning, combined strategy.

Kpi For Management Dashboard Diagram Powerpoint Guide
This is a kpi for management dashboard diagram powerpoint guide. This is a three stage process. The stages in this process are ceo, senior management, junior managers.
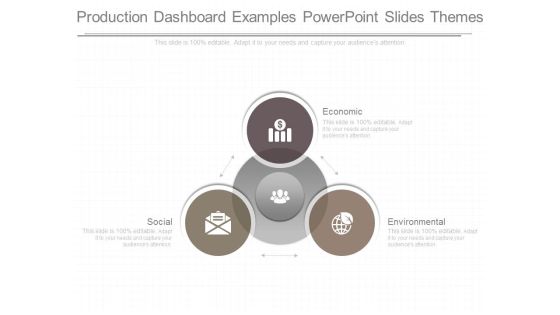
Production Dashboard Examples Powerpoint Slides Themes
This is a production dashboard examples powerpoint slides themes. This is a three stage process. The stages in this process are economic, social, environmental.
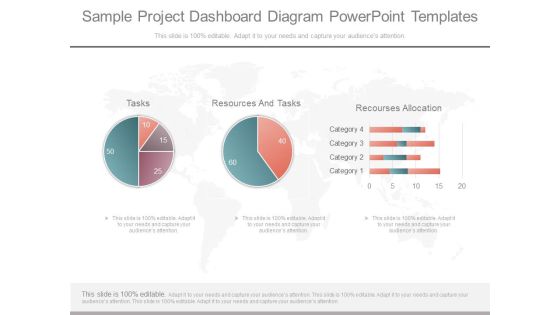
Sample Project Dashboard Diagram Powerpoint Templates
This is a sample project dashboard diagram powerpoint templates. This is a three stage process. The stages in this process are tasks, resources and tasks, resources allocation.

Vendor Performance Dashboard Reports Ppt Powerpoint Images
This is a vendor performance dashboard reports ppt powerpoint images. This is a two stage process. The stages in this process are trends of complaints, count by category.

Executive Dashboard Sample For Analysis Example
This is a executive dashboard sample for analysis example. This is a four stage process. The stages in this process are topper, step.

Executive Summary Dashboard Ppt Powerpoint Shapes
This is a executive summary dashboard ppt powerpoint shapes. This is a four stage process. The stages in this process are brand b, brand c, brand d.

Bi Dashboard Gallery Diagram Powerpoint Presentation
This is a bi dashboard gallery diagram powerpoint presentation. This is a four stage process. The stages in this process are business intelligence, month.
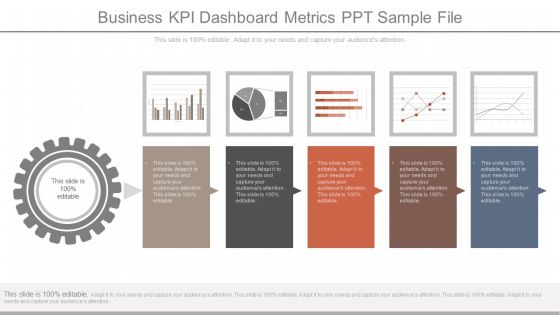
Business Kpi Dashboard Metrics Ppt Sample File
This is a business kpi dashboard metrics ppt sample file. This is a five stage process. The stages in this process are business, finance, management, success, marketing, presentation.

Digital Marketing Dashboard Powerpoint Slide Images
This is a digital marketing dashboard powerpoint slide images. This is a five stage process. The stages in this process are lead generation, website, email, advertising, social media.

Hr Metrics Dashboard Examples Ppt Powerpoint Slides
This is a hr metrics dashboard examples ppt powerpoint slides. This is a five stage process. The stages in this process are chicago, boston, detroit, cleveland, turnover.
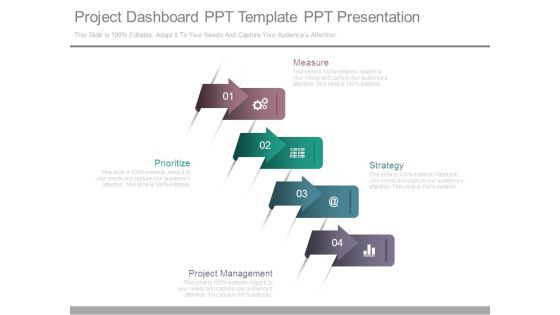
Project Dashboard Ppt Template Ppt Presentation
This is a project dashboard ppt template ppt presentation. This is a four stage process. The stages in this process are measure, strategy, project management, prioritize.

Customer Satisfaction Dashboard Chart Presentation Layouts
This is a customer satisfaction dashboard chart presentation layouts. This is a five stage process. The stages in this process are very satisfied, satisfied, unsatisfied, natural, very unsatisfied.

Customer Service Kpi Dashboard Powerpoint Ideas
This is a customer service kpi dashboard powerpoint ideas. This is a two stage process. The stages in this process are information desk, gift shop sales.

Home Statistics Dashboard Ppt Presentation Background Images
This is a home statistics dashboard ppt presentation background images. This is a two stage process. The stages in this process are compare power, finance, growth.

Business Analytics Dashboard Diagram Example Of Ppt
This is a business analytics dashboard diagram example of ppt. This is a one stage process. The stages in this process are business, management, strategy, pie, presentation.

Business Metrics Dashboard Presentation Powerpoint Example
This is a business metrics dashboard presentation powerpoint example. This is a two stage process. The stages in this process are facebook, twitter.

Interactive Dashboard Examples Ppt Samples Download
This is a interactive dashboard examples ppt samples download. This is a two stage process. The stages in this process are call quality, network utilization.

Business Alternatives Analysis Dashboard Powerpoint Ideas
This is a business alternatives analysis dashboard powerpoint ideas. This is a two stage process. The stages in this process are strategy, marketing, business, finance, donut.
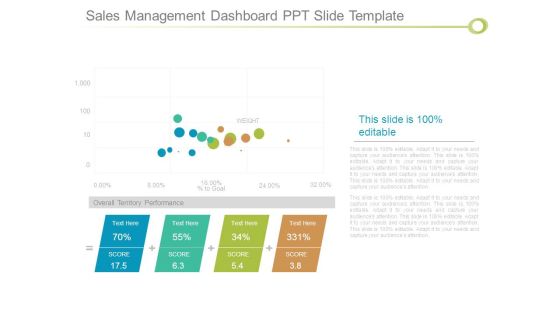
Sales Management Dashboard Ppt Slide Template
This is a sales management dashboard ppt slide template. This is a four stage process. The stages in this process are weight, goal, overall territory performance, score.

Company Research Results Dashboard Ppt Background Graphics
This is a company research results dashboard ppt background graphics. This is a four stage process. The stages in this process are growth, business, marketing, year.

Business Kpi Dashboard Slide Powerpoint Presentation Templates
This is a business kpi dashboard slide powerpoint presentation templates. This is a four stage process. The stages in this process are sales, marketing, budget, people.

Project Reporting Dashboard Example Powerpoint Templates
This is a project reporting dashboard example powerpoint templates. This is a four stage process. The stages in this process are report, project, task, resource.

Dashboard For Target Marketing Powerpoint Images
This is a dashboard for target marketing powerpoint images. This is a five stage process. The stages in this process are socialgraphic, behavioral, psychographic, geographic, demographic.

Team Members Performance Dashboard Powerpoint Slide Backgrounds
This is a team members performance dashboard powerpoint slide backgrounds. This is a four stage process. The stages in this process are ceo, general manager, marketing, developer.
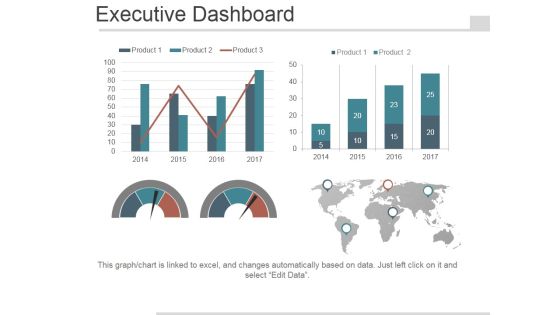
Executive Dashboard Ppt PowerPoint Presentation Visuals
This is a executive dashboard ppt powerpoint presentation visuals. This is a four stage process. The stages in this process are product, finance, management, arrows.

Marketing Dashboard Ppt PowerPoint Presentation Slide
This is a marketing dashboard ppt powerpoint presentation slide. This is a four stage process. The stages in this process are funnel, marketing, process, business, management.

Crm Dashboard Template Ppt PowerPoint Presentation Graphics
This is a crm dashboard template ppt powerpoint presentation graphics. This is a two stage process. The stages in this process are business, marketing, success, growth, finance.

Revenue Dashboard Ppt PowerPoint Presentation Summary Brochure
This is a revenue dashboard ppt powerpoint presentation summary brochure. This is a five stage process. The stages in this process are account industry verticals, calendar quarters.

Dashboard Ppt PowerPoint Presentation Inspiration Icons
This is a dashboard ppt powerpoint presentation inspiration icons. This is a four stage process. The stages in this process are business, marketing, finance, planning, analysis.

Dashboard Ppt PowerPoint Presentation Icon Model
This is a dashboard ppt powerpoint presentation icon model. This is a four stage process. The stages in this process are percentage, finance, business, donut.

Dashboard Marketing Planning Ppt PowerPoint Presentation Tips
This is a dashboard marketing planning ppt powerpoint presentation tips. This is a three stage process. The stages in this process are finance, analysis, business, investment, marketing.
 Home
Home