dashboard

Monthly Earning Breakup Dashboard With Customer Growth Analysis Infographics PDF
Showcasing this set of slides titled Monthly Earning Breakup Dashboard With Customer Growth Analysis Infographics PDF. The topics addressed in these templates are Breakup Dashboard, Customer Growth Analysis. All the content presented in this PPT design is completely editable. Download it and make adjustments in color, background, font etc. as per your unique business setting.
Shipping Order Management Tracking Metrics Dashboard Clipart PDF
Pitch your topic with ease and precision using this Shipping Order Management Tracking Metrics Dashboard Clipart PDF. This layout presents information on Management Tracking, Metrics Dashboard. It is also available for immediate download and adjustment. So, changes can be made in the color, design, graphics or any other component to create a unique layout.
Shipping Performance Analysis Tracking Metrics Dashboard Rules PDF
Showcasing this set of slides titled Shipping Performance Analysis Tracking Metrics Dashboard Rules PDF. The topics addressed in these templates are Analysis Tracking Metrics Dashboard. All the content presented in this PPT design is completely editable. Download it and make adjustments in color, background, font etc. as per your unique business setting.
Shipping Tracking Metrics Dashboard For Tracking Shipment Delays Summary PDF
Pitch your topic with ease and precision using this Shipping Tracking Metrics Dashboard For Tracking Shipment Delays Summary PDF. This layout presents information on Metrics Dashboard, Tracking Shipment. It is also available for immediate download and adjustment. So, changes can be made in the color, design, graphics or any other component to create a unique layout.
Shipping Tracking Metrics Dashboard With Vessel Tracking Designs PDF
Showcasing this set of slides titled Shipping Tracking Metrics Dashboard With Vessel Tracking Designs PDF. The topics addressed in these templates are Tracking Metrics, Dashboard With Vessel. All the content presented in this PPT design is completely editable. Download it and make adjustments in color, background, font etc. as per your unique business setting.

Dashboard Icon For Lead Tracking Measurement Summary PDF
Presenting Dashboard Icon For Lead Tracking Measurement Summary PDF to dispense important information. This template comprises three stages. It also presents valuable insights into the topics including Dashboard Lead, Tracking, Measurement. This is a completely customizable PowerPoint theme that can be put to use immediately. So, download it and address the topic impactfully.

Logistics Time And Transportation Management Dashboard Icon Diagrams PDF
Persuade your audience using this Logistics Time And Transportation Management Dashboard Icon Diagrams PDF. This PPT design covers three stages, thus making it a great tool to use. It also caters to a variety of topics including Logistics Time, Transportation, Management Dashboard. Download this PPT design now to present a convincing pitch that not only emphasizes the topic but also showcases your presentation skills.

Product Logistics Management And Sales Management Dashboard Icon Download PDF
Presenting Product Logistics Management And Sales Management Dashboard Icon Download PDF to dispense important information. This template comprises three stages. It also presents valuable insights into the topics including Product Logistics, Management Sales, Management Dashboard. This is a completely customizable PowerPoint theme that can be put to use immediately. So, download it and address the topic impactfully.

Company Payout Dashboard Icon For Managing Cash Transactions Rules PDF
Showcasing this set of slides titled Company Payout Dashboard Icon For Managing Cash Transactions Rules PDF. The topics addressed in these templates are Company Payout Dashboard, Icon For Managing, Cash Transactions. All the content presented in this PPT design is completely editable. Download it and make adjustments in color, background, font etc. as per your unique business setting.

Business Executive Report Report Dashboard Icon Sample PDF
Presenting Business Executive Report Report Dashboard Icon Sample PDF to dispense important information. This template comprises three stages. It also presents valuable insights into the topics including Business Executive, Report Report, Dashboard. This is a completely customizable PowerPoint theme that can be put to use immediately. So, download it and address the topic impactfully.

Organization Development Project Synopsis Dashboard Icon Graphics PDF
Presenting Organization Development Project Synopsis Dashboard Icon Graphics PDF to dispense important information. This template comprises three stages. It also presents valuable insights into the topics including Organization Development, Project Synopsis, Dashboard. This is a completely customizable PowerPoint theme that can be put to use immediately. So, download it and address the topic impactfully.
Smart Business Evaluation Icon With Dashboard Sample PDF
Presenting Smart Business Evaluation Icon With Dashboard Sample PDF to dispense important information. This template comprises three stages. It also presents valuable insights into the topics including Smart Business Evaluation Icon, Dashboard. This is a completely customizable PowerPoint theme that can be put to use immediately. So, download it and address the topic impactfully.
Sales And Retail Expenditure Dashboard Icon Diagrams PDF
Persuade your audience using this Sales And Retail Expenditure Dashboard Icon Diagrams PDF. This PPT design covers three stages, thus making it a great tool to use. It also caters to a variety of topics including Sales And Retail, Expenditure Dashboard Icon. Download this PPT design now to present a convincing pitch that not only emphasizes the topic but also showcases your presentation skills.
Vendor Performance KPI Evaluation Dashboard Icon Portrait PDF
Presenting Vendor Performance KPI Evaluation Dashboard Icon Portrait PDF to dispense important information. This template comprises three stages. It also presents valuable insights into the topics including Vendor Performance, KPI Evaluation Dashboard Icon. This is a completely customizable PowerPoint theme that can be put to use immediately. So, download it and address the topic impactfully.
Vendor Performance KPI Management Dashboard Icon Download PDF
Presenting Vendor Performance KPI Management Dashboard Icon Download PDF to dispense important information. This template comprises three stages. It also presents valuable insights into the topics including Vendor Performance KPI, Management Dashboard Icon. This is a completely customizable PowerPoint theme that can be put to use immediately. So, download it and address the topic impactfully.
Qualitative Risk Evaluation Performance Dashboard Icon Template PDF
Persuade your audience using this Qualitative Risk Evaluation Performance Dashboard Icon Template PDF. This PPT design covers three stages, thus making it a great tool to use. It also caters to a variety of topics including Qualitative Risk Evaluation, Performance Dashboard Icon. Download this PPT design now to present a convincing pitch that not only emphasizes the topic but also showcases your presentation skills.
Insurance Scam Documentation Analysis KPI Dashboard Themes PDF
Persuade your audience using this Insurance Scam Documentation Analysis KPI Dashboard Themes PDF. This PPT design covers three stages, thus making it a great tool to use. It also caters to a variety of topics including Insurance Scam Documentation, Analysis Kpi Dashboard. Download this PPT design now to present a convincing pitch that not only emphasizes the topic but also showcases your presentation skills.

Customer Service Performance Dashboard To Track Ticket Resolution Clipart PDF
This slide showcases dashboard depicting customer service dashboard to track support tick resolution status. The dashboard includes ticket support requests, status, resolved and unresolved tickets, tickets by issue type, etc. Here you can discover an assortment of the finest PowerPoint and Google Slides templates. With these templates, you can create presentations for a variety of purposes while simultaneously providing your audience with an eye catching visual experience. Download Customer Service Performance Dashboard To Track Ticket Resolution Clipart PDF to deliver an impeccable presentation. These templates will make your job of preparing presentations much quicker, yet still, maintain a high level of quality. Slidegeeks has experienced researchers who prepare these templates and write high quality content for you. Later on, you can personalize the content by editing the Customer Service Performance Dashboard To Track Ticket Resolution Clipart PDF.
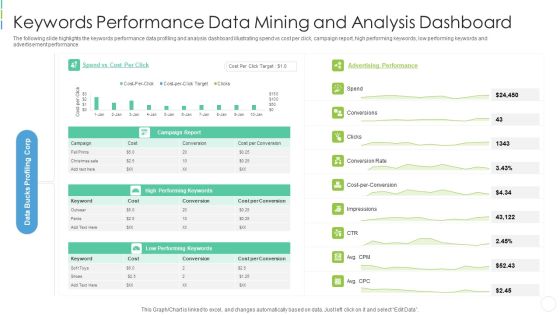
Keywords Performance Data Mining And Analysis Dashboard Microsoft PDF
The following slide highlights the keywords performance data profiling and analysis dashboard illustrating spend vs cost per click, campaign report, high performing keywords, low performing keywords and advertisement performance Showcasing this set of slides titled keywords performance data mining and analysis dashboard microsoft pdf . The topics addressed in these templates are keywords performance data mining and analysis dashboard . All the content presented in this PPT design is completely editable. Download it and make adjustments in color, background, font etc. as per your unique business setting.

Weekly Email Marketing Campaign Performance Dashboard Analysis Structure PDF
This slide showcase the performance data of email marketing implemented by an organization in a dashboard report. It includes statistics of email sent, delivered, open rate, click rate, unsubscribe rate, bounce rate, etc. Pitch your topic with ease and precision using this Weekly Email Marketing Campaign Performance Dashboard Analysis Structure PDF. This layout presents information on Weekly Email Marketing, Campaign Performance Dashboard Analysis. It is also available for immediate download and adjustment. So, changes can be made in the color, design, graphics or any other component to create a unique layout.

Procurement Data Analytics And Business Intelligence Dashboard Pictures PDF
This slide showcases BI dashboard to help company in real time tracking of procurement KPIs. It includes information such as defect rate, supplier availability, lead time, etc. Pitch your topic with ease and precision using this Procurement Data Analytics And Business Intelligence Dashboard Pictures PDF. This layout presents information on Procurement Data Analytics, Business Intelligence Dashboard. It is also available for immediate download and adjustment. So, changes can be made in the color, design, graphics or any other component to create a unique layout.
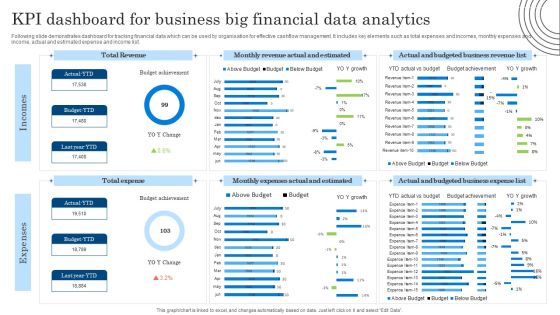
KPI Dashboard For Business Big Financial Data Analytics Diagrams PDF
Following slide demonstrates dashboard for tracking financial data which can be used by organisation for effective cashflow management. It includes key elements such as total expenses and incomes, monthly expenses and income, actual and estimated expense and income list. Showcasing this set of slides titled KPI Dashboard For Business Big Financial Data Analytics Diagrams PDF. The topics addressed in these templates are KPI Dashboard, Business Big Financial, Data Analytics. All the content presented in this PPT design is completely editable. Download it and make adjustments in color, background, font etc. as per your unique business setting.
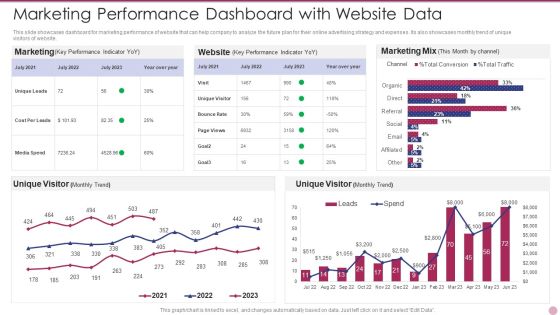
Marketing Performance Dashboard With Website Data Elements PDF
This slide showcases dashboard for marketing performance of website that can help company to analyze the future plan for their online advertising strategy and expenses. Its also showcases monthly trend of unique visitors of website. Pitch your topic with ease and precision using this Marketing Performance Dashboard With Website Data Elements PDF. This layout presents information on Marketing Performance Dashboard With Website Data. It is also available for immediate download and adjustment. So, changes can be made in the color, design, graphics or any other component to create a unique layout.

Dashboard To Track Kpis In Project Launch Strategy Pictures PDF
The following slide brings forth a dashboard to track important key performance indicators in a project rollout strategy with the purpose of tracking projects in real time with live data. The KPIs are tasks, progress, time, cost and workload. Showcasing this set of slides titled Dashboard To Track Kpis In Project Launch Strategy Pictures PDF. The topics addressed in these templates are Expenses, Project Launch Strategy, Dashboard To Track Kpis. All the content presented in this PPT design is completely editable. Download it and make adjustments in color, background, font etc. as per your unique business setting.
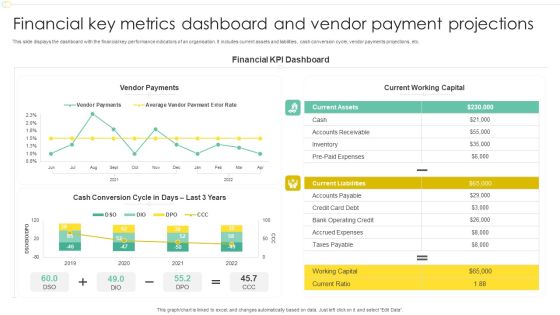
Financial Key Metrics Dashboard And Vendor Payment Projections Professional PDF
This slide displays the dashboard with the financial key performance indicators of an organisation. It includes current assets and liabilities, cash conversion cycle, vendor payments projections, etc. Pitch your topic with ease and precision using this Financial Key Metrics Dashboard And Vendor Payment Projections Professional PDF. This layout presents information on Financial KPI Dashboard, Current Working Capital, Vendor Payments. It is also available for immediate download and adjustment. So, changes can be made in the color, design, graphics or any other component to create a unique layout.
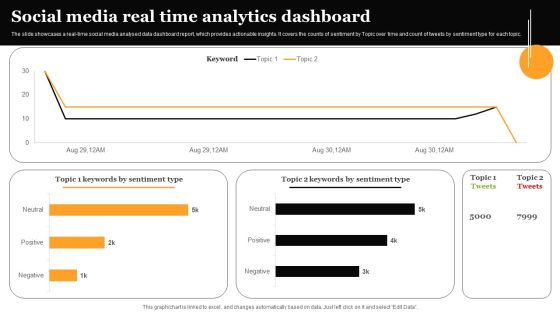
Social Media Real Time Analytics Dashboard Formats PDF
The slide showcases a real-time social media analysed data dashboard report, which provides actionable insights. It covers the counts of sentiment by Topic over time and count of tweets by sentiment type for each topic. Showcasing this set of slides titled Social Media Real Time Analytics Dashboard Formats PDF. The topics addressed in these templates are Social Media Real, Time Analytics, Dashboard. All the content presented in this PPT design is completely editable. Download it and make adjustments in color, background, font etc. as per your unique business setting.
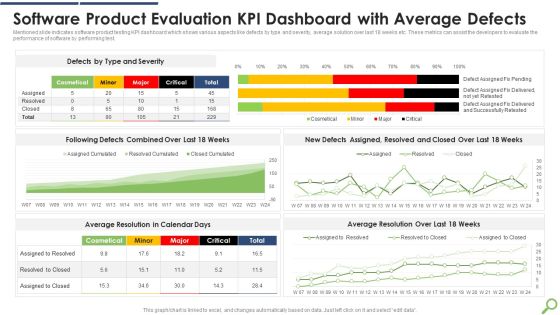
Software Product Evaluation KPI Dashboard With Average Defects Infographics PDF
Mentioned slide indicates software product testing KPI dashboard which shows various aspects like defects by type and severity, average solution over last 18 weeks etc. These metrics can assist the developers to evaluate the performance of software by performing test.Showcasing this set of slides titled Software Product Evaluation KPI Dashboard With Average Defects Infographics PDF The topics addressed in these templates are Software Product, Evaluation Dashboard, Average Defects All the content presented in this PPT design is completely editable. Download it and make adjustments in color, background, font etc. as per your unique business setting.

Revenue Analysis KPI Dashboard Post Building Marketing Strategy Infographics PDF
Following slide outlines a revenue analysis dashboard showcasing the business results after implementing marketing strategy. It provides information about total revenue for the month, revenue for year to date, revenue trend, product revenue and services revenue etc. Pitch your topic with ease and precision using this revenue analysis kpi dashboard post building marketing strategy infographics pdf. This layout presents information on revenue analysis kpi dashboard post building marketing strategy. It is also available for immediate download and adjustment. So, changes can be made in the color, design, graphics or any other component to create a unique layout.
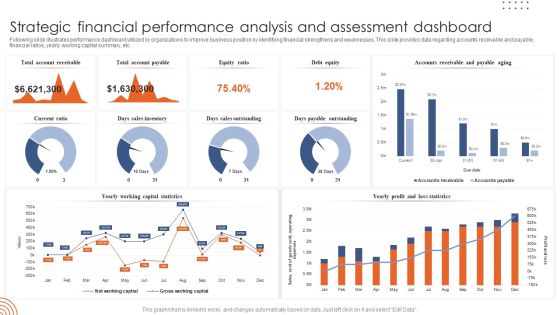
Strategic Financial Performance Analysis And Assessment Dashboard Template PDF
Following slide illustrates performance dashboard utilized by organizations to improve business position by identifying financial strengthens and weaknesses. This slide provides data regarding accounts receivable and payable, financial ratios, yearly working capital summary, etc. Showcasing this set of slides titled Strategic Financial Performance Analysis And Assessment Dashboard Template PDF. The topics addressed in these templates are Strategic Financial Performance, Analysis Assessment Dashboard. All the content presented in this PPT design is completely editable. Download it and make adjustments in color, background, font etc. as per your unique business setting.

Website Data Dashboard With Landing Pages Performance Formats PDF
This slide showcases website statistics dashboard that can help to optimize the pages, formulate the paid advertising and SEO marketing strategy. Its key components are website overview, landing pages, time on site, exit pages, landing page performance and bounce rate. Showcasing this set of slides titled Website Data Dashboard With Landing Pages Performance Formats PDF. The topics addressed in these templates are Website Data Dashboard With Landing Pages Performance. All the content presented in this PPT design is completely editable. Download it and make adjustments in color, background, font etc. as per your unique business setting.
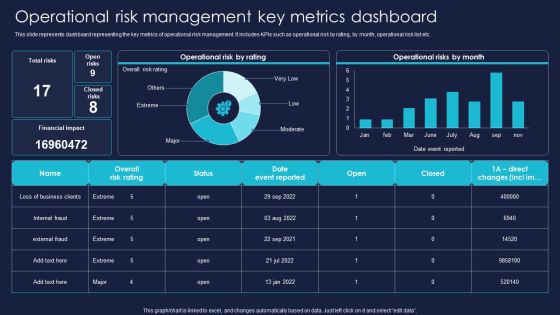
Operational Risk Management Key Metrics Dashboard Professional PDF
This slide represents dashboard representing the key metrics of operational risk management. It includes KPIs such as operational risk by rating, by month, operational risk list etc. Get a simple yet stunning designed Operational Risk Management Key Metrics Dashboard Professional PDF. It is the best one to establish the tone in your meetings. It is an excellent way to make your presentations highly effective. So, download this PPT today from Slidegeeks and see the positive impacts. Our easy to edit Operational Risk Management Key Metrics Dashboard Professional PDF can be your go-to option for all upcoming conferences and meetings. So, what are you waiting for Grab this template today.

Business Intelligence Dashboard To Track Call Center Kpis Download PDF
This slide showcases business intelligence dashboard to help organization track key performance metrics. It further includes details about top agents, close rate, calls handled, abandon rate, scheduled leads, average speed of answer, etc. Pitch your topic with ease and precision using this Business Intelligence Dashboard To Track Call Center Kpis Download PDF. This layout presents information on Business Intelligence Dashboard, Track Call Center Kpis. It is also available for immediate download and adjustment. So, changes can be made in the color, design, graphics or any other component to create a unique layout.
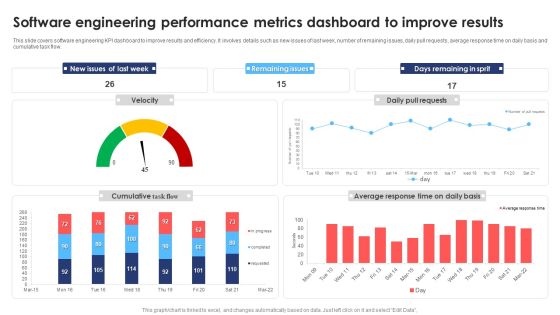
Software Engineering Performance Metrics Dashboard To Improve Results Infographics PDF
This slide covers software engineering KPI dashboard to improve results and efficiency. It involves details such as new issues of last week, number of remaining issues, daily pull requests, average response time on daily basis and cumulative task flow. Pitch your topic with ease and precision using this Software Engineering Performance Metrics Dashboard To Improve Results Infographics PDF. This layout presents information on Software Engineering Performance, Metrics Dashboard Improve Results. It is also available for immediate download and adjustment. So, changes can be made in the color, design, graphics or any other component to create a unique layout.

Dashboard Of Recruitment Funnel And Key Metrics Information PDF
The slide highlights the dashboard of recruitment funnel and key metrics illustrating recruitment source, department, job level, key metrics, recruitment funnel, number of days per stage, gender ratio and age of applicants.Pitch your topic with ease and precision using this Dashboard Of Recruitment Funnel And Key Metrics Information PDF This layout presents information on Recruitment Funnel, Recruitment Dashboard, Recruitment Cost It is also available for immediate download and adjustment. So, changes can be made in the color, design, graphics or any other component to create a unique layout.

Customer Service Metrics Dashboard For Email And Chat Infographics PDF
This slide showcases dashboard for customer service metrics that can help to identify the customer satisfaction score plus implement strategies in case of decline. Its key KPIs are first response time, requester wait time, first response time and time to close. Pitch your topic with ease and precision using this Customer Service Metrics Dashboard For Email And Chat Infographics PDF. This layout presents information on Customer Service, Metrics Dashboard, Email And Chat. It is also available for immediate download and adjustment. So, changes can be made in the color, design, graphics or any other component to create a unique layout.

Call Centre Performance Dashboard With Customer Service Metrics Background PDF
This slide showcases dashboard for call centre performance that can help to evaluate the call abandon rate of customers and implement training of staff for improving customer satisfaction KPIs. Its key elements are total calls, avg answer speed and customer effort score. Showcasing this set of slides titled Call Centre Performance Dashboard With Customer Service Metrics Background PDF. The topics addressed in these templates are Call Centre Performance Dashboard, Customer Service Metrics. All the content presented in this PPT design is completely editable. Download it and make adjustments in color, background, font etc. as per your unique business setting.
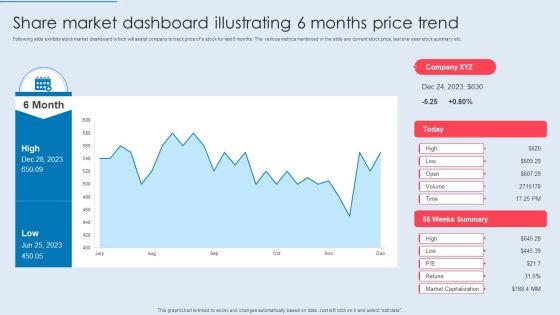
Share Market Dashboard Illustrating 6 Months Price Trend Ideas PDF
Following slide exhibits stock market dashboard which will assist company to track price of a stock for last 6 months. The various metrics mentioned in the slide are current stock price, last one year stock summary etc. Showcasing this set of slides titled Share Market Dashboard Illustrating 6 Months Price Trend Ideas PDF. The topics addressed in these templates are Share Market, Dashboard Illustrating, Months Price Trend. All the content presented in this PPT design is completely editable. Download it and make adjustments in color, background, font etc. as per your unique business setting.
Employee Training And Development Plan Performance Tracking Dashboard Portrait PDF
Mentioned slide outlines key performance indicator KPI dashboard which can be used by organization to monitor training and development strategies. The major metrics covered in the template are cost per participant, per hour, number of trainees , etc. Showcasing this set of slides titled Employee Training And Development Plan Performance Tracking Dashboard Portrait PDF. The topics addressed in these templates are Employee Training, Development Plan Performance, Tracking Dashboard. All the content presented in this PPT design is completely editable. Download it and make adjustments in color, background, font etc. as per your unique business setting.

Data Center Infrastructure Management KPI Dashboard Designs PDF
This slide covers data center infrastructure management KPI dashboard. It involves details such as cabinets with free data and power ports, data ports usage per user and items per connected power supplies. Showcasing this set of slides titled Data Center Infrastructure Management KPI Dashboard Designs PDF. The topics addressed in these templates are Data Center Infrastructure, Management KPI Dashboard. All the content presented in this PPT design is completely editable. Download it and make adjustments in color, background, font etc. as per your unique business setting.

Dashboard Of Digital Advertisement Data Mining Professional PDF
The following slide highlights the dashboard of digital advertisement data profiling illustrating key headings which includes campaign name, period, ads spend results, ads generating actions, ad conversion and cost and campaign performance. Pitch your topic with ease and precision using this dashboard of digital advertisement data mining professional pdf . This layout presents information on dashboard of digital advertisement data mining . It is also available for immediate download and adjustment. So, changes can be made in the color, design, graphics or any other component to create a unique layout.

Data Mining Dashboard Of Gender And Age Demographics Icons PDF
The following slide highlights the data profiling dashboard of gender and age demographics illustrating gender and age per month, gender and general age, average age per month and individual per age group to find the gender and age composition of area Showcasing this set of slides titled data mining dashboard of gender and age demographics icons pdf . The topics addressed in these templates are data mining dashboard of gender and age demographics . All the content presented in this PPT design is completely editable. Download it and make adjustments in color, background, font etc. as per your unique business setting.
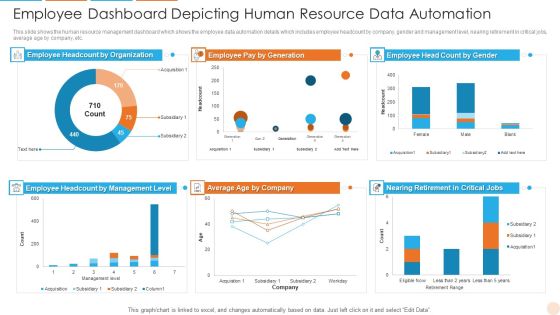
Employee Dashboard Depicting Human Resource Data Automation Professional PDF
This slide shows the human resource management dashboard which shows the employee data automation details which includes employee headcount by company, gender and management level, nearing retirement in critical jobs, average age by company, etc. Showcasing this set of slides titled Employee Dashboard Depicting Human Resource Data Automation Professional PDF. The topics addressed in these templates are Employee Dashboard Depicting Human Resource Data Automation. All the content presented in this PPT design is completely editable. Download it and make adjustments in color, background, font etc. as per your unique business setting.

Data Dashboard For Multi Websites Performance Comparison Themes PDF
This slide showcases website statistics dashboard that can help to do the comparative assessment of visitors and traffic performance of multiple websites. Its key components are website overview, traffic sources and conversions. Showcasing this set of slides titled Data Dashboard For Multi Websites Performance Comparison Themes PDF. The topics addressed in these templates are Data Dashboard For Multi Websites Performance Comparison. All the content presented in this PPT design is completely editable. Download it and make adjustments in color, background, font etc. as per your unique business setting.
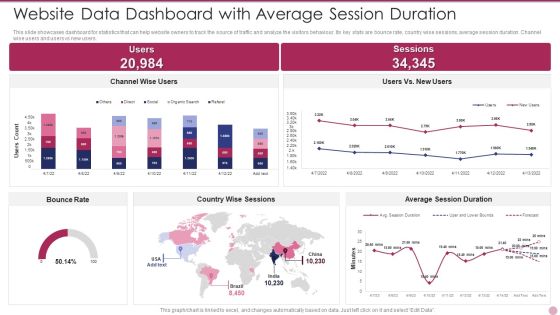
Website Data Dashboard With Average Session Duration Ideas PDF
This slide showcases dashboard for statistics that can help website owners to track the source of traffic and analyze the visitors behaviour. Its key stats are bounce rate, country wise sessions, average session duration. Channel wise users and users vs new users. Pitch your topic with ease and precision using this Website Data Dashboard With Average Session Duration Ideas PDF. This layout presents information on Website Data Dashboard With Average Session Duration. It is also available for immediate download and adjustment. So, changes can be made in the color, design, graphics or any other component to create a unique layout.

Retail Outlet Dashboard With Sales Kpis Clipart PDF
This slide covers a metrics dashboard for tracking retail store sales. It includes KPIs such as sales square foot per location, net profit, revues, shrinkage, customer retention rate, etc. Pitch your topic with ease and precision using this retail outlet dashboard with sales kpis clipart pdf This layout presents information on Retail outlet dashboard with sales kpis It is also available for immediate download and adjustment. So, changes can be made in the color, design, graphics or any other component to create a unique layout.

Customer Service Metrics Dashboard With Active Customers Ideas PDF
This slide showcases dashboard for customer service metrics that can help organization to prioritize the issue requests of consumers and ensure good response times. Its key components are active customer, active tickets, highly urgent rickets and average number of tickets. Showcasing this set of slides titled Customer Service Metrics Dashboard With Active Customers Ideas PDF. The topics addressed in these templates are Customer Service, Metrics Dashboard, Active Customers. All the content presented in this PPT design is completely editable. Download it and make adjustments in color, background, font etc. as per your unique business setting.

Customer Service Metrics Dashboard With Average Resolve Time Sample PDF
This slide showcases dashboard for customer service metrics that can help to identify the issue escalations and prioritize them to solve them before expiry. Its key elements are total cases, resolutions, escalations, SLA complaint, avg resolve time and avg CSAT. Showcasing this set of slides titled Customer Service Metrics Dashboard With Average Resolve Time Sample PDF. The topics addressed in these templates are Customer Service, Metrics Dashboard, Average Resolve Time. All the content presented in this PPT design is completely editable. Download it and make adjustments in color, background, font etc. as per your unique business setting.

Customer Service Metrics Dashboard With Unresolved Calls Designs PDF
This slide showcases KPI dashboard for customer service that can help to identify the issue unresolved and response time by weekday. Its key elements are final call resolution, unresolved calls, avg response time and best day to call. Showcasing this set of slides titled Customer Service Metrics Dashboard With Unresolved Calls Designs PDF. The topics addressed in these templates are Customer Service, Metrics Dashboard, Unresolved Calls. All the content presented in this PPT design is completely editable. Download it and make adjustments in color, background, font etc. as per your unique business setting.

Smartphone App Installation Metrics Dashboard With User Sessions Microsoft PDF
This slide showcases dashboard that can help organization to identify the installation trend of mobile application and formulate strategies in case of declining downloads. Its key components are installs trend, total installs, total sessions and total media source breakdown by revenue. Pitch your topic with ease and precision using this Smartphone App Installation Metrics Dashboard With User Sessions Microsoft PDF. This layout presents information on Smartphone App Installation Metrics Dashboard With User Sessions. It is also available for immediate download and adjustment. So, changes can be made in the color, design, graphics or any other component to create a unique layout.

Call Center Metrics Dashboard With Average Response Time Inspiration PDF
Mentioned slide outlines KPI dashboard which can be used by call center to measure the performance of their agents. The key metrics highlighted in the dashboard are first call resolution, daily abandonment rate, total number of calls by topic, top performing call agents etc. Showcasing this set of slides titled Call Center Metrics Dashboard With Average Response Time Inspiration PDF. The topics addressed in these templates are Efficiency, Quality, Activity, Daily Average Response, Daily Average Transfer. All the content presented in this PPT design is completely editable. Download it and make adjustments in color, background, font etc. as per your unique business setting.

Metrics Dashboard To Measure Call Center Success Themes PDF
Mentioned slide outlines a comprehensive KPI dashboard used to measure the call center performance. The dashboard monitors the status of key metrics such as call abandonment levels, current service level, average call length, total calls attended, calls waiting etc. Showcasing this set of slides titled Metrics Dashboard To Measure Call Center Success Themes PDF. The topics addressed in these templates are Center Success, Call Center Status, Call Monitor. All the content presented in this PPT design is completely editable. Download it and make adjustments in color, background, font etc. as per your unique business setting.

Key Company Financials Business Intelligence Dashboard Graphics PDF
This slide showcases business intelligence dashboard to analyze key financial metrics for the organization. It includes information such as current working capital, vendor payment error rate, quick stats, budget variance, etc. Showcasing this set of slides titled Key Company Financials Business Intelligence Dashboard Graphics PDF. The topics addressed in these templates are Key Company Financials, Business Intelligence Dashboard. All the content presented in this PPT design is completely editable. Download it and make adjustments in color, background, font etc. as per your unique business setting.
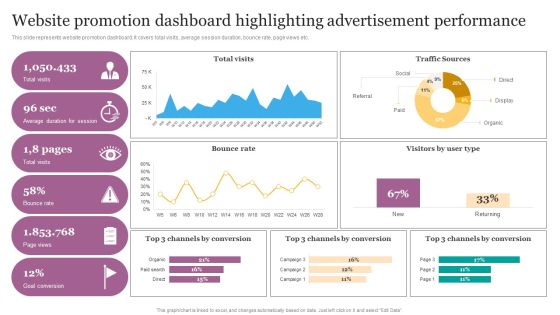
Website Promotion Dashboard Highlighting Advertisement Performance Ppt Infographics Portfolio PDF
This slide represents website promotion dashboard. It covers total visits, average session duration, bounce rate, page views etc. Create an editable Website Promotion Dashboard Highlighting Advertisement Performance Ppt Infographics Portfolio PDF that communicates your idea and engages your audience. Whether youre presenting a business or an educational presentation, pre designed presentation templates help save time. Website Promotion Dashboard Highlighting Advertisement Performance Ppt Infographics Portfolio PDF is highly customizable and very easy to edit, covering many different styles from creative to business presentations. Slidegeeks has creative team members who have crafted amazing templates. So, go and get them without any delay.
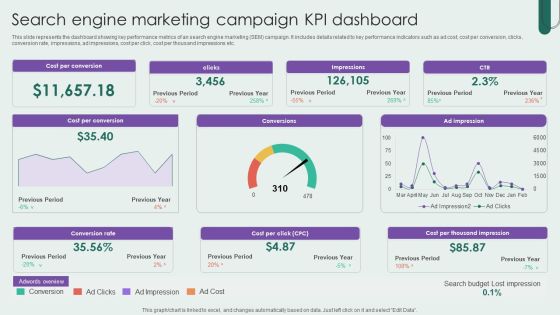
Search Engine Marketing Campaign KPI Dashboard Inspiration PDF
This slide represents the dashboard showing key performance metrics of an search engine marketing SEM campaign. It includes details related to key performance indicators such as ad cost, cost per conversion, clicks, conversion rate, impressions, ad impressions, cost per click, cost per thousand impressions etc. Showcasing this set of slides titled Search Engine Marketing Campaign KPI Dashboard Inspiration PDF. The topics addressed in these templates are Search Engine Marketing, Campaign KPI Dashboard. All the content presented in this PPT design is completely editable. Download it and make adjustments in color, background, font etc. as per your unique business setting.
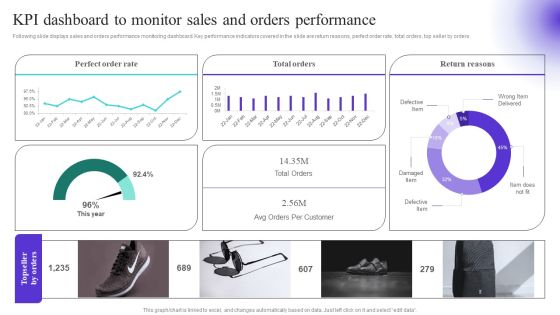
KPI Dashboard To Monitor Sales And Orders Performance Diagrams PDF
Following slide displays sales and orders performance monitoring dashboard. Key performance indicators covered in the slide are return reasons, perfect order rate, total orders, top seller by orders. Create an editable KPI Dashboard To Monitor Sales And Orders Performance Diagrams PDF that communicates your idea and engages your audience. Whether you are presenting a business or an educational presentation, pre designed presentation templates help save time. KPI Dashboard To Monitor Sales And Orders Performance Diagrams PDF is highly customizable and very easy to edit, covering many different styles from creative to business presentations. Slidegeeks has creative team members who have crafted amazing templates. So, go and get them without any delay.

Campaign Performance Dashboard For Brand Equity Tactics Measurement Slides PDF
This slide presents a dashboard for measuring success of a social media campaign for growing and maintaining brand equity and provide visual outcome of social media campaign. The key performance indicators covered are reach of campaign on the basis of region, age, sentiment analysis etc. Showcasing this set of slides titled Campaign Performance Dashboard For Brand Equity Tactics Measurement Slides PDF. The topics addressed in these templates are Campaign Performance Dashboard For Brand Equity Tactics Measurement Slides PDF. All the content presented in this PPT design is completely editable. Download it and make adjustments in color, background, font etc. as per your unique business setting.

Dashboard For Real Time Telemarketing Process Management Themes PDF
The following slide highlights the dashboard for real time telesales process management illustrating real time data, employee data, performance, daily data, average handled call vs average answered call, employee ranking, AHT, AvgACW, ASA and hold percentage Showcasing this set of slides titled dashboard for real time telemarketing process management themes pdf The topics addressed in these templates are dashboard for real time telemarketing process management All the content presented in this PPT design is completely editable. Download it and make adjustments in color, background, font etc. as per your unique business setting.
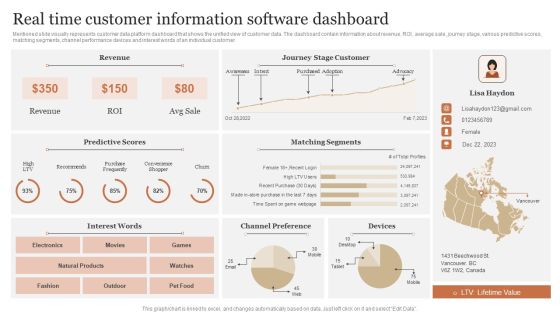
Real Time Customer Information Software Dashboard Portrait PDF
Mentioned slide visually represents customer data platform dashboard that shows the unified view of customer data. The dashboard contain information about revenue, ROI, average sale, journey stage, various predictive scores, matching segments, channel performance devices and interest words of an individual customer. Showcasing this set of slides titled Real Time Customer Information Software Dashboard Portrait PDF. The topics addressed in these templates are Predictive Scores, Matching Segments, Channel Preference. All the content presented in this PPT design is completely editable. Download it and make adjustments in color, background, font etc. as per your unique business setting.
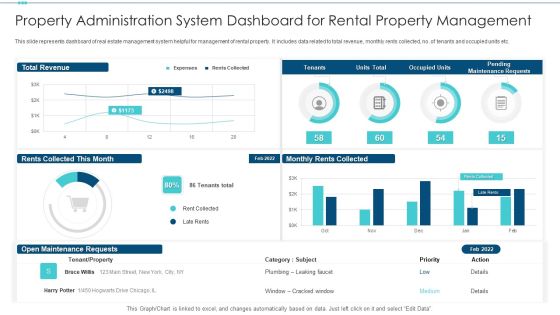
Property Administration System Dashboard For Rental Property Management Inspiration PDF
This slide represents dashboard of real estate management system helpful for management of rental property. It includes data related to total revenue, monthly rents collected, no .of tenants and occupied units etc. Showcasing this set of slides titled property administration system dashboard for rental property management inspiration pdf. The topics addressed in these templates are property administration system dashboard for rental property management. All the content presented in this PPT design is completely editable. Download it and make adjustments in color, background, font etc. as per your unique business setting.

Debt Recovery And Funds Recovery Dashboard Structure PDF
This slide illustrates debt collection and funds recovery dashboard which includes todays contacts, past collectionweeks todays collection by operator and regular collected funds data. It can help businesses in streamlining the process of bad debts recovery.Showcasing this set of slides titled Debt Recovery And Funds Recovery Dashboard Structure PDF The topics addressed in these templates are Debt Recovery, Funds Recovery Dashboard All the content presented in this PPT design is completely editable. Download it and make adjustments in color, background, font etc. as per your unique business setting.

Customer Information Software Dashboard With Churn Risk Information PDF
Following slide visually depicts customer data platform dashboard that showcase all the details of an individual customer in an organized way. Details covered in this dashboard is related to customer interests, top brands purchased, churn risk, customer lifetime value, engagement score etc. Pitch your topic with ease and precision using this Customer Information Software Dashboard With Churn Risk Information PDF. This layout presents information on Customer Lifetime, Engagement Score, Average Spending. It is also available for immediate download and adjustment. So, changes can be made in the color, design, graphics or any other component to create a unique layout.

Business Newsletter Referral Marketing Program Performance KPI Dashboard Formats PDF
This slide represents KPI dashboard designed to track performance of the program conducted to attract new leads at lower cost with the help of existing customers to generate leads that best fit the organization. It includes key metrics such as total revenue generated, monthly recurring revenue, paying customers etc. Showcasing this set of slides titled Business Newsletter Referral Marketing Program Performance KPI Dashboard Formats PDF. The topics addressed in these templates are Dashboard, Paying Customers, Monthly Recurring Revenue, Total Revenue Generated. All the content presented in this PPT design is completely editable. Download it and make adjustments in color, background, font etc. as per your unique business setting.
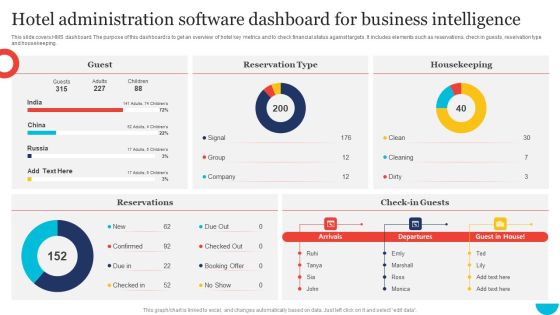
Hotel Administration Software Dashboard For Business Intelligence Infographics PDF
This slide covers HMS dashboard. The purpose of this dashboard is to get an overview of hotel key metrics and to check financial status against targets. It includes elements such as reservations, check in guests, reservation type and housekeeping. Pitch your topic with ease and precision using this Hotel Administration Software Dashboard For Business Intelligence Infographics PDF. This layout presents information on Guest, Housekeeping, Reservation Type. It is also available for immediate download and adjustment. So, changes can be made in the color, design, graphics or any other component to create a unique layout.

Risk Management KPI Dashboard Of Real Estate Company Rules PDF
The following slide exhibits a key performance indicator KPI dashboard which can be used to evaluate the risks involved in real estate business. The KPIss covered in the slide are corporate risk, control performance, open issues etc. Deliver and pitch your topic in the best possible manner with this Risk Management KPI Dashboard Of Real Estate Company Rules PDF. Use them to share invaluable insights on Risk Management KPI Dashboard, Real Estate Company and impress your audience. This template can be altered and modified as per your expectations. So, grab it now.

Digital KPI Dashboard To Track Email Bounce Slides PDF
This slide shows dashboard which can e used by organizations to monitor performance of email. It includes key performance indicators such as traffic status, conversions, behaviors, etc. Pitch your topic with ease and precision using this Digital KPI Dashboard To Track Email Bounce Slides PDF. This layout presents information on Digital Kpi Dashboard, Track Email Bounce. It is also available for immediate download and adjustment. So, changes can be made in the color, design, graphics or any other component to create a unique layout.

Case Administration Dashboard With Resolved Cases Graphics PDF
This slide shows dashboard which can be used to monitor the status of case management solved in the organizations. It includes key performance indicators such as active cases by priority, by subject, by age, by branch, etc. Pitch your topic with ease and precision using this Case Administration Dashboard With Resolved Cases Graphics PDF. This layout presents information on Case Administration Dashboard, Resolved Cases. It is also available for immediate download and adjustment. So, changes can be made in the color, design, graphics or any other component to create a unique layout.
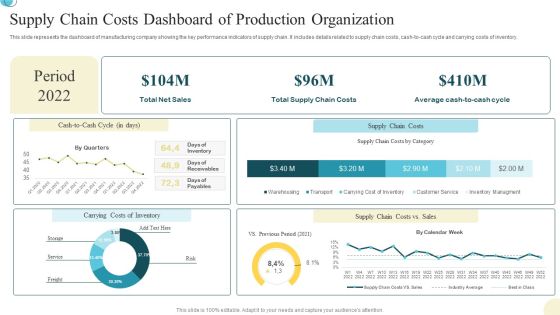
Supply Chain Costs Dashboard Of Production Organization Background PDF
This slide represents the dashboard of manufacturing company showing the key performance indicators of supply chain. It includes details related to supply chain costs, cash to cash cycle and carrying costs of inventory. Pitch your topic with ease and precision using this Supply Chain Costs Dashboard Of Production Organization Background PDF. This layout presents information on Supply Chain Costs, Dashboard Of Production, Organization. It is also available for immediate download and adjustment. So, changes can be made in the color, design, graphics or any other component to create a unique layout.

Energy Efficiency Dashboard To Track Campaign Effectiveness Pictures PDF
This slide consists of a dashboard which presents an energy saving dashboard which can be used to track effectiveness of energy saving program. The key performance indicators relate to energy sources, energy consumption by sectors, energy consumption by sectors etc. Pitch your topic with ease and precision using this Energy Efficiency Dashboard To Track Campaign Effectiveness Pictures PDF. This layout presents information on Energy Sources, Energy Usage, Trend Analysis. It is also available for immediate download and adjustment. So, changes can be made in the color, design, graphics or any other component to create a unique layout.

Dashboard For Tracking Green Financing Activities Themes PDF
This slide presents a finance dashboard to track the progress of sustainability activities based on finance allocations. The key performing indicators are overall progress, energy usage by month, budget allocation and application etc. Showcasing this set of slides titled Dashboard For Tracking Green Financing Activities Themes PDF. The topics addressed in these templates are Activities, Application, Dashboard. All the content presented in this PPT design is completely editable. Download it and make adjustments in color, background, font etc. as per your unique business setting.

Texting Platforms Dashboard Indicating SMS Marketing Metrics Designs PDF
This slide showcase messaging platforms dashboard indicating sms marketing metrics which can be referred by businesses to check the activity of their current texting campaign. It contains information about consumers, plan, send, campaigns, growth, reports, outgoing and incoming.Pitch your topic with ease and precision using this texting platforms dashboard indicating sms marketing metrics designs pdf This layout presents information on texting platforms dashboard indicating sms marketing metrics It is also available for immediate download and adjustment. So, changes can be made in the color, design, graphics or any other component to create a unique layout.
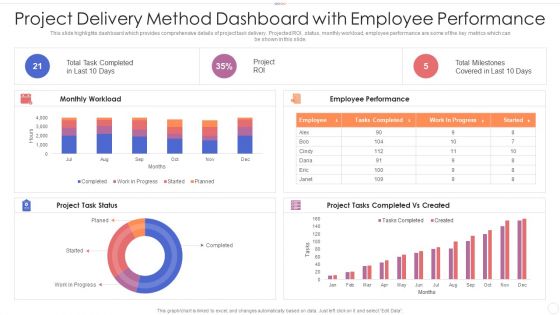
Project Delivery Method Dashboard With Employee Performance Introduction PDF
This slide highlights dashboard which provides comprehensive details of project task delivery. Projected ROI, status, monthly workload, employee performance are some of the key metrics which can be shown in this slide. Showcasing this set of slides titled project delivery method dashboard with employee performance introduction pdf. The topics addressed in these templates are project delivery method dashboard with employee performance. All the content presented in this PPT design is completely editable. Download it and make adjustments in color, background, font etc. as per your unique business setting.
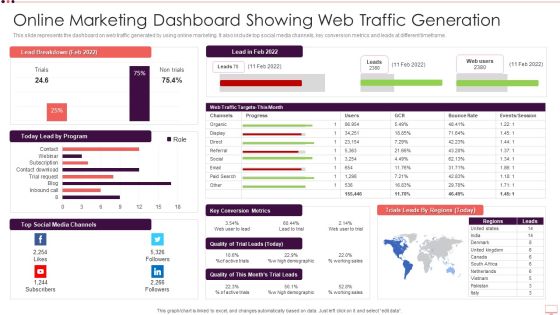
Online Marketing Dashboard Showing Web Traffic Generation Formats PDF
This slide represents the dashboard on web traffic generated by using online marketing. It also include top social media channels, key conversion metrics and leads at different timeframe. Showcasing this set of slides titled Online Marketing Dashboard Showing Web Traffic Generation Formats PDF. The topics addressed in these templates are Online Marketing Dashboard Showing Web Traffic Generation. All the content presented in this PPT design is completely editable. Download it and make adjustments in color, background, font etc. as per your unique business setting.

Customer Attrition Rate Dashboard For Ibn Outsourcing Company Information PDF
This slide shows a Customer Attrition Rate Dashboard with KPIs such as Company Revenue , Customer Attrition Rate in 2021 , Annual Growth Rate , Average Customer Queue Time , Onboarding Process Effectiveness etc. Deliver and pitch your topic in the best possible manner with this customer attrition rate dashboard for ibn outsourcing company information pdf. Use them to share invaluable insights on customer attrition rate dashboard for ibn outsourcing company and impress your audience. This template can be altered and modified as per your expectations. So, grab it now.
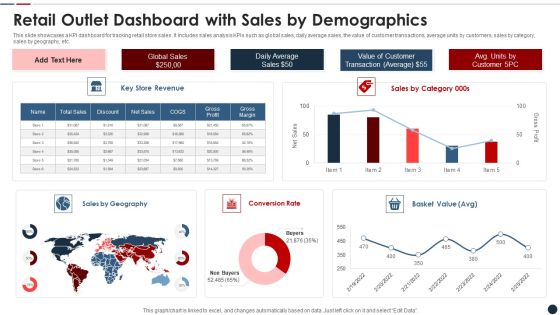
Retail Outlet Dashboard With Sales By Demographics Slides PDF
This slide showcases a KPI dashboard for tracking retail store sales. It includes sales analysis KPIs such as global sales, daily average sales, the value of customer transactions, average units by customers, sales by category, sales by geography, etc. Showcasing this set of slides titled retail outlet dashboard with sales by demographics slides pdf The topics addressed in these templates are Retail outlet dashboard with sales by demographics All the content presented in this PPT design is completely editable. Download it and make adjustments in color, background, font etc. as per your unique business setting.
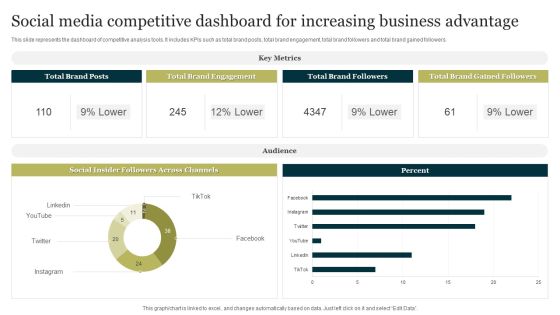
Social Media Competitive Dashboard For Increasing Business Advantage Portrait PDF
This slide represents the dashboard of competitive analysis tools. It includes KPIs such as total brand posts, total brand engagement, total brand followers and total brand gained followers. Pitch your topic with ease and precision using this Social Media Competitive Dashboard For Increasing Business Advantage Portrait PDF. This layout presents information on Social Media Competitive Dashboard, Increasing Business Advantage. It is also available for immediate download and adjustment. So, changes can be made in the color, design, graphics or any other component to create a unique layout.

Six Months Lead Generation Marketing Dashboard Inspiration PDF
The slide carries lead generation dashboard to build deeper understanding of business and customer journey. Various KPIs included are lead values per month, number of leads per month and lead marketing channels. Showcasing this set of slides titled Six Months Lead Generation Marketing Dashboard Inspiration PDF. The topics addressed in these templates are Six Months Lead Generation, Marketing Dashboard. All the content presented in this PPT design is completely editable. Download it and make adjustments in color, background, font etc. as per your unique business setting.

Cybersecurity Dashboard For Abs Healthcare Company Ppt Slides Gridlines PDF
This slide shows a cybersecurity dashboard with KPIs such as total cybersecurity cases in company in 2021, total records stoles, malware cases resolved, operational efficiency, mean time to resolve threats etc. Deliver and pitch your topic in the best possible manner with this cybersecurity dashboard for abs healthcare company ppt slides gridlines pdf. Use them to share invaluable insights on cybersecurity dashboard for abs healthcare company and impress your audience. This template can be altered and modified as per your expectations. So, grab it now.
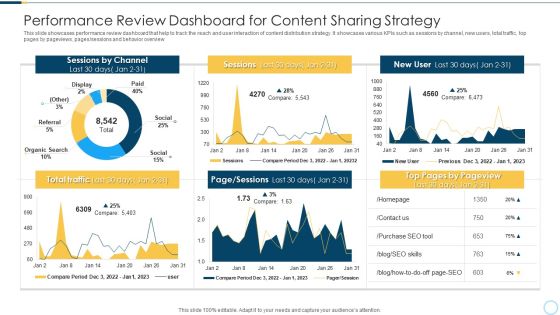
Performance Review Dashboard For Content Sharing Strategy Designs PDF
This slide showcases performance review dashboard that help to track the reach and user interaction of content distribution strategy. It showcases various KPIs such as sessions by channel, new users, total traffic, top pages by pageviews, pages or sessions and behavior overview Showcasing this set of slides titled performance review dashboard for content sharing strategy designs pdf. The topics addressed in these templates are performance review dashboard for content sharing strategy. All the content presented in this PPT design is completely editable. Download it and make adjustments in color, background, font etc. as per your unique business setting.

Food And Beverage Industry Kpi Dashboard Professional PDF
This slide covers the food and beverage analysis dashboard. It include KPIs such as revenue by location, top five expenses by account, revenue by type, top five expenses by department, etc.Showcasing this set of slides titled Food And Beverage Industry Kpi Dashboard Professional PDF. The topics addressed in these templates are Food And Beverage Industry KPI Dashboard. All the content presented in this PPT design is completely editable. Download it and make adjustments in color, background, font etc. as per your unique business setting

Online Audit Dashboard With Ad Cost And Conversions Themes PDF
Following slide outlines digital audit dashboard which will assist the company to track results of all paid campaigns. This dashboard provides information about various KPIs which the auditor can track such as AD cost, clicks, impressions, click through rate, cost per conversion, conversion rate etc. Pitch your topic with ease and precision using this Online Audit Dashboard With Ad Cost And Conversions Themes PDF. This layout presents information on Conversations, Impressions, Cost. It is also available for immediate download and adjustment. So, changes can be made in the color, design, graphics or any other component to create a unique layout.
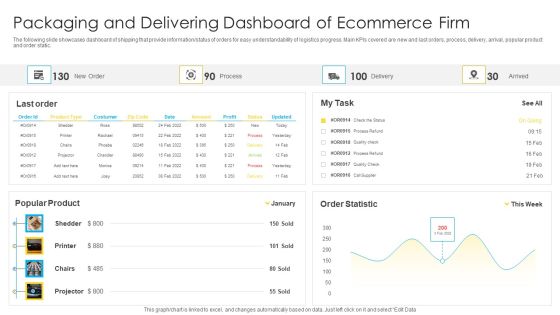
Packaging And Delivering Dashboard Of Ecommerce Firm Slides PDF
The following slide showcases dashboard of shipping that provide information or status of orders for easy understandability of logistics progress. Main KPIs covered are new and last orders, process, delivery, arrival, popular product and order static. Showcasing this set of slides titled Packaging And Delivering Dashboard Of Ecommerce Firm Slides PDF. The topics addressed in these templates are Packaging And Delivering, Dashboard Ecommerce Firm. All the content presented in this PPT design is completely editable. Download it and make adjustments in color, background, font etc. as per your unique business setting.
New Staff Onboarding Process KPI Tracking Dashboard Inspiration PDF
This slide showcase the KPI dashboard for tracking new hire onboarding completion progress. It includes KPIs such as onboarding completion status, employees per office, progress chart, hires starting in current and next week. Showcasing this set of slides titled New Staff Onboarding Process KPI Tracking Dashboard Inspiration PDF. The topics addressed in these templates are New Staff Onboarding Process, KPI Tracking Dashboard. All the content presented in this PPT design is completely editable. Download it and make adjustments in color, background, font etc. as per your unique business setting.

Business Plan Review Dashboard With Task Details Sample PDF
The following slide showcases dashboard of plan review to track KPIs and other relevant details regarding business, department and projects. Key indicators covered are contracts, proposals, documents review, bid date, plan review, completion percentage and priority. Pitch your topic with ease and precision using this Business Plan Review Dashboard With Task Details Sample PDF. This layout presents information on Business Plan Review, Dashboard With Task Details. It is also available for immediate download and adjustment. So, changes can be made in the color, design, graphics or any other component to create a unique layout.
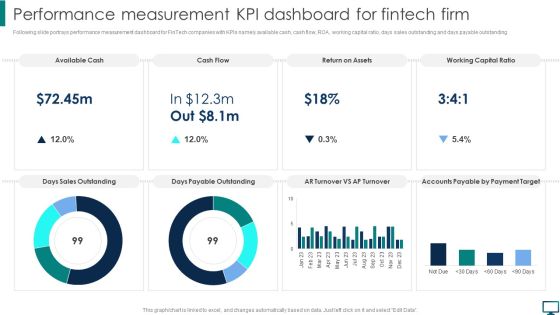
Performance Measurement KPI Dashboard For Fintech Firm Topics PDF
Following slide portrays performance measurement dashboard for FinTech companies with KPIs namely available cash, cash flow, ROA, working capital ratio, days sales outstanding and days payable outstanding. Create an editable Performance Measurement KPI Dashboard For Fintech Firm Topics PDF that communicates your idea and engages your audience. Whether you are presenting a business or an educational presentation, pre designed presentation templates help save time. Performance Measurement KPI Dashboard For Fintech Firm Topics PDF is highly customizable and very easy to edit, covering many different styles from creative to business presentations. Slidegeeks has creative team members who have crafted amazing templates. So, go and get them without any delay.

Dashboard Of Employee Yearly Performance Review For Organization Mockup PDF
This slide shows the dashboard for reviewing the work performance of their employees over the years. It includes KPIs such as absenteeism, overtime hours, training costs, overall labor effectiveness. Showcasing this set of slides titled Dashboard Of Employee Yearly Performance Review For Organization Mockup PDF. The topics addressed in these templates are Dashboard Of Employee, Yearly Performance, Review For Organization. All the content presented in this PPT design is completely editable. Download it and make adjustments in color, background, font etc. as per your unique business setting.

Information Technology Operations Operations Dashboard For Issues Management Infographics PDF
The slide illustrates various KPIs to manage and track IT operations in business. Various elements included in the dashboard are month-wise issue status, types of issues, average resolution time, overall status and resolved issues. Showcasing this set of slides titled Information Technology Operations Operations Dashboard For Issues Management Infographics PDF. The topics addressed in these templates are Information Technology Operations, Operations Dashboard, Issues Management. All the content presented in this PPT design is completely editable. Download it and make adjustments in color, background, font etc. as per your unique business setting.

Supermarket Online Service Delivery And Management Dashboard Formats PDF
This slide shows the online grocery delivery dashboard of various products based on certain metrics and KPIs to achieve grocery retail revenue goals. It includes total orders, total customers total categories, and revenue. Showcasing this set of slides titled Supermarket Online Service Delivery And Management Dashboard Formats PDF. The topics addressed in these templates are Total Revenue, Total Customers, Dashboard. All the content presented in this PPT design is completely editable. Download it and make adjustments in color, background, font etc. as per your unique business setting.

Engineering Performance Metrics Dashboard To Track Pull Requests Background PDF
This slide covers engineering KPI dashboard to track pull request. It involves KPIs such as open time of average pull requests, average comment received, revision rounds, frequency of posting pull requests. Pitch your topic with ease and precision using this Engineering Performance Metrics Dashboard To Track Pull Requests Background PDF. This layout presents information on Dashboard Track Pull Requests, Engineering Performance Metrics. It is also available for immediate download and adjustment. So, changes can be made in the color, design, graphics or any other component to create a unique layout.

Consumer Risk Assessment Dashboard Reporting Ppt Layouts Ideas PDF
This slide showcases the customer risk assessment dashboard with major kpis. It includes reporting risks summary, risk mitigation, risk profile, and detail. It also reflects the risk score and score distribution across different areas and activities. Pitch your topic with ease and precision using this Consumer Risk Assessment Dashboard Reporting Ppt Layouts Ideas PDF. This layout presents information on Risk Summary, Customer Risk Dashboard, Risk Profile. It is also available for immediate download and adjustment. So, changes can be made in the color, design, graphics or any other component to create a unique layout.

KPI Dashboard To Evaluate Corporate Sales Introduction PDF
This slide contains KPI dashboard which can be used by company to track e-commerce sales. It includes kpis such as total orders, order quantity, sales quantity, sales by location, etc. Pitch your topic with ease and precision using this KPI Dashboard To Evaluate Corporate Sales Introduction PDF. This layout presents information on KPI Dashboard, Evaluate Corporate Sales. It is also available for immediate download and adjustment. So, changes can be made in the color, design, graphics or any other component to create a unique layout.

Batch Processing KPI Metrics Dashboard With Rejection Rate Topics PDF
Mentioned slide highlights performance KPI dashboard of batch processing system. The KPIs covered in the slide are batch rejection rate by product, number of reprocessed lots, rejection by product and reasons for the rejection. Pitch your topic with ease and precision using this Batch Processing KPI Metrics Dashboard With Rejection Rate Topics PDF. This layout presents information on Batch Processing KPI Metrics, Dashboard Rejection Rate. It is also available for immediate download and adjustment. So, changes can be made in the color, design, graphics or any other component to create a unique layout.

Leadership Strategy Dashboard To Track Employee Performance Brochure PDF
This slide depicts a strategic leadership dashboard which tracks employee performance as they assist in measuring the optimal functioning and successful coordination of team members within the organization. The major kpis are average result areas, scores, review by leader etc. Showcasing this set of slides titled Leadership Strategy Dashboard To Track Employee Performance Brochure PDF. The topics addressed in these templates are Leadership Strategy Dashboard, Track Employee Performance. All the content presented in this PPT design is completely editable. Download it and make adjustments in color, background, font etc. as per your unique business setting.

Monthly Social Media Dashboard Ppt PowerPoint Presentation Infographics Files
This is a monthly social media dashboard ppt powerpoint presentation infographics files. This is a four stage process. The stages in this process are marketing, business, financial, data analysis, management.

Agile Software Development Dashboard With Sprint Progress Diagrams PDF
The following slide displays the dashboard for agile software development. The dashboard highlights multiple sprints of the web designing team, research and development team, customer support team etc. along with some details such as story points, sprint progress, work completed, time elapsed etc. Deliver and pitch your topic in the best possible manner with this agile software development dashboard with sprint progress diagrams pdf. Use them to share invaluable insights on customer support team, research, development team, web designing team and impress your audience. This template can be altered and modified as per your expectations. So, grab it now.
Modifying Banking Functionalities Dashboard Tracking Customer Retention Rate Information PDF
This slide contains dashboard that will allow bank to track the retention rate of customer within span of 6 months. Number of accounts that are successfully retained by the bank. It will also bank in tracking accounts that are cancelled. Deliver and pitch your topic in the best possible manner with this enhancing financial institution operations dashboard tracking customer retention rate ideas pdf. Use them to share invaluable insights on dashboard tracking customer retention rate and impress your audience. This template can be altered and modified as per your expectations. So, grab it now.

Evolving BI Infrastructure Addressing Cyber Risk Management Dashboard Background PDF
This slide portrays information regarding the dashboard that firm will use to manage cyber risks. The dashboard will provide clear picture of risk prevailing and how they are treated to technical engineers and board level executives. Deliver an awe inspiring pitch with this creative evolving bi infrastructure addressing cyber risk management dashboard background pdf bundle. Topics like risk rating breakdown, risk heat map, action plan breakdown, risk analysis progress can be discussed with this completely editable template. It is available for immediate download depending on the needs and requirements of the user.

Dashboard Milk Production With Supply Demand And Prices Pictures PDF
This slide shows the dashboards which includes the information related to Milk production in various regions by the company. It also includes Supply and demand related to milk production in US and Prices fluctuations. Deliver an awe inspiring pitch with this creative dashboard milk production with supply demand and prices pictures pdf bundle. Topics like dashboard milk production with supply demand and prices can be discussed with this completely editable template. It is available for immediate download depending on the needs and requirements of the user.
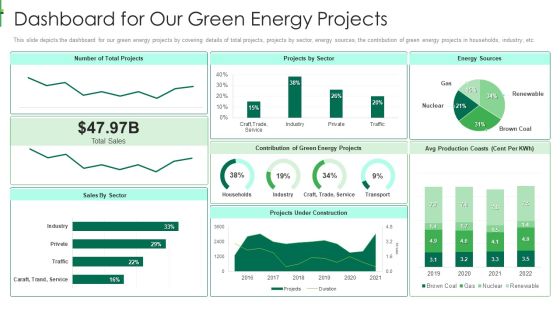
Sustainable Energy Dashboard For Our Green Energy Projects Infographics PDF
This slide depicts the dashboard for our green energy projects by covering details of total projects, projects by sector, energy sources, the contribution of green energy projects in households, industry, etc.Deliver and pitch your topic in the best possible manner with this sustainable energy dashboard for our green energy projects infographics pdf Use them to share invaluable insights on dashboard for our green energy projects and impress your audience. This template can be altered and modified as per your expectations. So, grab it now.

Problem Administration Kpi Dashboard With Bugs Status Ideas PDF
This slide covers dashboard that will help the project managers to keep the track of the bugs faced by the team members during the IT project. Pitch your topic with ease and precision using this problem administration kpi dashboard with bugs status ideas pdf. This layout presents information on problem administration kpi dashboard with bugs status. It is also available for immediate download and adjustment. So, changes can be made in the color, design, graphics or any other component to create a unique layout.
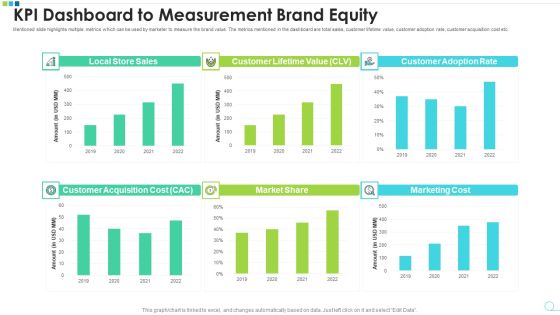
KPI Dashboard To Measurement Brand Equity Microsoft PDF
Mentioned slide highlights multiple metrics which can be used by marketer to measure the brand value. The metrics mentioned in the dashboard are total sales, customer lifetime value, customer adoption rate, customer acquisition cost etc. Pitch your topic with ease and precision using this kpi dashboard to measurement brand equity microsoft pdf. This layout presents information on kpi dashboard to measurement brand equity. It is also available for immediate download and adjustment. So, changes can be made in the color, design, graphics or any other component to create a unique layout.

Pharmaceutical Sales Project Periodically Performance Dashboard Brochure PDF
The following slide highlights the pharmaceutical sales project quarterly performance dashboard illustrating sales by area, prescribed drugs sale , non prescribed drugs sale, prescribed drugs performance, quarterly sales by condition, quarterly sales and profit by channel Showcasing this set of slides titled pharmaceutical sales project periodically performance dashboard brochure pdf. The topics addressed in these templates are pharmaceutical sales project periodically performance dashboard. All the content presented in this PPT design is completely editable. Download it and make adjustments in color, background, font etc. as per your unique business setting.

Project Budget Planning Dashboard With Revenue And Expenses Ideas PDF
This slide covers dashboard which will help project managers in analyzing profit plan, project profits, total profit, expenses, travel costs, total revenue, wage expenses and travel expenses. Showcasing this set of slides titled project budget planning dashboard with revenue and expenses ideas pdf. The topics addressed in these templates are project budget planning dashboard with revenue and expenses. All the content presented in this PPT design is completely editable. Download it and make adjustments in color, background, font etc. as per your unique business setting.

Competency Management Dashboard For Team Performance Assessment Topics PDF
This slide showcases team performance assessment and proficiency management dashboard. It provides information about abandoned, draft, published, elapsed, completed, adaptability, critical thinking, planning, etc. Persuade your audience using this competency management dashboard for team performance assessment topics pdf. This PPT design covers three stages, thus making it a great tool to use. It also caters to a variety of topics including competency management dashboard for team performance assessment. Download this PPT design now to present a convincing pitch that not only emphasizes the topic but also showcases your presentation skills.
Supplier Compensation Due Tracking Dashboard With Paid Invoices Topics PDF
This slide showcases dashboard that can help organization to track the outstanding payment of different vendors and take timely action in case of delay. Its key elements are due by age summary, top 5 vendor by purchases, top 5 vendors by amount due and total invoice vs paid invoices. Pitch your topic with ease and precision using this supplier compensation due tracking dashboard with paid invoices topics pdf. This layout presents information on supplier compensation due tracking dashboard with paid invoices. It is also available for immediate download and adjustment. So, changes can be made in the color, design, graphics or any other component to create a unique layout.
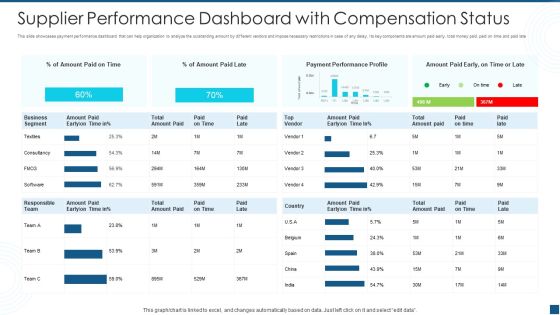
Supplier Performance Dashboard With Compensation Status Themes PDF
This slide showcases payment performance dashboard that can help organization to analyze the outstanding amount by different vendors and impose necessary restrictions in case of any delay. Its key components are amount paid early, total money paid, paid on time and paid late. Pitch your topic with ease and precision using this supplier performance dashboard with compensation status themes pdf. This layout presents information on supplier performance dashboard with compensation status. It is also available for immediate download and adjustment. So, changes can be made in the color, design, graphics or any other component to create a unique layout.
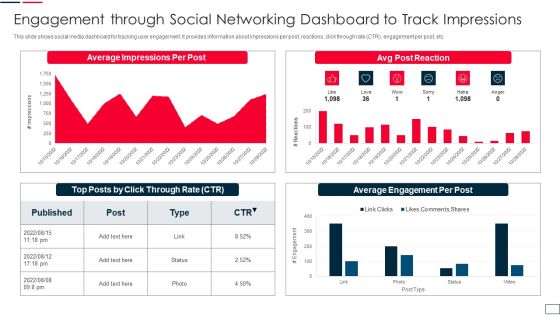
Engagement Through Social Networking Dashboard To Track Impressions Template PDF
This slide shows social media dashboard for tracking user engagement. It provides information about impressions per post, reactions, click through rate CTR, engagement per post, etc. Showcasing this set of slides titled engagement through social networking dashboard to track impressions template pdf. The topics addressed in these templates are engagement through social networking dashboard to track impressions. All the content presented in this PPT design is completely editable. Download it and make adjustments in color, background, font etc. as per your unique business setting.
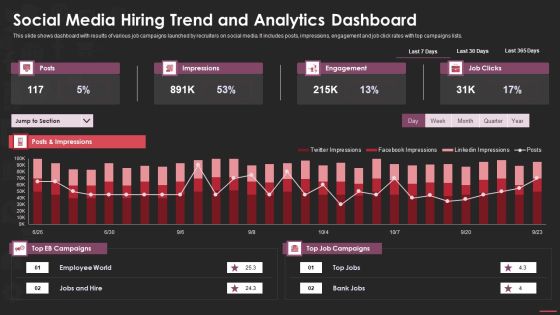
Social Media Hiring Trend And Analytics Dashboard Microsoft PDF
This slide shows dashboard with results of various job campaigns launched by recruiters on social media. It includes posts, impressions, engagement and job click rates with top campaigns lists. Pitch your topic with ease and precision using this social media hiring trend and analytics dashboard microsoft pdf. This layout presents information on social media hiring trend and analytics dashboard. It is also available for immediate download and adjustment. So, changes can be made in the color, design, graphics or any other component to create a unique layout.

Cyber Safety Incident Management Cyber Threats Management Dashboard Professional PDF
This slide portrays information regarding the dashboard that firm will use to manage cyber threats. The dashboard will provide clear picture of threats risks prevailing and how they are treated to technical engineers and board level executives. Deliver and pitch your topic in the best possible manner with this cyber safety incident management cyber threats management dashboard professional pdf. Use them to share invaluable insights on risk rating breakdown, risk heat map, action plan breakdown and impress your audience. This template can be altered and modified as per your expectations. So, grab it now.

Customer Issues Dashboard With User Experience Performance Graphics PDF
This slide illustrates Customer Issues dashboard with user experience performance benefiting companies in taking decisions according to customer trends. It also includes information about website net promoter score, customer relationship drivers, customer satisfaction CSAT, customer support and orders. Showcasing this set of slides titled customer issues dashboard with user experience performance graphics pdf. The topics addressed in these templates are customer issues dashboard with user experience performance. All the content presented in this PPT design is completely editable. Download it and make adjustments in color, background, font etc. as per your unique business setting.
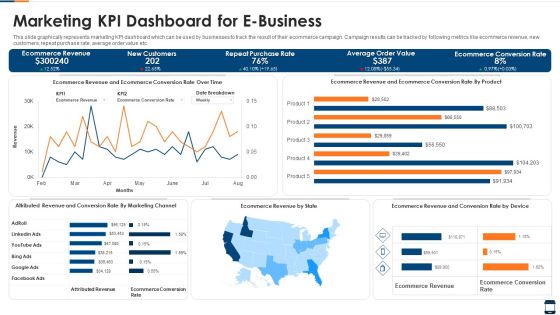
Marketing KPI Dashboard For E Business Brochure PDF
This slide graphically represents marketing KPI dashboard which can be used by businesses to track the result of their ecommerce campaign. Campaign results can be tracked by following metrics like ecommerce revenue, new customers, repeat purchase rate, average order value etc. Showcasing this set of slides titled marketing kpi dashboard for e business brochure pdf. The topics addressed in these templates are marketing kpi dashboard for e business. All the content presented in this PPT design is completely editable. Download it and make adjustments in color, background, font etc. as per your unique business setting.
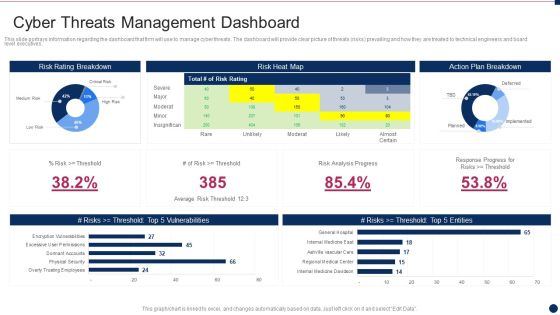
Threat Management At Workplace Cyber Threats Management Dashboard Information Pdf
This slide portrays information regarding the dashboard that firm will use to manage cyber threats. The dashboard will provide clear picture of threats risks prevailing and how they are treated to technical engineers and board level executives. Deliver an awe inspiring pitch with this creative threat management at workplace cyber threats management dashboard information pdf bundle. Topics like risk rating breakdown, risk heat map, action plan breakdown can be discussed with this completely editable template. It is available for immediate download depending on the needs and requirements of the user.

Property Leasing Dashboard Depicting Sale And Rent Analysis Diagrams PDF
This slide shows real estate leasing dashboard depicting sale and rent analysis which can be referred by property managers to manage various listing. It includes information about monthly stats of rent and sales, total proceeds, monthly target, rental properties, etc.Showcasing this set of slides titled property leasing dashboard depicting sale and rent analysis diagrams pdf The topics addressed in these templates are property leasing dashboard depicting sale and rent analysis All the content presented in this PPT design is completely editable. Download it and make adjustments in color, background, font etc. as per your unique business setting.

Market Research Project Dashboard For Measuring Brand Awareness Rules PDF
Mentioned slide delineates research program dashboard which can be used by marketers for measuring brand awareness. This dashboard includes various elements such as celebrity analysis, top branding themes etc. Pitch your topic with ease and precision using this market research project dashboard for measuring brand awareness rules pdf. This layout presents information on brand awareness, celebrity analysis, advertisement. It is also available for immediate download and adjustment. So, changes can be made in the color, design, graphics or any other component to create a unique layout.

Dashboard Of Project Risk Evaluation By Category Guidelines PDF
The slide highlights the dashboard of project risk assessment by category depicting risk heat map, risk priority map, top risks, control status by risk policy and control status to monitor the current and potential risksShowcasing this set of slides titled dashboard of project risk evaluation by category guidelines pdf The topics addressed in these templates are dashboard of project risk evaluation by category All the content presented in this PPT design is completely editable. Download it and make adjustments in color, background, font etc. as per your unique business setting.

Dashboard Of Project Risk Evaluation With Risk Rating Pictures PDF
The slide highlights the dashboard of project risk assessment with risk rating illustrating total risks, open risk, improving, closed risk, mitigated risk, residual risk, risk rating, inherent risk, control risk and impact probability matrixPitch your topic with ease and precision using this dashboard of project risk evaluation with risk rating pictures pdf This layout presents information on dashboard of project risk evaluation with risk rating It is also available for immediate download and adjustment. So, changes can be made in the color, design, graphics or any other component to create a unique layout.

Project Risk Evaluation Dashboard With Risk Map Themes PDF
The slide highlights the project risk assessment dashboard with risk map illustrating risk identified, project risk, risk type and outcome vs impact map to find the risk on the basis of priority Showcasing this set of slides titled project risk evaluation dashboard with risk map themes pdf The topics addressed in these templates are project risk evaluation dashboard with risk map All the content presented in this PPT design is completely editable. Download it and make adjustments in color, background, font etc. as per your unique business setting.
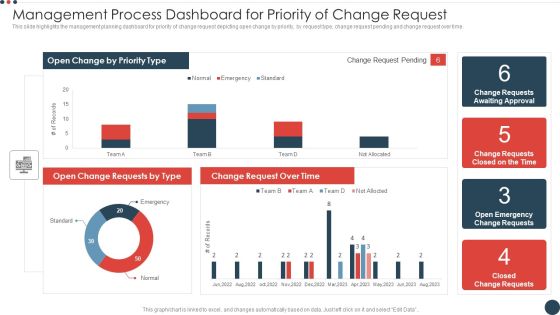
Management Process Dashboard For Priority Of Change Request Demonstration PDF
This slide highlights the management planning dashboard for priority of change request depicting open change by priority, by request type, change request pending and change request over time. Pitch your topic with ease and precision using this management process dashboard for priority of change request demonstration pdf. This layout presents information on management process dashboard for priority of change request. It is also available for immediate download and adjustment. So, changes can be made in the color, design, graphics or any other component to create a unique layout.

Creditors Dashboard For Enterprise Financial Debt Restructuring Brochure PDF
This slide showcases dashboard for accounts payable that can help company to keep track of outstanding payments of each creditor before indulging into process of enterprise finance debt restructuring. Its key elements are creditors days, payments due age summary, top 5 creditors and total invoices vs paid invoice. Deliver an awe inspiring pitch with this creative Creditors Dashboard For Enterprise Financial Debt Restructuring Brochure PDF bundle. Topics like Creditors Dashboard For Enterprise Financial Debt Restructuring can be discussed with this completely editable template. It is available for immediate download depending on the needs and requirements of the user.
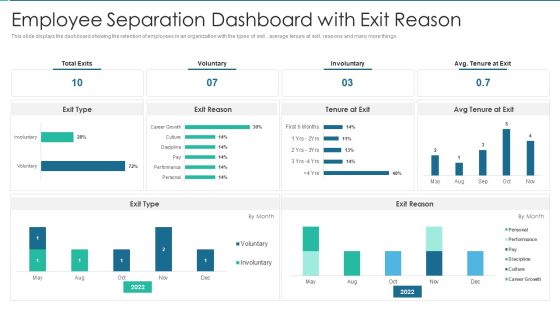
Employee Separation Dashboard With Exit Reason Rules PDF
This slide displays the dashboard showing the retention of employees in an organization with the types of exit , average tenure at exit, reasons and many more things. Pitch your topic with ease and precision using this Employee Separation Dashboard With Exit Reason Rules PDF This layout presents information on Employee Separation Dashboard With Exit Reason It is also available for immediate download and adjustment. So, changes can be made in the color, design, graphics or any other component to create a unique layout.
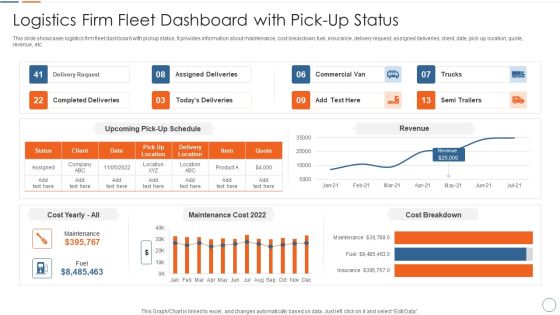
Logistics Firm Fleet Dashboard With Pick Up Status Introduction PDF
This slide showcases logistics firm fleet dashboard with pickup status. It provides information about maintenance, cost breakdown, fuel, insurance, delivery request, assigned deliveries, client, date, pick up location, quote, revenue, etc. Pitch your topic with ease and precision using this Logistics Firm Fleet Dashboard With Pick Up Status Introduction PDF. This layout presents information on Logistics Firm Fleet Dashboard With Pick Up Status. It is also available for immediate download and adjustment. So, changes can be made in the color, design, graphics or any other component to create a unique layout.
 Home
Home