AI PPT Maker
Templates
PPT Bundles
Design Services
Business PPTs
Business Plan
Management
Strategy
Introduction PPT
Roadmap
Self Introduction
Timelines
Process
Marketing
Agenda
Technology
Medical
Startup Business Plan
Cyber Security
Dashboards
SWOT
Proposals
Education
Pitch Deck
Digital Marketing
KPIs
Project Management
Product Management
Artificial Intelligence
Target Market
Communication
Supply Chain
Google Slides
Research Services
 One Pagers
All Categories
-
Home
- Customer Favorites
- dashboard
dashboard

Data Management Process Automation To Reduce Organizational Operating Cost Pictures PDF
Following slide provide insight about automation of data management process for reducing reporting errors. It includes components such as data quality, automated data integration, automated reporting and master data management.Showcasing this set of slides titled Data Management Process Automation To Reduce Organizational Operating Cost Pictures PDF. The topics addressed in these templates are Data Quality, Data Integration, Automated Reporting, Master Data Management. All the content presented in this PPT design is completely editable. Download it and make adjustments in color, background, font etc. as per your unique business setting.

Data Analytics IT Phases Of Data Science Model Planning Ideas PDF
This slide represents the model planning phase in data science and shows its tools, such as SQL Analysis Service, R, and SAS or ACCESS. This is a data analytics it phases of data science model planning ideas pdf template with various stages. Focus and dispense information on three stages using this creative set, that comes with editable features. It contains large content boxes to add your information on topics like sql analysis services, r, sas or access. You can also showcase facts, figures, and other relevant content using this PPT layout. Grab it now.
Data Analytics IT Data Science In Healthcare Department Ppt Professional Icon PDF
This slide depicts the role of data science in healthcare departments and its benefits in different ways, such as image analysis, drug discovery, genetics and Genomics, predictive diagnosis, and NLP. Presenting data analytics it data science in healthcare department ppt professional icon pdf to provide visual cues and insights. Share and navigate important information on five stages that need your due attention. This template can be used to pitch topics like medical image analysis, drug discovery, genetics and genomics, predictive diagnosis, natural language processing. In addtion, this PPT design contains high resolution images, graphics, etc, that are easily editable and available for immediate download.

Enterprise Market Data Analysis Ppt PowerPoint Presentation Inspiration Gridlines Cpb
Presenting this set of slides with name enterprise market data analysis ppt powerpoint presentation inspiration gridlines cpb. This is an editable Powerpoint seven stages graphic that deals with topics like enterprise market data analysis to help convey your message better graphically. This product is a premium product available for immediate download and is 100 percent editable in Powerpoint. Download this now and use it in your presentations to impress your audience.

Social Platforms Data Analysis Usage By Digital Marketing Companies Data Clipart PDF
This slide represents statistical data related to use of various social media platforms by digital marketing company for customer engagement. It includes use of various social media platforms such as Instagram, facebook, twitter, you tube etc. for customer engagement. Pitch your topic with ease and precision using this Social Platforms Data Analysis Usage By Digital Marketing Companies Data Clipart PDF. This layout presents information on Social Platforms Data Analysis, Digital Marketing Companies Data. It is also available for immediate download and adjustment. So, changes can be made in the color, design, graphics or any other component to create a unique layout.
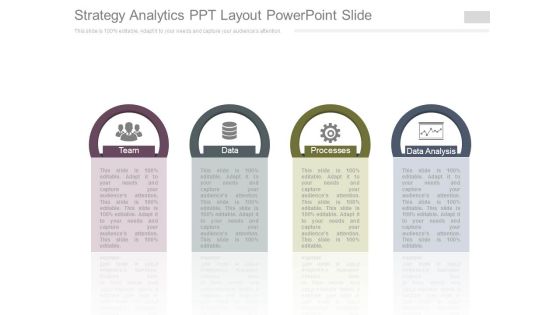
Strategy Analytics Ppt Layout Powerpoint Slide
This is a strategy analytics ppt layout powerpoint slide. This is a four stage process. The stages in this process are team, data, processes, data analysis.
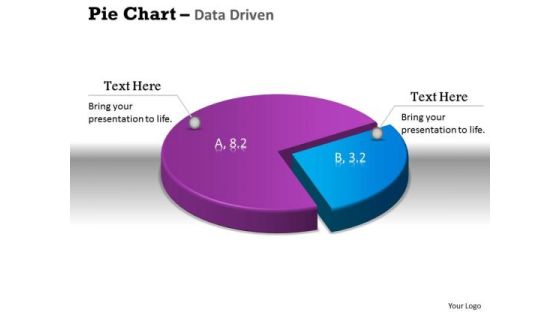
Data Analysis Excel 3d Pie Chart Shows Relative Size Of PowerPoint Templates
Get The Doers Into Action. Activate Them With Our data analysis excel 3d pie chart shows relative size of Powerpoint Templates.

Data Analysis Excel Driven Percentage Breakdown Pie Chart PowerPoint Slides Templates
Be A Donor Of Great Ideas. Display Your Charity On Our data analysis excel driven percentage breakdown pie chart powerpoint slides Templates.

Data Analysis Excel Driven Pie Chart For Business Stratregy PowerPoint Slides Templates
Open Up Doors That Lead To Success. Our data analysis excel driven pie chart for business stratregy powerpoint slides Templates Provide The Handles.
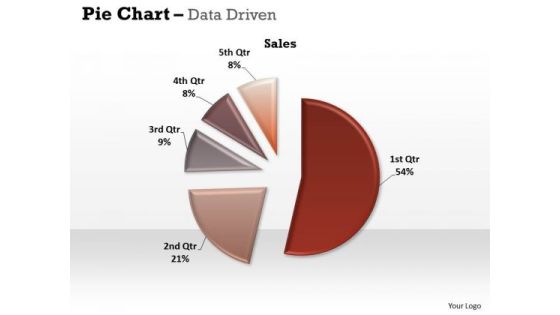
Data Analysis Excel Driven Pie Chart For Easy Comparison PowerPoint Slides Templates
Our data analysis excel driven pie chart for easy comparison powerpoint slides Templates Abhor Doodling. They Never Let The Interest Flag.
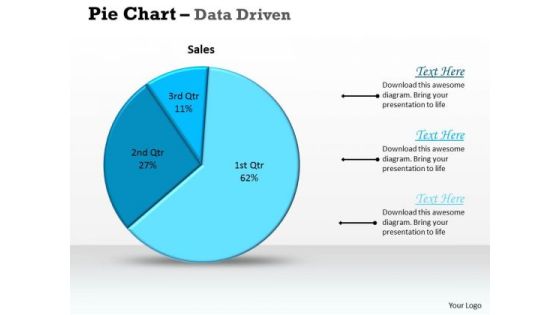
Data Analysis Excel Driven Pie Chart For Sales Process PowerPoint Slides Templates
Deliver The Right Dose With Our data analysis excel driven pie chart for sales process powerpoint slides Templates . Your Ideas Will Get The Correct Illumination.
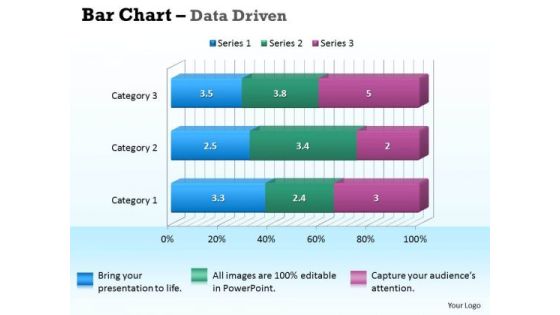
Data Analysis In Excel 3d Bar Chart For Business Information PowerPoint Templates
Our data analysis in excel 3d bar chart for business information Powerpoint Templates Deliver At Your Doorstep. Let Them In For A Wonderful Experience.
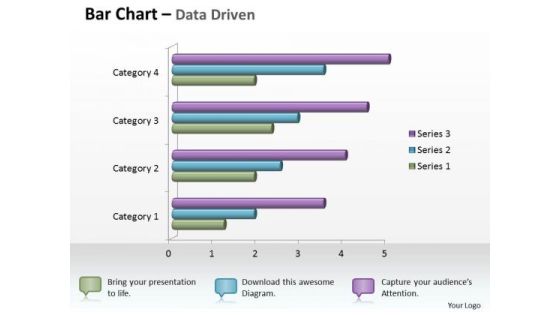
Data Analysis In Excel 3d Bar Chart For Business Statistics PowerPoint Templates
Knock On The Door To Success With Our data analysis in excel 3d bar chart for business statistics Powerpoint Templates . Be Assured Of Gaining Entry.

Data Analysis In Excel 3d Bar Chart For Business Trends PowerPoint Templates
Connect The Dots With Our data analysis in excel 3d bar chart for business trends Powerpoint Templates . Watch The Whole Picture Clearly Emerge.

Data Analysis In Excel 3d Bar Chart For Comparison Of Time Series PowerPoint Templates
Double Your Chances With Our data analysis in excel 3d bar chart for comparison of time series Powerpoint Templates . The Value Of Your Thoughts Will Increase Two-Fold.
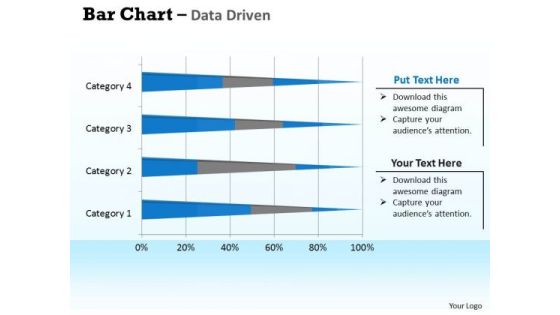
Data Analysis In Excel 3d Bar Chart For Interpretation PowerPoint Templates
Double Up Our data analysis in excel 3d bar chart for interpretation Powerpoint Templates With Your Thoughts. They Will Make An Awesome Pair.

Data Analysis In Excel 3d Column Chart For Sets Of Information PowerPoint Templates
Double The Impact With Our data analysis in excel 3d column chart for sets of information Powerpoint Templates . Your Thoughts Will Have An Imposing Effect.
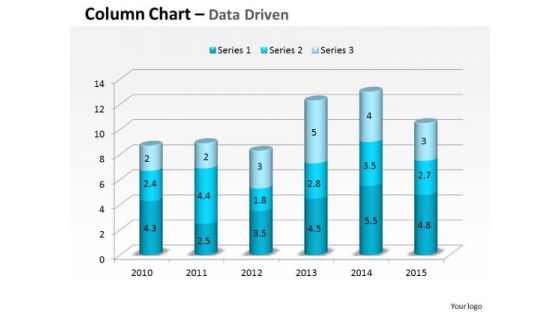
Data Analysis In Excel 3d Compare Yearly Business Performance PowerPoint Templates
Plan For All Contingencies With Our data analysis in excel 3d compare yearly business performance Powerpoint Templates . Douse The Fire Before It Catches.
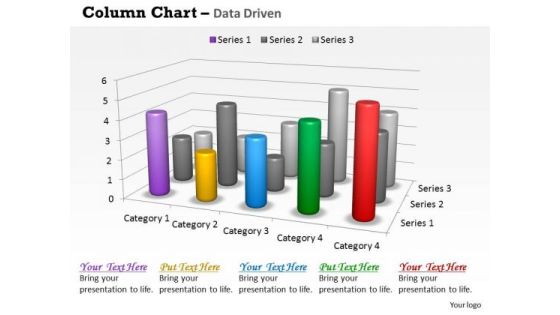
Data Analysis In Excel 3d Survey For Sales Chart PowerPoint Templates
Good Camaraderie Is A Key To Teamwork. Our data analysis in excel 3d survey for sales chart Powerpoint Templates Can Be A Cementing Force.
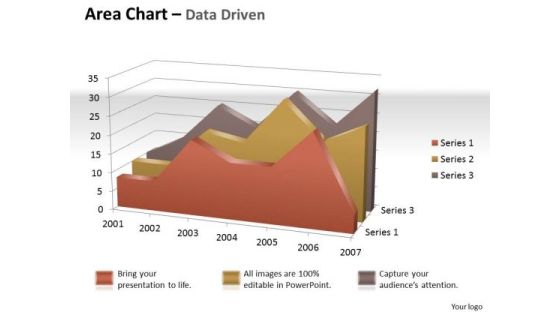
Data Analysis In Excel 3d Visual Display Of Area Chart PowerPoint Templates
Brace Yourself, Arm Your Thoughts. Prepare For The Hustle With Our data analysis in excel 3d visual display of area chart Powerpoint Templates .

Data Analysis In Excel Area Chart For Business Process PowerPoint Templates
Your Grasp Of Economics Is Well Known. Help Your Audience Comprehend Issues With Our data analysis in excel area chart for business process Powerpoint Templates .

Data Analysis In Excel Column Chart For Business Project PowerPoint Templates
Edit Your Work With Our data analysis in excel column chart for business project Powerpoint Templates . They Will Help You Give The Final Form.

Data Analysis In Excel Column Chart Of Various Fields PowerPoint Templates
Land The Idea With Our data analysis in excel column chart of various fields Powerpoint Templates . Help It Grow With Your Thoughts.
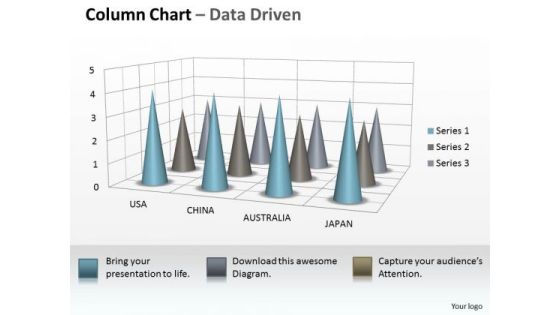
Data Analysis On Excel 3d Chart To Incorporate Business Information PowerPoint Templates
Our data analysis on excel 3d chart to incorporate business information Powerpoint Templates Allow You To Do It With Ease. Just Like Picking The Low Hanging Fruit.

Data Analysis On Excel 3d Chart To Monitor Business Process PowerPoint Templates
Make Some Dough With Our data analysis on excel 3d chart to monitor business process Powerpoint Templates . Your Assets Will Rise Significantly.
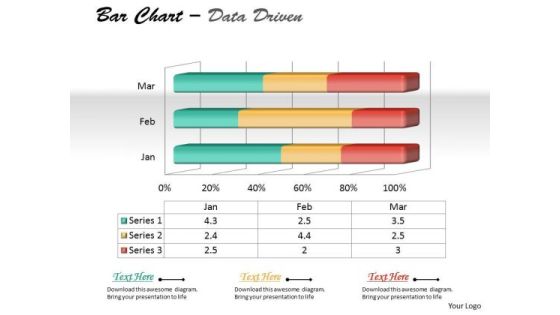
Data Analysis On Excel 3d Chart To Represent Quantitative Differences PowerPoint Templates
Draft It Out On Our data analysis on excel 3d chart to represent quantitative differences Powerpoint Templates . Give The Final Touches With Your Ideas.

Data Analysis On Excel 3d Chart With Sets Of PowerPoint Templates
Reduce The Drag With Our data analysis on excel 3d chart with sets of Powerpoint Templates . Give More Lift To Your Thoughts.
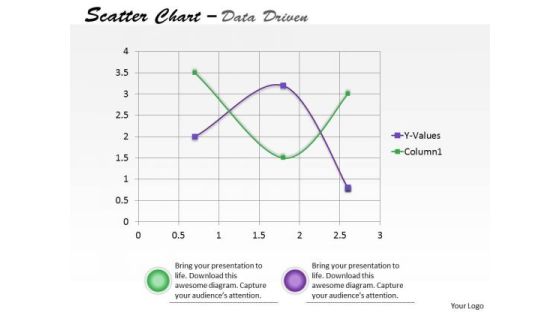
Data Analysis On Excel Driven Scatter Chart To Predict Future Movements PowerPoint Slides Templates
Our data analysis on excel driven scatter chart to predict future movements powerpoint slides Templates Enjoy Drama. They Provide Entertaining Backdrops.

Data Analysis On Excel Driven Sets Of Business Information PowerPoint Slides Templates
Break The Deadlock With Our data analysis on excel driven sets of business information powerpoint slides Templates . Let The Words Start To Flow.

Data Analysis On Excel Driven Stacked Area Chart PowerPoint Slides Templates
Be The Dramatist With Our data analysis on excel driven stacked area chart powerpoint slides Templates . Script Out The Play Of Words.

Data Analysis On Excel Driven Stock Chart For Business Growth PowerPoint Slides Templates
Add Some Dramatization To Your Thoughts. Our data analysis on excel driven stock chart for business growth powerpoint slides Templates Make Useful Props.
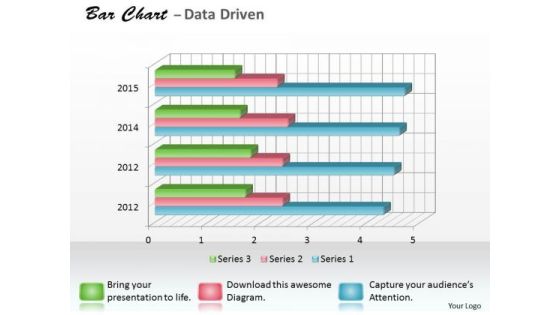
Data Analysis Programs 3d Bar Chart For Research In Statistics PowerPoint Templates
Draw It Out On Our data analysis programs 3d bar chart for research in statistics Powerpoint Templates . Provide Inspiration To Your Colleagues.
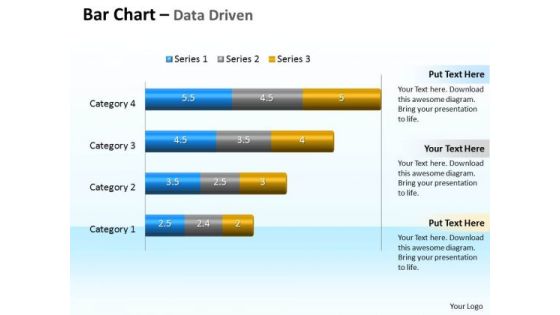
Data Analysis Programs 3d Bar Chart To Compare Categories PowerPoint Templates
Discover Decisive Moments With Our data analysis programs 3d bar chart to compare categories Powerpoint Templates . They Help Make That Crucial Difference.
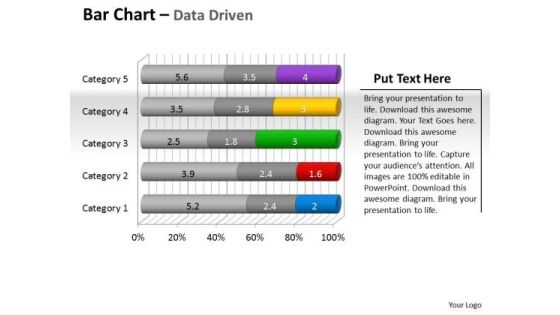
Data Analysis Programs 3d Bar Chart To Put Information PowerPoint Templates
Draw Up Your Agenda On Our data analysis programs 3d bar chart to put information Powerpoint Templates . Coax Your Audience Into Acceptance.
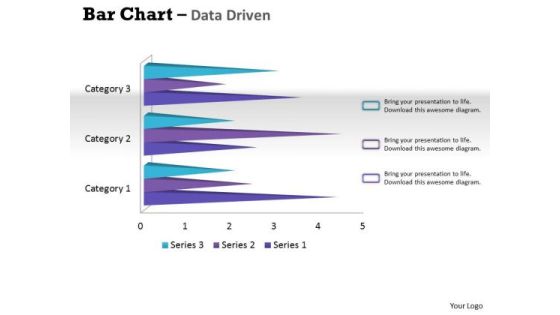
Data Analysis Techniques 3d Bar Chart For Financial Solutions PowerPoint Templates
Make Your Dreams A Reality With Our data analysis techniques 3d bar chart for financial solutions Powerpoint Templates . Your Ideas Will Begin To Take Shape.
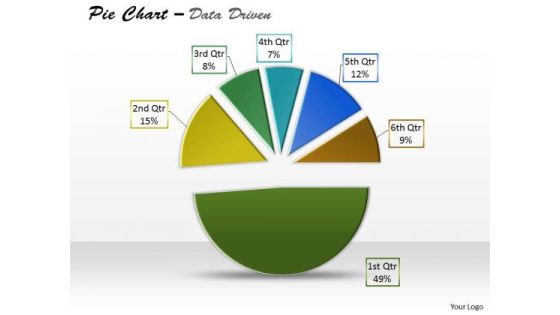
Data Analysis Template Driven Express Business Facts Pie Chart PowerPoint Slides Templates
Display Your Drive On Our data analysis template driven express business facts pie chart powerpoint slides Templates . Invigorate The Audience With Your Fervor.

Data Analysis Template Driven Ineract With Stock Chart PowerPoint Slides Templates
Drive Your Passion With Our data analysis template driven ineract with stock chart powerpoint slides Templates . Steer Yourself To Achieve Your Aims.

Data Analysis Template Driven Line Chart Business Graph PowerPoint Slides Templates
Bottle Your Thoughts In Our data analysis template driven line chart business graph powerpoint slides Templates . Pass It Around For Your Audience To Sip.
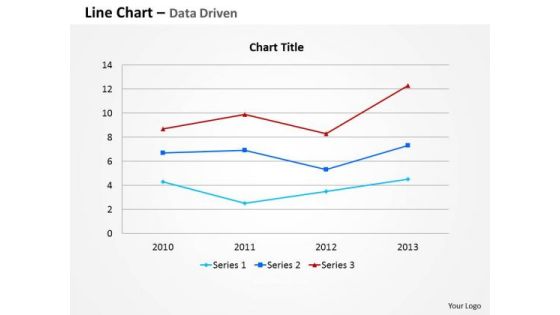
Data Analysis Template Driven Line Chart For Business Information PowerPoint Slides Templates
Your Thoughts Are Dripping With Wisdom. Lace It With Our data analysis template driven line chart for business information powerpoint slides Templates .
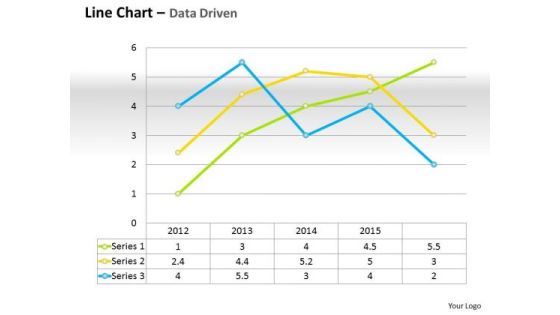
Data Analysis Template Driven Line Chart For Business Performance PowerPoint Slides Templates
Do Not Allow Things To Drift. Ring In Changes With Our data analysis template driven line chart for business performance powerpoint slides Templates .
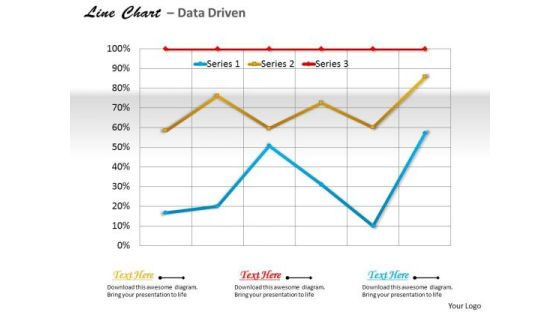
Data Analysis Template Driven Line Chart For Business Trends PowerPoint Slides Templates
Use Our data analysis template driven line chart for business trends powerpoint slides Templates As The Bit. Drill Your Thoughts Into Their Minds.
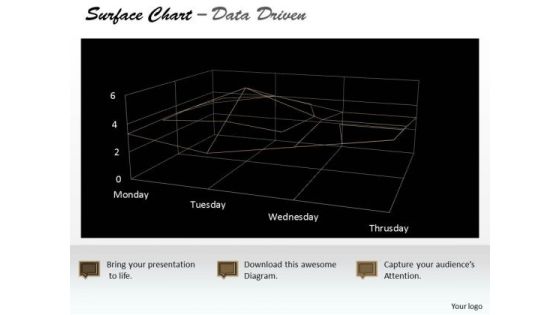
Data Analysis Template Driven Surface Chart Indicating Areas PowerPoint Slides Templates
Highlight Your Drive With Our data analysis template driven surface chart indicating areas powerpoint slides Templates . Prove The Fact That You Have Control.
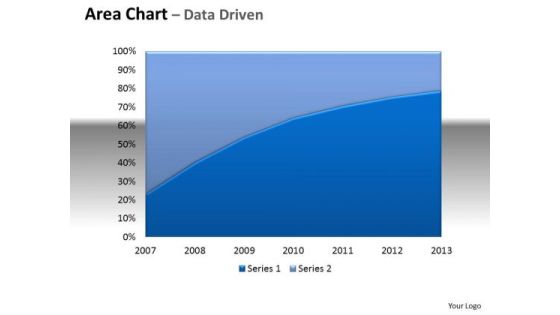
Financial Data Analysis Area Chart With Plotted Line Center PowerPoint Templates
Be The Doer With Our financial data analysis area chart with plotted line center Powerpoint Templates . Put Your Thoughts Into Practice.
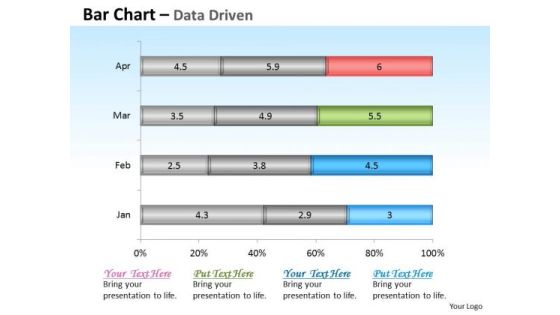
Financial Data Analysis Driven Base Bar Chart Design PowerPoint Slides Templates
Get The Domestics Right With Our financial data analysis driven base bar chart design powerpoint slides Templates . Create The Base For Thoughts To Grow.
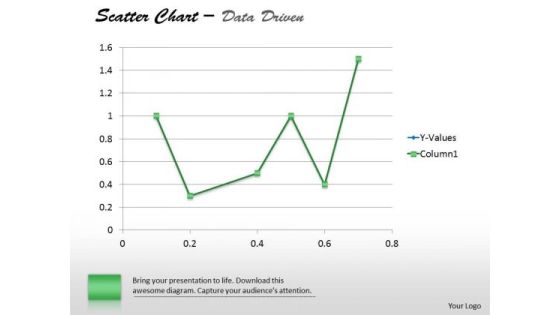
Financial Data Analysis Driven Demonstrate Statistics With Scatter Chart PowerPoint Slides Templates
Establish The Dominance Of Your Ideas. Our financial data analysis driven demonstrate statistics with scatter chart powerpoint slides Templates Will Put Them On Top.
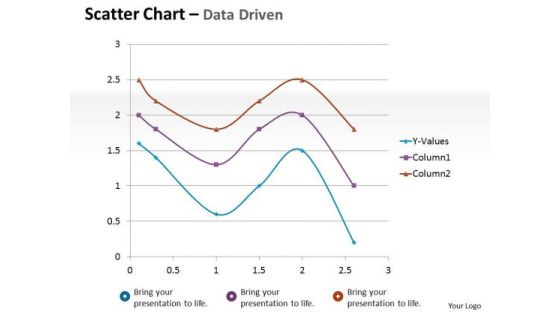
Financial Data Analysis Driven Scatter Chart Mathematical Diagram PowerPoint Slides Templates
Dominate Proceedings With Your Ideas. Our financial data analysis driven scatter chart mathematical diagram powerpoint slides Templates Will Empower Your Thoughts.
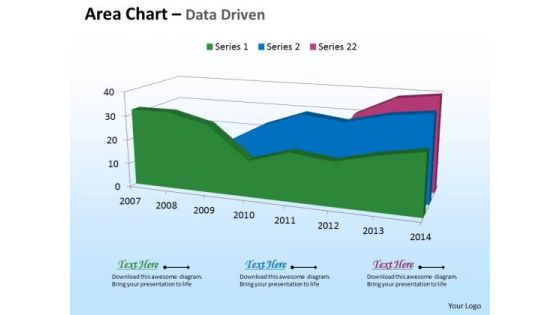
Microsoft Excel Data Analysis 3d Area Chart For Time Based PowerPoint Templates
Deliver The Right Dose With Our microsoft excel data analysis 3d area chart for time based Powerpoint Templates . Your Ideas Will Get The Correct Illumination.
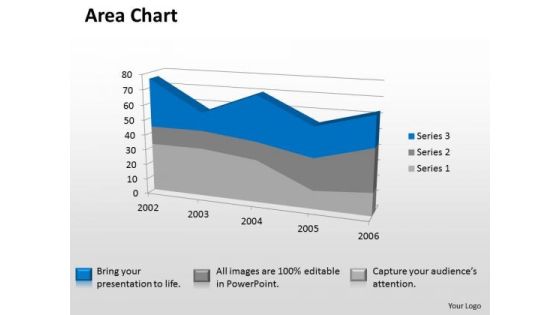
Microsoft Excel Data Analysis 3d Area Chart Showimg Change In Values PowerPoint Templates
Our microsoft excel data analysis 3d area chart showimg change in values Powerpoint Templates Deliver At Your Doorstep. Let Them In For A Wonderful Experience.
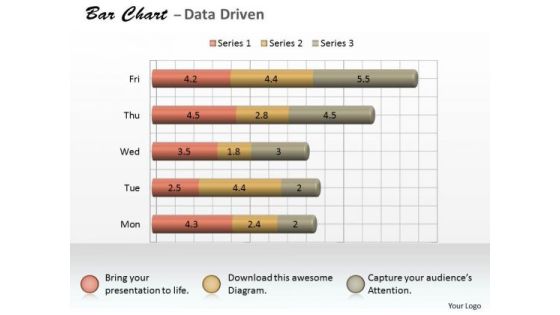
Microsoft Excel Data Analysis 3d Bar Chart As Research Tool PowerPoint Templates
Knock On The Door To Success With Our microsoft excel data analysis 3d bar chart as research tool Powerpoint Templates . Be Assured Of Gaining Entry.
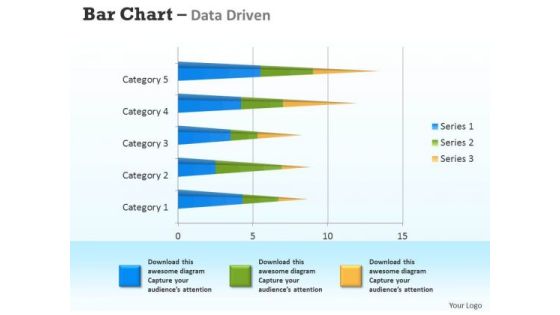
Microsoft Excel Data Analysis 3d Bar Chart For Analyzing Survey PowerPoint Templates
Connect The Dots With Our microsoft excel data analysis 3d bar chart for analyzing survey Powerpoint Templates . Watch The Whole Picture Clearly Emerge.

Microsoft Excel Data Analysis 3d Change In Business Process Chart PowerPoint Templates
Double Your Chances With Our microsoft excel data analysis 3d change in business process chart Powerpoint Templates . The Value Of Your Thoughts Will Increase Two-Fold.

Microsoft Excel Data Analysis 3d Chart For Business Observation PowerPoint Templates
Double Up Our microsoft excel data analysis 3d chart for business observation Powerpoint Templates With Your Thoughts. They Will Make An Awesome Pair.
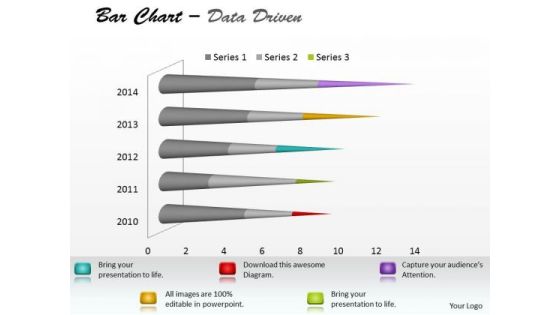
Microsoft Excel Data Analysis Bar Chart To Communicate Information PowerPoint Templates
With Our microsoft excel data analysis bar chart to communicate information Powerpoint Templates You Will Be Doubly Sure. They Possess That Stamp Of Authority.

Microsoft Excel Data Analysis Bar Chart To Compare Quantities PowerPoint Templates
Our microsoft excel data analysis bar chart to compare quantities Powerpoint Templates Leave No One In Doubt. Provide A Certainty To Your Views.
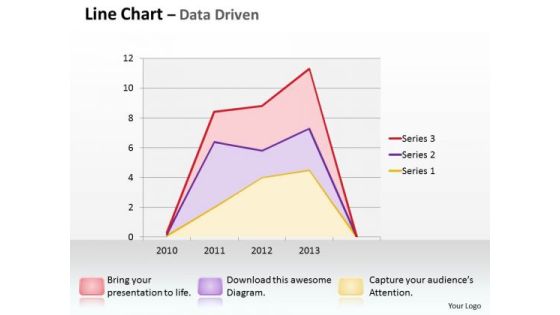
Multivariate Data Analysis Driven Line Chart Shows Revenue Trends PowerPoint Slides Templates
Good Camaraderie Is A Key To Teamwork. Our multivariate data analysis driven line chart shows revenue trends powerpoint slides Templates Can Be A Cementing Force.
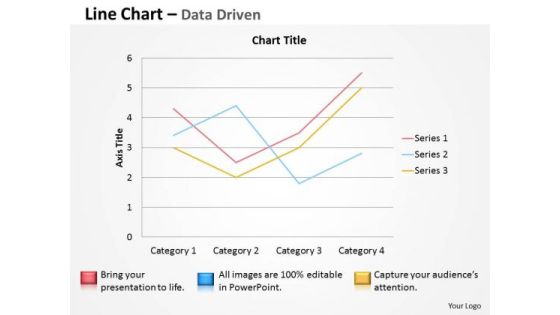
Multivariate Data Analysis Driven Line Chart To Demonstrate PowerPoint Slides Templates
Brace Yourself, Arm Your Thoughts. Prepare For The Hustle With Our multivariate data analysis driven line chart to demonstrate powerpoint slides Templates .
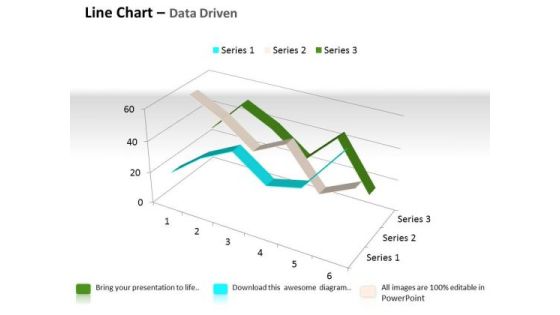
Quantitative Data Analysis 3d Line Chart For Comparison Of PowerPoint Templates
Touch Base With Our quantitative data analysis 3d line chart for comparison of Powerpoint Templates . Review Your Growth With Your Audience.

Quantitative Data Analysis 3d Pie Chart For Business Process PowerPoint Templates
Put Them On The Same Page With Our quantitative data analysis 3d pie chart for business process Powerpoint Templates . Your Team Will Sing From The Same Sheet.
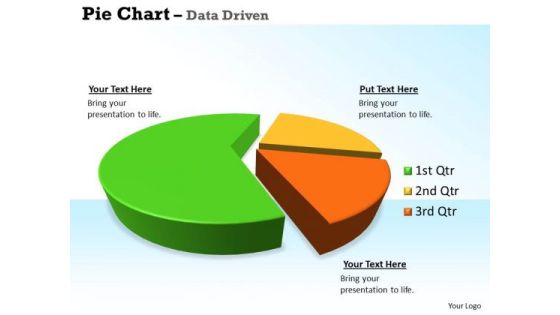
Quantitative Data Analysis 3d Pie Chart For Business Statistics PowerPoint Templates
Our quantitative data analysis 3d pie chart for business statistics Powerpoint Templates Allow You To Do It With Ease. Just Like Picking The Low Hanging Fruit.

Quantitative Data Analysis Driven Economic Status Line Chart PowerPoint Slides Templates
Be The Dramatist With Our quantitative data analysis driven economic status line chart powerpoint slides Templates . Script Out The Play Of Words.

Quantitative Data Analysis Driven Economic With Column Chart PowerPoint Slides Templates
Add Some Dramatization To Your Thoughts. Our quantitative data analysis driven economic with column chart powerpoint slides Templates Make Useful Props.

Christmas Scene Festival PowerPoint Backgrounds And Templates 1210
Microsoft PowerPoint Template and Background with Snapshots of Christmas scenes on textured red background
Statistical Data On Social Platforms Data Analysis Services Offered By Marketing Agencies Icons PDF
This slide shows the statistics related to social media services provided by the marketing agencies to their clients. It includes various services such as content creation, social media monitoring, strategy building, campaign analysis etc. Pitch your topic with ease and precision using this Statistical Data On Social Platforms Data Analysis Services Offered By Marketing Agencies Icons PDF. This layout presents information on Statistical Data, Social Platforms Data, Analysis Services, Marketing Agencies. It is also available for immediate download and adjustment. So, changes can be made in the color, design, graphics or any other component to create a unique layout.
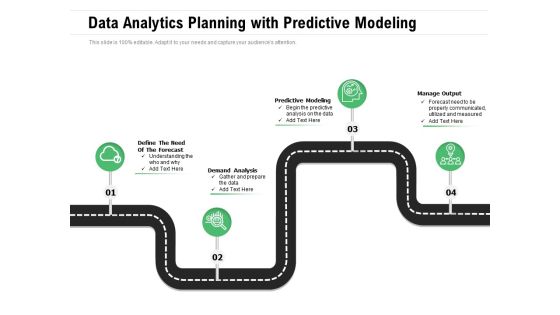
Data Analytics Planning With Predictive Modeling Ppt PowerPoint Presentation File Example Topics PDF
Presenting data analytics planning with predictive modeling ppt powerpoint presentation file example topics pdf to dispense important information. This template comprises four stages. It also presents valuable insights into the topics including analysis, communicated, predictive. This is a completely customizable PowerPoint theme that can be put to use immediately. So, download it and address the topic impactfully.

Data And Customer Analysis Company Outline Content Metadata And New Services Infographics PDF
This slide highlights the Nielsen content development initiatives to meet market demand which includes In flight initiatives metadata opportunities and analytics with whitespace new ecosystem services. Slidegeeks is one of the best resources for PowerPoint templates. You can download easily and regulate Data And Customer Analysis Company Outline Content Metadata And New Services Infographics PDF for your personal presentations from our wonderful collection. A few clicks is all it takes to discover and get the most relevant and appropriate templates. Use our Templates to add a unique zing and appeal to your presentation and meetings. All the slides are easy to edit and you can use them even for advertisement purposes.

Roles And Responsibilities Of Data Driven Marketing Team Infographics PDF
This slide represents the roles and responsibilities performed by individuals in order to provide personalized and unique experience to customers and enhance enterprises ROI. It includes details related to roles and responsibilities of marketing data analyst, data scientist etc. Get a simple yet stunning designed Roles And Responsibilities Of Data Driven Marketing Team Infographics PDF. It is the best one to establish the tone in your meetings. It is an excellent way to make your presentations highly effective. So, download this PPT today from Slidegeeks and see the positive impacts. Our easy-to-edit Roles And Responsibilities Of Data Driven Marketing Team Infographics PDF can be your go-to option for all upcoming conferences and meetings. So, what are you waiting for Grab this template today.

Business Diagram Charts To Present Business Data PowerPoint Templates
Table of pie graphs has been used in this power point diagram. This business diagram contains the concept of result analysis. The template offers an excellent background to build up the various stages of your business process.
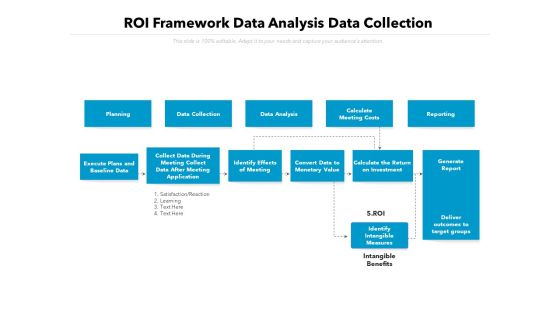
ROI Framework Data Analysis Data Collection Ppt PowerPoint Presentation Gallery Template PDF
Presenting this set of slides with name roi framework data analysis data collection ppt powerpoint presentation gallery template pdf. The topics discussed in these slides are planning, data collection, data analysis. This is a completely editable PowerPoint presentation and is available for immediate download. Download now and impress your audience.

Business IT Stack With Applications Platform Ppt PowerPoint Presentation Inspiration Influencers PDF
Presenting this set of slides with name business it stack with applications platform ppt powerpoint presentation inspiration influencers pdf. This is a three stage process. The stages in this process are delivery, applications, platform, portal and collaboration, performance management, end user analysis, enterprise reporting, analytics and data mining, report server, data warehouse, data integration. This is a completely editable PowerPoint presentation and is available for immediate download. Download now and impress your audience.

Social Media ROI Pyramid With Key Business Metrics Download PDF
The slide showcases a social media ROI pyramid and highlights its key metrics which enables you to boost your social media strategy by making use of a measurement framework. It involves business metrics, social media analytics and engagement data. Persuade your audience using this Social Media ROI Pyramid With Key Business Metrics Download PDF. This PPT design covers three stages, thus making it a great tool to use. It also caters to a variety of topics including Business Metrices, Social Media Analytics, Engagement Data. Download this PPT design now to present a convincing pitch that not only emphasizes the topic but also showcases your presentation skills.

Risk Assessment Control Report Form Designs PDF
This slide shows a systematic model development process of identifying, analyzing, and responding to project risk. This further includes, ideation, data sourcing, monitoring, and maintenance. Showcasing this set of slides titled Risk Assessment Control Report Form Designs PDF. The topics addressed in these templates are Risk Description, Technical Risk, Budget Risk. All the content presented in this PPT design is completely editable. Download it and make adjustments in color, background, font etc. as per your unique business setting.
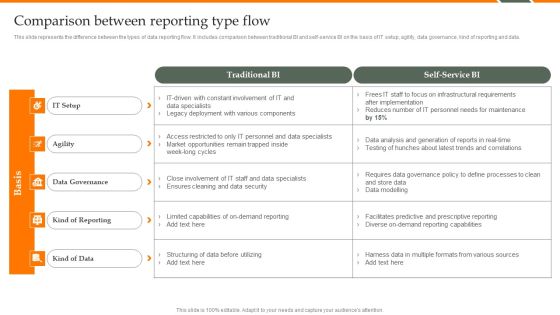
Human Resource Analytics Comparison Between Reporting Type Flow Demonstration PDF
This slide represents the difference between the types of data reporting flow. It includes comparison between traditional BI and self-service BI on the basis of IT setup, agility, data governance, kind of reporting and data. If your project calls for a presentation, then Slidegeeks is your go-to partner because we have professionally designed, easy-to-edit templates that are perfect for any presentation. After downloading, you can easily edit Human Resource Analytics Comparison Between Reporting Type Flow Demonstration PDF and make the changes accordingly. You can rearrange slides or fill them with different images. Check out all the handy templates.

Data Analytics In Event Threat Mitigation Inspiration PDF
This slide showcase event risk assessment for implementation of data driven to safeguard systems against secret business threats It includes risk assessment, risk operations, risk control and monitoring and risk reporting. Persuade your audience using this Data Analytics In Event Threat Mitigation Inspiration PDF. This PPT design covers Four stages, thus making it a great tool to use. It also caters to a variety of topics including Risk Assessment And Measurements, Risk Operations, Risk Control Monitoring. Download this PPT design now to present a convincing pitch that not only emphasizes the topic but also showcases your presentation skills.

Market Evaluation Of IT Industry Key Performance Indicators To Track Marketing Campaign Performance Slides PDF
The following slide showcases various metrics through which marketers can measure the success of marketing campaign performance on social media platforms such as Facebook, Instagram, LinkedIn etc. The KPIs are followers, engagement rate, posting frequency, shares, and profile impressions. If you are looking for a format to display your unique thoughts, then the professionally designed Market Evaluation Of IT Industry Key Performance Indicators To Track Marketing Campaign Performance Slides PDF is the one for you. You can use it as a Google Slides template or a PowerPoint template. Incorporate impressive visuals, symbols, images, and other charts. Modify or reorganize the text boxes as you desire. Experiment with shade schemes and font pairings. Alter, share or cooperate with other people on your work. Download Market Evaluation Of IT Industry Key Performance Indicators To Track Marketing Campaign Performance Slides PDF and find out how to give a successful presentation. Present a perfect display to your team and make your presentation unforgettable.

Comprehensive Customer Data Platform Guide Optimizing Promotional Initiatives Statistics Highlighting Customer Data Template PDF
The following slide showcases the key trends of customer data platform industry to evaluate the rising demand of first party data. It includes elements such as industry revenue, software market growth, B2B and B2C customers, market size etc. Present like a pro with Comprehensive Customer Data Platform Guide Optimizing Promotional Initiatives Statistics Highlighting Customer Data Template PDF Create beautiful presentations together with your team, using our easy to use presentation slides. Share your ideas in real time and make changes on the fly by downloading our templates. So whether you are in the office, on the go, or in a remote location, you can stay in sync with your team and present your ideas with confidence. With Slidegeeks presentation got a whole lot easier. Grab these presentations today.

Mapping Your Competitive Position Ppt PowerPoint Presentation Files
This is a mapping your competitive position ppt powerpoint presentation files. This is a four stage process. The stages in this process are gaining market share, losing market share, company growth, average market growth.

Business Unit Team Objectives Powerpoint Ideas
This is a business unit team objectives powerpoint ideas. This is a four stage process. The stages in this process are team, team goals, engineering, product, marketing, sales, support, finance admin.

Organizational Culture Of Company Ppt PowerPoint Presentation Designs Download
This is a organizational culture of company ppt powerpoint presentation designs download. This is a four stage process. The stages in this process are organizational, business, company, strategy, marketing.
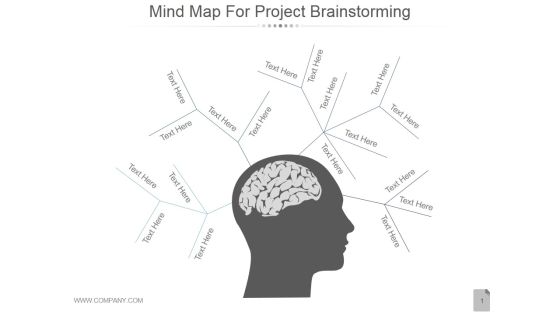
Mind Map For Project Brainstorming Ppt PowerPoint Presentation Images
This is a mind map for project brainstorming ppt powerpoint presentation images. This is a one stage process. The stages in this process are mind map, business, marketing, idea, planning.

Pros And Cons For Social Media Usage Ppt PowerPoint Presentation Ideas
This is a pros and cons for social media usage ppt powerpoint presentation ideas. This is a two stage process. The stages in this process are social media, business, marketing, management, strategy.

5 Gaps Of Service Quality Model Ppt PowerPoint Presentation Icon
This is a 5 gaps of service quality model ppt powerpoint presentation icon. This is a five stage process. The stages in this process are business, strategy, service quality, marketing.

Customer Acquisition Framework Ppt PowerPoint Presentation Example
This is a customer acquisition framework ppt powerpoint presentation example. This is a six stage process. The stages in this process are marketing team, sales team, customer success team, sales funnel, customer lifecycle.

Customer Acquisition Process Ppt PowerPoint Presentation Graphics
This is a customer acquisition process ppt powerpoint presentation graphics. This is a six stage process. The stages in this process are customer acquisition, social news, social networks, blog, market research.
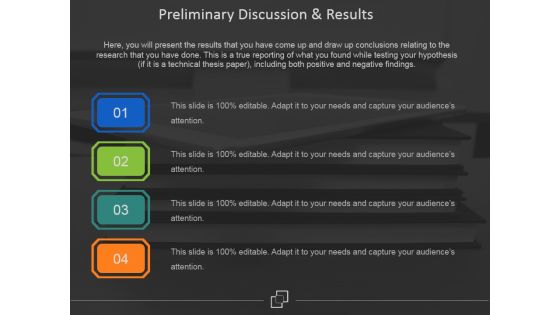
Preliminary Discussion And Results Ppt PowerPoint Presentation Gallery Samples
This is a preliminary discussion and results ppt powerpoint presentation gallery samples. This is a four stage process. The stages in this process are business, marketing, strategy, growth, success.
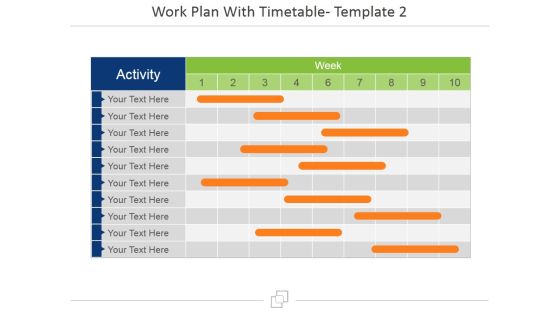
Work Plan With Timetable Template 2 Ppt PowerPoint Presentation Inspiration Graphics
This is a work plan with timetable template 2 ppt powerpoint presentation inspiration graphics. This is a ten stage process. The stages in this process are week, activity, business, marketing, table.

Work Plan With Timetable Template 2 Ppt PowerPoint Presentation File Ideas
This is a work plan with timetable template 2 ppt powerpoint presentation file ideas. This is a ten stage process. The stages in this process are table, activity, business, marketing, plan.

Revenue Split By Product Segment Template Ppt PowerPoint Presentation Graphics
This is a revenue split by product segment template ppt powerpoint presentation graphics. This is a four stage process. The stages in this process are product, business, marketing, planning, process.

Competitive Landscape Ppt PowerPoint Presentation Pictures Microsoft
This is a competitive landscape ppt powerpoint presentation pictures microsoft. This is a four stage process. The stages in this process are competitors, market leader, challenger, niche competitor, explanation.

Budgeting Plan Ppt PowerPoint Presentation Show Slide Download
This is a budgeting plan ppt powerpoint presentation show slide download. This is a four stage process. The stages in this process are public relations, web marketing, advertising, press release development, review program.
Evaluating Scores Ppt PowerPoint Presentation Icon Model
This is a evaluating scores ppt powerpoint presentation icon model. This is a eight stage process. The stages in this process are evaluator, strategic, product advantage, market attractiveness, leverage competencies.
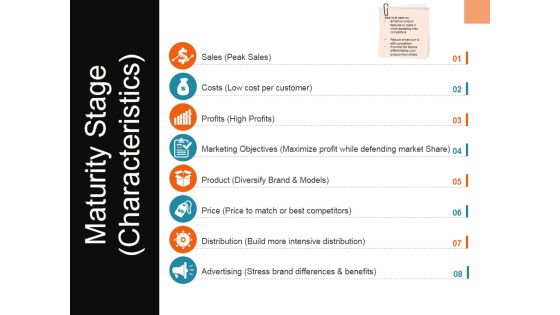
Maturity Stage Characteristics Ppt PowerPoint Presentation Slides Show
This is a maturity stage characteristics ppt powerpoint presentation slides show. This is a eight stage process. The stages in this process are sales, costs, profits, marketing objectives, product.

Operations Plan Ppt PowerPoint Presentation Pictures Example
This is a operations plan ppt powerpoint presentation pictures example. This is a three stage process. The stages in this process are key initiatives, prioritization, project lead, sales, marketing.
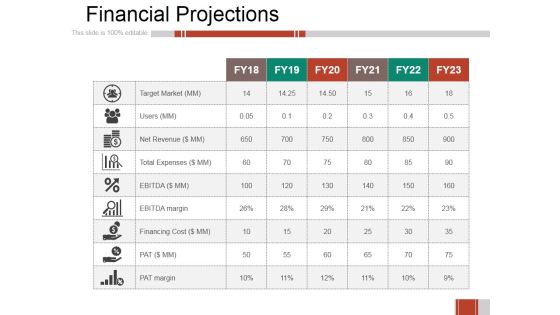
Financial Projections Ppt PowerPoint Presentation Styles Microsoft
This is a financial projections ppt powerpoint presentation styles microsoft. This is a six stage process. The stages in this process are target market, users, net revenue, total expenses, financing cost.

Budgeting Template Ppt PowerPoint Presentation Icon Examples
This is a budgeting template ppt powerpoint presentation icon examples. This is a four stage process. The stages in this process are public relations, web marketing, advertising, press release development, microsoft as program.
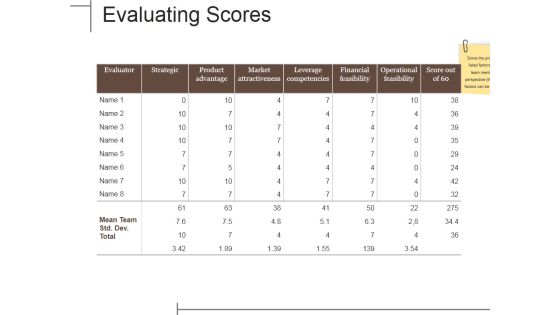
Evaluating Scores Ppt PowerPoint Presentation Infographics Rules
This is a evaluating scores ppt powerpoint presentation infographics rules. This is a seven stage process. The stages in this process are strategic, product advantage, market attractiveness, leverage competencies, financial feasibility, operational feasibility.
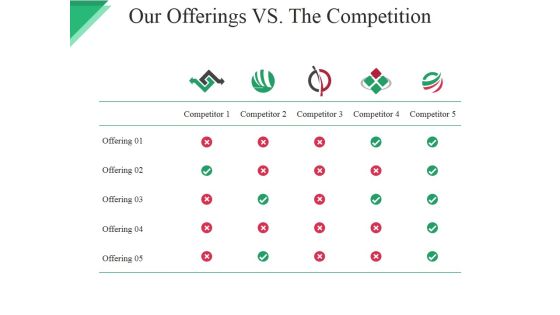
Our Offerings Vs The Competition Ppt PowerPoint Presentation Summary Design Inspiration
This is a our offerings vs the competition ppt powerpoint presentation summary design inspiration. This is a five stage process. The stages in this process are business, marketing, strategy, planning, process.

Budgeting Template Ppt PowerPoint Presentation Styles Pictures
This is a budgeting template ppt powerpoint presentation styles pictures. This is a three stage process. The stages in this process are public relations, web marketing, advertising, press release development, review program.
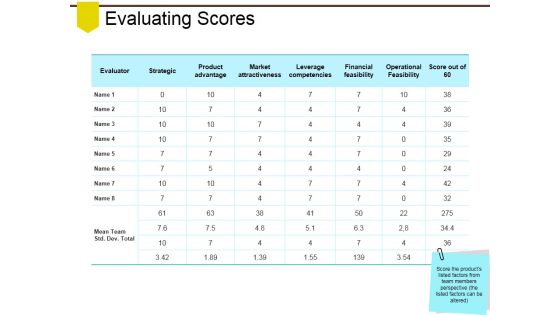
Evaluating Scores Ppt PowerPoint Presentation Summary Portrait
This is a evaluating scores ppt powerpoint presentation summary portrait. This is a three stage process. The stages in this process are evaluator, strategic, product advantage, market attractiveness, leverage competencies.

Operations Plan Ppt PowerPoint Presentation Model Samples
This is a operations plan ppt powerpoint presentation model samples. This is a three stage process. The stages in this process are sales, marketing, operation, people, financial and admin.

Project Health Card Template Ppt PowerPoint Presentation Summary Smartart
This is a project health card template ppt powerpoint presentation summary smartart. This is a six stage process. The stages in this process are business, marketing, strategy, planning, finance.
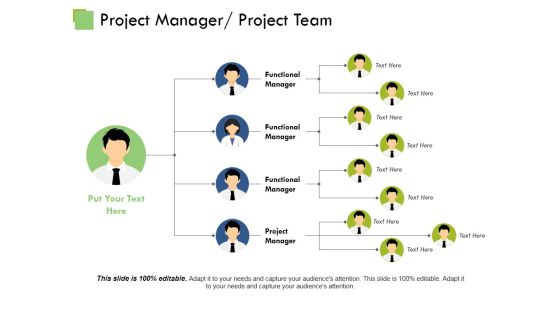
Project Manager Project Team Template Ppt PowerPoint Presentation Layouts Examples
This is a project manager project team template ppt powerpoint presentation layouts examples. This is a five stage process. The stages in this process are table, marketing, strategy, planning, communication.
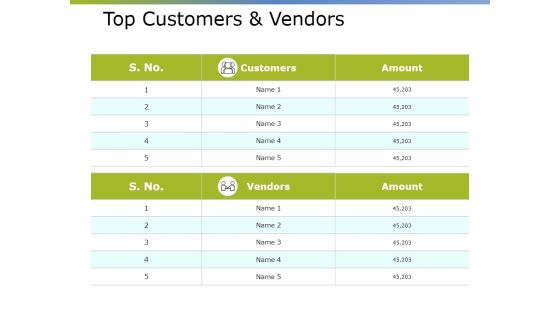
Top Customers And Vendors Ppt PowerPoint Presentation Infographic Template Example 2015
This is a top customers and vendors ppt powerpoint presentation infographic template example 2015. This is a two stage process. The stages in this process are business, marketing, strategy, planning, tables.
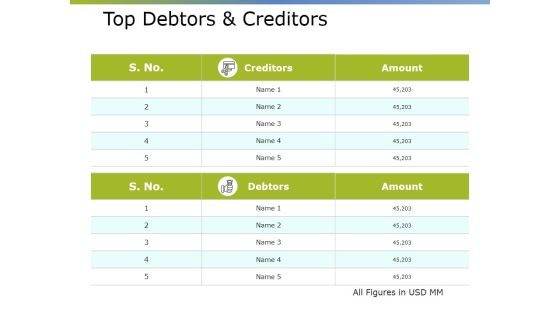
Top Debtors And Creditors Ppt PowerPoint Presentation Professional Design Ideas
This is a top debtors and creditors ppt powerpoint presentation professional design ideas. This is a two stage process. The stages in this process are business, marketing, strategy, planning, tables.
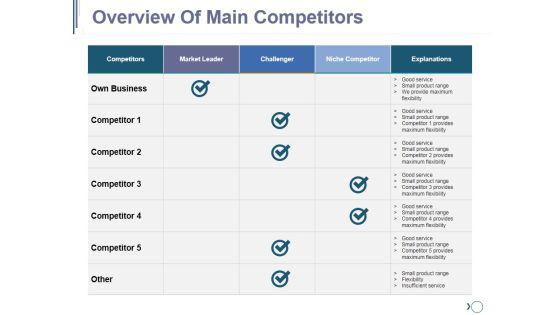
Overview Of Main Competitors Ppt PowerPoint Presentation File Designs
This is a overview of main competitors ppt powerpoint presentation file designs. This is a six stage process. The stages in this process are competitors, market leader, challenger, niche competitor, explanations.

Comparison Based On Criteria Ppt PowerPoint Presentation Model Inspiration
This is a comparison based on criteria ppt powerpoint presentation model inspiration. This is a seven stage process. The stages in this process are revenue, profit, market share, number of employees, product quality.
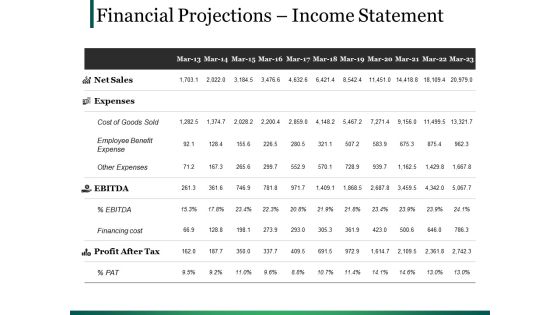
Financial Projections Income Statement Ppt PowerPoint Presentation Model Format
This is a financial projections income statement ppt powerpoint presentation model format. This is a two stage process. The stages in this process are tables, marketing, planning, strategy, finance.
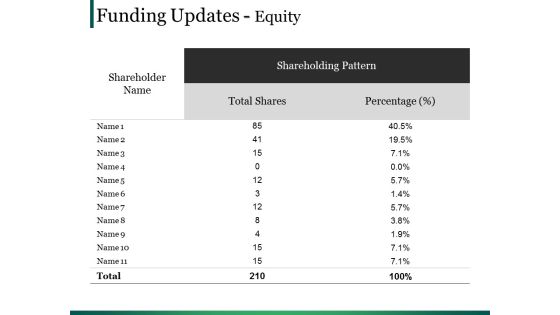
Funding Updates Equity Ppt PowerPoint Presentation Portfolio Graphics Template
This is a funding updates equity ppt powerpoint presentation portfolio graphics template. This is a three stage process. The stages in this process are tables, marketing, planning, strategy, finance.

Budgeting Template Ppt PowerPoint Presentation Gallery Inspiration
This is a budgeting template ppt powerpoint presentation gallery inspiration. This is a three stage process. The stages in this process are public relations, web marketing, advertising, press release development, microsoft as program.

Organization Financial Team Summary With Key Performance Indicators Clipart PDF
This slide represents a report prepared by the finance team showing the financial position of the organization with the help of key performance indicators. It demonstrates data related to current working capital, cash conversion cycle and vendor payment error rate of the company. Pitch your topic with ease and precision using this Organization Financial Team Summary With Key Performance Indicators Clipart PDF. This layout presents information on Current Working Capital, Cash Conversion Cycle. It is also available for immediate download and adjustment. So, changes can be made in the color, design, graphics or any other component to create a unique layout.

Balance Sheet Kpis Template 1 Ppt PowerPoint Presentation Layouts Design Ideas
This is a balance sheet kpis template 1 ppt powerpoint presentation layouts design ideas. This is a four stage process. The stages in this process are current assets, current liabilities, total assets, total liabilities.

Data Analysis On Excel 3d Chart Shows Interrelated Sets Of PowerPoint Templates
Put Them On The Same Page With Our data analysis on excel 3d chart shows interrelated sets of Powerpoint Templates . Your Team Will Sing From The Same Sheet.

Big Data Analytics Engineering Procedure Framework Brochure PDF
This slide showcase big data analytics processes of collecting, processing, cleansing, and analyzing datasets. It includes elements such as data sources, data pipeline, data storage, processing and data analysis Showcasing this set of slides titled Big Data Analytics Engineering Procedure Framework Brochure PDF. The topics addressed in these templates are Data Sources, Data Pipeline, Data Storage. All the content presented in this PPT design is completely editable. Download it and make adjustments in color, background, font etc. as per your unique business setting.

Value Stream Information Data Analytics Structure Business Analysis Modification Toolkit Rules PDF
The slides shows the stages of data analytics with reactive and proactive approach. In includes four steps collection, analysis, predictive and actions.Presenting Value Stream Information Data Analytics Structure Business Analysis Modification Toolkit Rules PDF to provide visual cues and insights. Share and navigate important information on four stages that need your due attention. This template can be used to pitch topics like Predictive Analytics, Streaming Analytics, Collection Analysis. In addtion, this PPT design contains high resolution images, graphics, etc, that are easily editable and available for immediate download.

Change Management Plan For Data Analytics Business Analysis Modification Toolkit Download PDF
Deliver an awe inspiring pitch with this creative Change Management Plan For Data Analytics Business Analysis Modification Toolkit Download PDF bundle. Topics like Project Initiation, Strategize Plan, Operationalize can be discussed with this completely editable template. It is available for immediate download depending on the needs and requirements of the user.

Work Streams Organizational Structure For Data Analytics Business Analysis Modification Toolkit Rules PDF
Deliver an awe inspiring pitch with this creative Work Streams Organizational Structure For Data Analytics Business Analysis Modification Toolkit Rules PDF bundle. Topics like Business Owner, Business Partner, Promotion Demand can be discussed with this completely editable template. It is available for immediate download depending on the needs and requirements of the user.

Big Data Analysis Process For Business Strategy Diagrams PDF
Persuade your audience using this big data analysis process for business strategy diagrams pdf.This PPT design covers three stages, thus making it a great tool to use. It also caters to a variety of topics including select right environment for data analytics, relate data with objectives, provide access to data. Download this PPT design now to present a convincing pitch that not only emphasizes the topic but also showcases your presentation skills.

Cloud Computing Services Why Should Businesses Adopt Software As A Service Saas Formats PDF
This slide defines why businesses should adopt software as a service, including an alternative model for typical software installation and no need to maintain the servers, etc. Presenting Cloud Computing Services Why Should Businesses Adopt Software As A Service Saas Formats PDF to provide visual cues and insights. Share and navigate important information on eight stages that need your due attention. This template can be used to pitch topics like Marketing Automation, Project Management, Email Marketing. In addtion, this PPT design contains high resolution images, graphics, etc, that are easily editable and available for immediate download.

5 Vs Of Big Data Analysis Infographics PDF
This slide showcases five Vs which are volume, veracity, variety, velocity and value. Each aspect is considered for the analytics purpose. Volume defines data in numbers, veracity explains whether the data is useful or not, variety tell whether the data is in the structured or unstructured form etc. Persuade your audience using this 5 Vs Of Big Data Analysis Infographics PDF. This PPT design covers five stages, thus making it a great tool to use. It also caters to a variety of topics including Velocity, Volume, Veracity. Download this PPT design now to present a convincing pitch that not only emphasizes the topic but also showcases your presentation skills.

Business Analytics Application Key Performance Indicators For Human Resource Topics PDF
This slide represents the key performance indicators that are to be tracked to monitor the effect of implementation of business intelligence in HR operations. It includes KPIs such as personnel costs, employee retention rate, employee satisfaction rate etc. The Business Analytics Application Key Performance Indicators For Human Resource Topics PDF is a compilation of the most recent design trends as a series of slides. It is suitable for any subject or industry presentation, containing attractive visuals and photo spots for businesses to clearly express their messages. This template contains a variety of slides for the user to input data, such as structures to contrast two elements, bullet points, and slides for written information. Slidegeeks is prepared to create an impression.

Benefits Of Implementing Big Data Analytics Procedure In Organization Introduction PDF
This slide illustrate various benefits of big data analysis process implementation in an organization. It includes benefits such as cost reduction, product development, customer experience and risk management Presenting Benefits Of Implementing Big Data Analytics Procedure In Organization Introduction PDF to dispense important information. This template comprises three stages. It also presents valuable insights into the topics including Cost Reduction, Product Development, Customer Experience. This is a completely customizable PowerPoint theme that can be put to use immediately. So, download it and address the topic impactfully.
