AI PPT Maker
Templates
PPT Bundles
Design Services
Business PPTs
Business Plan
Management
Strategy
Introduction PPT
Roadmap
Self Introduction
Timelines
Process
Marketing
Agenda
Technology
Medical
Startup Business Plan
Cyber Security
Dashboards
SWOT
Proposals
Education
Pitch Deck
Digital Marketing
KPIs
Project Management
Product Management
Artificial Intelligence
Target Market
Communication
Supply Chain
Google Slides
Research Services
 One Pagers
All Categories
-
Home
- Customer Favorites
- Yearly Goals
Yearly Goals

Column Chart Ppt PowerPoint Presentation Ideas Vector
This is a column chart ppt powerpoint presentation ideas vector. This is a two stage process. The stages in this process are column chart, product, financial years, sales in percentage, growth.

High Low Close Chart Ppt PowerPoint Presentation Portfolio Topics
This is a high low close chart ppt powerpoint presentation portfolio topics. This is a three stage process. The stages in this process are product, market size, in years, success, bar graph.

Column Chart Ppt PowerPoint Presentation Pictures Graphic Images
This is a column chart ppt powerpoint presentation pictures graphic images. This is a two stage process. The stages in this process are product, years, growth, success, bar graph.

Line Chart Ppt PowerPoint Presentation Slides Mockup
This is a line chart ppt powerpoint presentation slides mockup. This is a two stage process. The stages in this process are in percentage, in years, product, growth, success.

Bar Chart Ppt PowerPoint Presentation Outline Backgrounds
This is a bar chart ppt powerpoint presentation outline backgrounds. This is a one stage process. The stages in this process are sales in percentage, financial years, product, bar graph, finance.

Bar Chart Ppt PowerPoint Presentation Model Picture
This is a bar chart ppt powerpoint presentation model picture. This is a two stage process. The stages in this process are product, sales in percentage, financial years, bar chart.

Bar Chart Ppt PowerPoint Presentation Ideas Deck
This is a bar chart ppt powerpoint presentation ideas deck. This is a two stage process. The stages in this process are product, in percentage, in years, financial, business.

Column Chart Ppt PowerPoint Presentation Infographics Guidelines
This is a column chart ppt powerpoint presentation infographics guidelines. This is a two stage process. The stages in this process are product, expenditure in, years, business, bar graph.
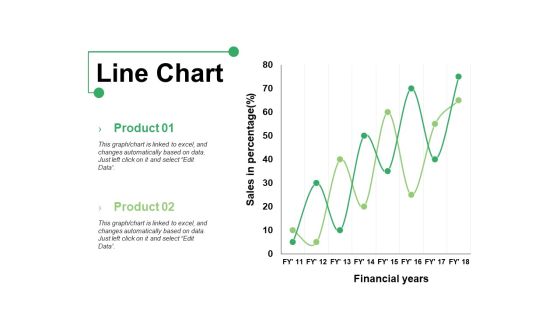
Line Chart Ppt PowerPoint Presentation Show Graphics Example
This is a line chart ppt powerpoint presentation show graphics example. This is a two stage process. The stages in this process are product, line chart, financial years, sales in percentage.

Bar Chart Ppt PowerPoint Presentation Infographics Format Ideas
This is a bar chart ppt powerpoint presentation infographics format ideas. This is a two stage process. The stages in this process are bar graph, product, financial year, sales in percentage.

Line Chart Ppt PowerPoint Presentation Professional Grid
This is a line chart ppt powerpoint presentation professional grid. This is a two stage process. The stages in this process are sales in percentage, financial years, product, line chart.
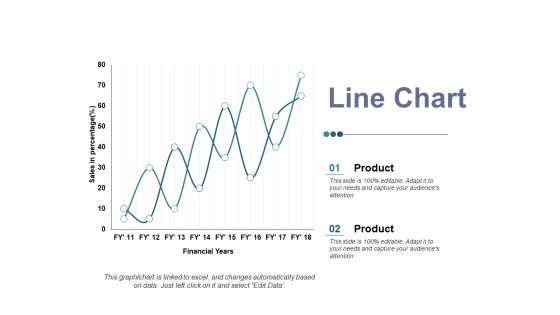
Line Chart Ppt PowerPoint Presentation Ideas Elements
This is a line chart ppt powerpoint presentation ideas elements. This is a two stage process. The stages in this process are product, sales in percentage, financial year, business, line chart.

Stacked Line Template 1 Ppt PowerPoint Presentation Infographic Template Graphics
This is a stacked line template 1 ppt powerpoint presentation infographic template graphics. This is a three stage process. The stages in this process are product, unit count, in years, business, marketing.

Line Chart Ppt PowerPoint Presentation Infographic Template Master Slide
This is a line chart ppt powerpoint presentation infographic template master slide. This is a two stage process. The stages in this process are product, financial years, sales in percentage.

Bar Chart Ppt PowerPoint Presentation Slides Example File
This is a bar chart ppt powerpoint presentation slides example file. This is a two stage process. The stages in this process are product, financial years, sales in percentage.

Clustered Column Ppt PowerPoint Presentation Infographic Template Backgrounds
This is a clustered column ppt powerpoint presentation infographic template backgrounds. This is a two stage process. The stages in this process are sales in percentage, financial year, product.
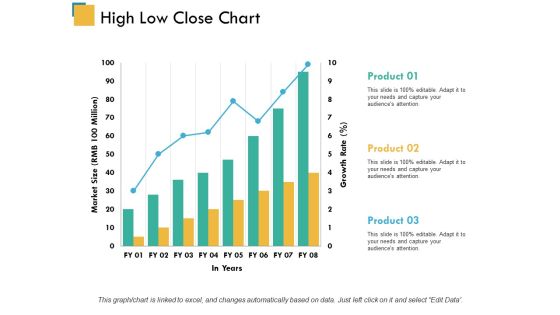
High Low Close Chart Ppt PowerPoint Presentation Model Inspiration
This is a high low close chart ppt powerpoint presentation model inspiration. This is a three stage process. The stages in this process are product, market size, in years.
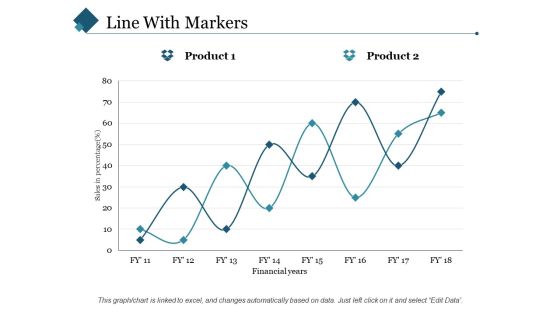
Line With Markers Ppt PowerPoint Presentation Styles Slide Portrait
This is a line with markers ppt powerpoint presentation styles slide portrait. This is a two stage process. The stages in this process are sales in percentage, financial years, product.

Area Chart Ppt PowerPoint Presentation Icon Summary
This is a area chart ppt powerpoint presentation icon summary. This is a two stage process. The stages in this process are financial year, area chart, in percentage, product.

Area Stacked Ppt PowerPoint Presentation Infographics Shapes
This is a area stacked ppt powerpoint presentation infographics shapes. This is a two stage process. The stages in this process are product, area stacked, sales in percentage, financial year.
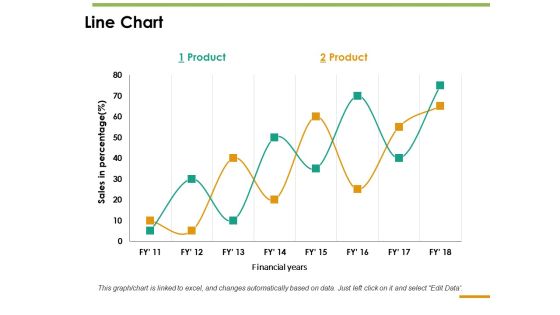
Line Chart Ppt PowerPoint Presentation Inspiration Guide
This is a line chart ppt powerpoint presentation inspiration guide. This is a two stage process. The stages in this process are line chart, sales in percentage, product, financial years.

Area Chart Ppt PowerPoint Presentation Icon Show
This is a area chart ppt powerpoint presentation icon show. This is a two stage process. The stages in this process are product, financial year, in percentage, area chart.

Clustered Chart Ppt PowerPoint Presentation Outline Templates
This is a clustered chart ppt powerpoint presentation outline templates. This is a three stage process. The stages in this process are product, in percentage, in years, clustered chart.

Combo Chart Ppt PowerPoint Presentation Gallery Diagrams
This is a combo chart ppt powerpoint presentation gallery diagrams. This is a three stage process. The stages in this process are combo chart, market size, product, in years, growth rate.

Stacked Area Clustered Column Ppt PowerPoint Presentation Summary Slides
This is a stacked area clustered column ppt powerpoint presentation summary slides. This is a three stage process. The stages in this process are product, in percentage, financial year, bar graph.

Line Chart Ppt PowerPoint Presentation Gallery Format Ideas
This is a line chart ppt powerpoint presentation gallery format ideas. This is a two stage process. The stages in this process are line chart, product, in year, profit.

Column Chart Ppt PowerPoint Presentation Gallery Background Images
This is a column chart ppt powerpoint presentation gallery background images. This is a two stage process. The stages in this process are column chart, product, year, growth, expenditure.

Column Chart Ppt PowerPoint Presentation Portfolio Example Topics
This is a column chart ppt powerpoint presentation portfolio example topics. This is a two stage process. The stages in this process are product, financial year, sales in percentage, column chart.

Column Chart Ppt PowerPoint Presentation Slides Show
This is a column chart ppt powerpoint presentation slides show. This is a two stage process. The stages in this process are column chart, product, sales in percentage, financial year, growth.
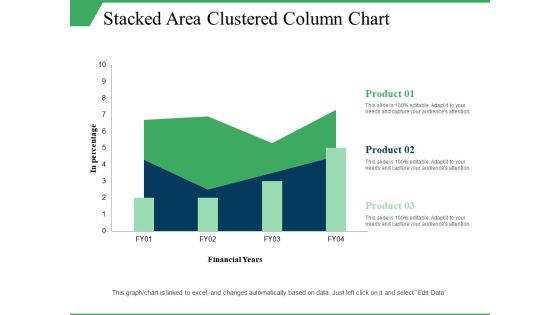
Stacked Area Clustered Column Chart Ppt PowerPoint Presentation Visual Aids Model
This is a stacked area clustered column chart ppt powerpoint presentation visual aids model. This is a three stage process. The stages in this process are in percentage, product, financial years, growth, column chart.
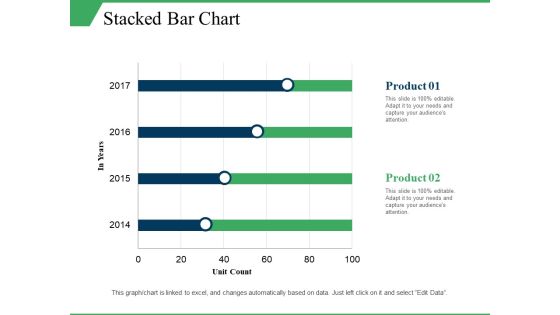
Stacked Bar Chart Ppt PowerPoint Presentation Infographics Elements
This is a stacked bar chart ppt powerpoint presentation infographics elements. This is a two stage process. The stages in this process are stacked bar chart, product, unit count, in year.

Stacked Area Clustered Column Ppt PowerPoint Presentation Professional Influencers
This is a stacked area clustered column ppt powerpoint presentation professional influencers. This is a three stage process. The stages in this process are stacked area clustered column, percentage, product, year.
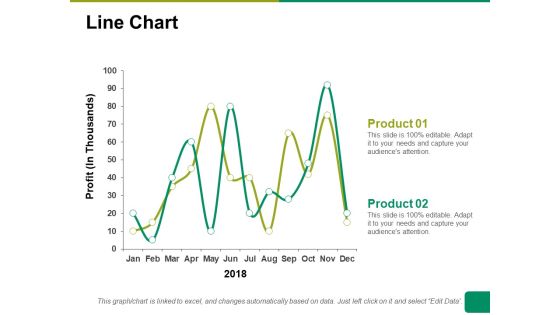
Line Chart Ppt PowerPoint Presentation Summary Ideas
This is a line chart ppt powerpoint presentation summary ideas. This is a two stage process. The stages in this process are line chart, profit, product, financial years, business.

Column Chart Ppt PowerPoint Presentation Icon Show
This is a column chart ppt powerpoint presentation icon show. This is a two stage process. The stages in this process are column chart, product, years, bar graph, growth.

Combo Chart Ppt PowerPoint Presentation Slides Outline
This is a combo chart ppt powerpoint presentation slides outline. This is a three stage process. The stages in this process are combo chart, growth, product, financial year, business.

Area Chart Financial Ppt PowerPoint Presentation Outline Professional
This is a area chart financial ppt powerpoint presentation outline professional. This is a four stage process. The stages in this process are product, sales in percentage, financial year.

Bar Graph Ppt PowerPoint Presentation Styles Skills
This is a bar graph ppt powerpoint presentation styles skills. This is a two stage process. The stages in this process are bar graph, product, in year, in percentage, business.

Stacked Column Chart Ppt PowerPoint Presentation Summary Gallery
This is a stacked column chart ppt powerpoint presentation summary gallery. This is a two stage process. The stages in this process are stacked column chart, product, in years, growth, percentage.

Column Chart Ppt PowerPoint Presentation Layouts File Formats
This is a column chart ppt powerpoint presentation layouts file formats. This is a three stage process. The stages in this process are column chart, product, in percentage, year, finance.
Stacked Area Clustered Column Ppt PowerPoint Presentation Professional Graphics
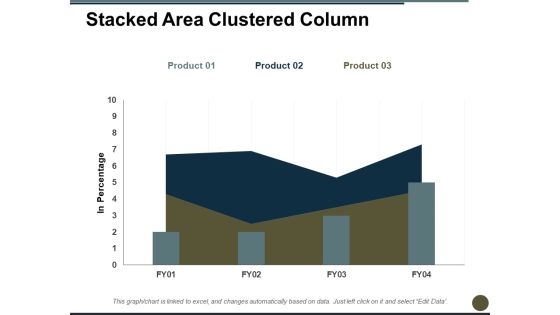
This is a stacked area clustered column ppt powerpoint presentation professional graphics. This is a three stage process. The stages in this process are in percentage, bar chart, product, growth, year.

Clustered Column Chart Ppt PowerPoint Presentation Professional Ideas
This is a clustered column chart ppt powerpoint presentation professional ideas. This is a three stage process. The stages in this process are product, sales in percentage, column, years.

Clustered Bar Capability Maturity Matrix Ppt PowerPoint Presentation Summary Show
This is a clustered bar capability maturity matrix ppt powerpoint presentation summary show. This is a three stage process. The stages in this process are clustered bar, product, year, business, marketing.

Clustered Column Capability Maturity Matrix Ppt PowerPoint Presentation Pictures Slideshow
This is a clustered column capability maturity matrix ppt powerpoint presentation pictures slideshow. This is a three stage process. The stages in this process are clustered column, product, year, business, marketing.

Stacked Column Capability Maturity Matrix Ppt PowerPoint Presentation Model Shapes
This is a stacked column capability maturity matrix ppt powerpoint presentation model shapes. This is a three stage process. The stages in this process are stacked column, product, year, finance, business.
Staked Bar Capability Maturity Matrix Ppt PowerPoint Presentation Slides Outfit
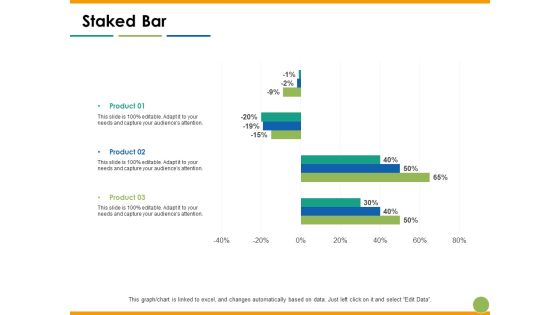
This is a staked bar capability maturity matrix ppt powerpoint presentation slides outfit. This is a three stage process. The stages in this process are staked bar, product, year, finance, percentage.
Stacked Area Clustered Column Ppt PowerPoint Presentation Inspiration Icon
This is a stacked area clustered column ppt powerpoint presentation inspiration icon. This is a three stage process. The stages in this process are stacked area clustered column, product, year, in dollars, business.

Stacked Bar Chart Ppt PowerPoint Presentation Portfolio Templates
This is a stacked bar chart ppt powerpoint presentation portfolio templates. This is a three stage process. The stages in this process are stacked bar chart, product, year, business, finance.

Clustered Bar Finance Ppt Powerpoint Presentation Ideas Themes
This is a clustered bar finance ppt powerpoint presentation ideas themes. This is a three stage process. The stages in this process are clustered bar, product, in percentage, years, profit.
Major Key Big Latest Facts About Data Guidelines PDF
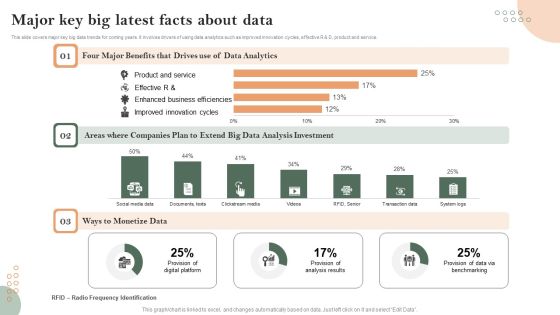
This slide covers major key big data trends for coming years. It involves drivers of using data analytics such as improved innovation cycles, effective R and D, product and service.

Timeline For Team Business Target Achievement Powerpoint Slides
This PowerPoint template contains circles around business team. It may be used to display analysis of team strategy. Download this PPT slide to demonstrate how you intend to navigate your steps towards the desired corporate goal.

Action Steps To Increase Consumer Satisfaction Infographics PDF
The slide showcases an action plan that provides an enterprise a base for creating an action plan for increasing customer satisfaction. It involves companywide goal, understand goal, recognize and address customer touch points, identify right team members and identify KPIs to monitor and review. Presenting Action Steps To Increase Consumer Satisfaction Infographics PDF to dispense important information. This template comprises five stages. It also presents valuable insights into the topics including Understand Goal, Identify Right, Members, Review. This is a completely customizable PowerPoint theme that can be put to use immediately. So, download it and address the topic impactfully.
Consulting Slides Business Process Diagram With 4 Stages Business Presentation
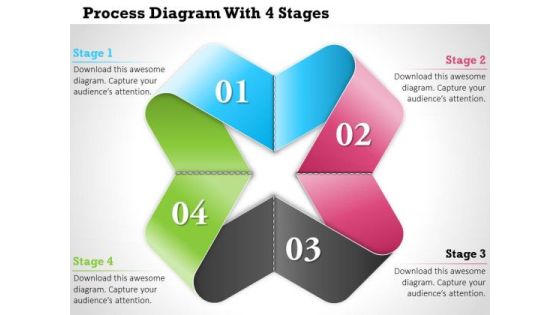
Use this graphic to explain your professional ideas that are broad based but combined for specific goal. It is an excellent graphic to attract the attention of your audience. Illustrate your plan of action with this diagram.
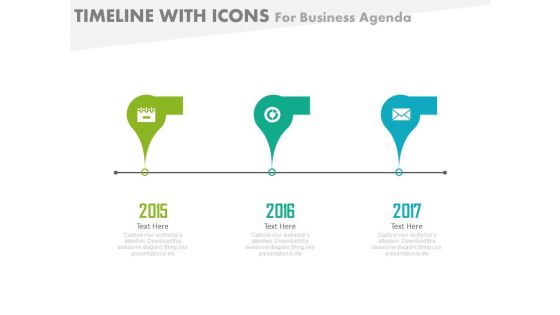
Three Staged Business Strategy Analysis Powerpoint Slides
This PowerPoint template contains three staged timeline diagram. It may be used to display analysis of business strategy. Download this PPT slide to demonstrate how you intend to navigate your steps towards the desired corporate goal.

Mentorship For Effective Business Diagram Powerpoint Templates
This is a mentorship for effective business diagram powerpoint templates. This is a eight stage process. The stages in this process are advice, training, direction, success, coaching, goal, motivation, support, mentoring.

Business Analysis Vision Diagram Sample Presentations
This is a business analysis vision diagram sample presentations. This is a eight stage process. The stages in this process are connect, teamwork, research, innovation, vision, strategy, growth, goal.

Business Analysis Foundation Ppt Powerpoint Presentation
This is a business analysis foundation ppt powerpoint presentation. This is a eight stage process. The stages in this process are innovation, implement, trust, solution, success, goal, strategy, creativity.

Customer Acquiring Price For Retaining New Clients Timeline Of Companys Client Acquisition Costs Elements PDF
This slide shows the trends in CAC costs and cost of PPC. This table shows an increasing CAC over years. This table shows data for 4 years. Deliver an awe inspiring pitch with this creative customer acquiring price for retaining new clients timeline of companys client acquisition costs elements pdf bundle. Topics like timeline of companys client acquisition costs can be discussed with this completely editable template. It is available for immediate download depending on the needs and requirements of the user.

Timeline Of Companys Client Acquisition Costs Microsoft PDF
This slide shows the trends in CAC costs and cost of PPC. This table shows an increasing CAC over years. This table shows data for 4 years. Deliver an awe inspiring pitch with this creative timeline of companys client acquisition costs microsoft pdf bundle. Topics like timeline of companys client acquisition costs can be discussed with this completely editable template. It is available for immediate download depending on the needs and requirements of the user.
Timeline Of Companys Client Acquisition Costs Sample PDF
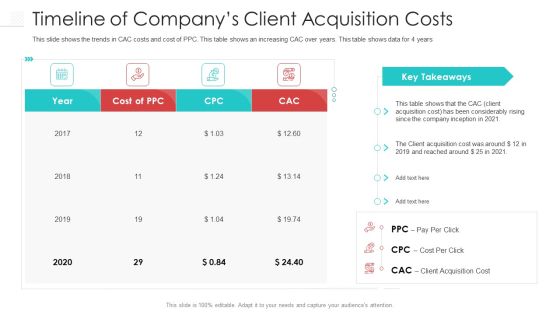
This slide shows the trends in CAC costs and cost of PPC. This table shows an increasing CAC over years. This table shows data for 4 years. Deliver an awe inspiring pitch with this creative timeline of companys client acquisition costs sample pdf bundle. Topics like timeline of companys client acquisition costs can be discussed with this completely editable template. It is available for immediate download depending on the needs and requirements of the user.
Recruitment Training Enhance Candidate Hiring Process Hiring Budget Analysis Of The Company Background PDF
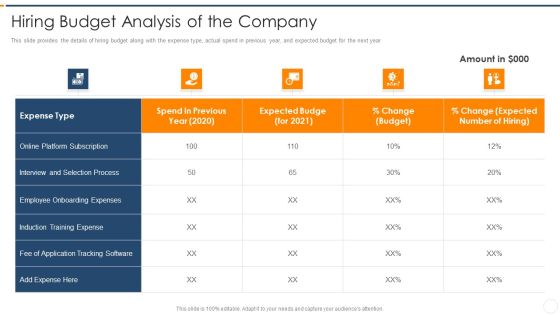
This slide provides the details of hiring budget along with the expense type, actual spend in previous year, and expected budget for the next year. Deliver an awe inspiring pitch with this creative recruitment training enhance candidate hiring process hiring budget analysis of the company background pdf bundle. Topics like hiring budget analysis of the company can be discussed with this completely editable template. It is available for immediate download depending on the needs and requirements of the user.
