AI PPT Maker
Templates
PPT Bundles
Design Services
Business PPTs
Business Plan
Management
Strategy
Introduction PPT
Roadmap
Self Introduction
Timelines
Process
Marketing
Agenda
Technology
Medical
Startup Business Plan
Cyber Security
Dashboards
SWOT
Proposals
Education
Pitch Deck
Digital Marketing
KPIs
Project Management
Product Management
Artificial Intelligence
Target Market
Communication
Supply Chain
Google Slides
Research Services
 One Pagers
All Categories
-
Home
- Customer Favorites
- Yearly Goals
Yearly Goals

Column Chart Ppt PowerPoint Presentation Gallery Design Inspiration
This is a column chart ppt powerpoint presentation gallery design inspiration. This is a two stage process. The stages in this process are column chart, product, sales in percentage, financial years.
Line Chart Ppt PowerPoint Presentation Infographic Template Introduction
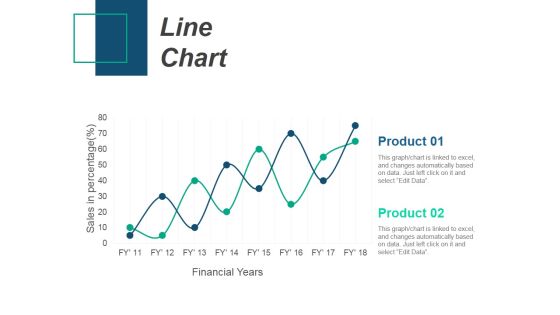
This is a line chart ppt powerpoint presentation infographic template introduction. This is a two stage process. The stages in this process are product, sales in percentage, financial years, line chart.

Area Chart Ppt PowerPoint Presentation Professional Designs
This is a area chart ppt powerpoint presentation professional designs. This is a two stage process. The stages in this process are in percentage, product, in years, strategy, business, marketing.

Line Chart Ppt PowerPoint Presentation Layouts Professional
This is a line chart ppt powerpoint presentation layouts professional. This is a two stage process. The stages in this process are in percentage, product, in years, strategy, marketing, business.
Line Chart Ppt PowerPoint Presentation Infographic Template Icons
This is a line chart ppt powerpoint presentation infographic template icons. This is a two stage process. The stages in this process are sales in percentage, financial years, product, line chart.

Line Chart Ppt PowerPoint Presentation Professional Smartart
This is a line chart ppt powerpoint presentation professional smartart. This is a two stage process. The stages in this process are in percentage, in years, product, finance, business.

Bar Graph Ppt PowerPoint Presentation Portfolio Example
This is a bar graph ppt powerpoint presentation portfolio example. This is a three stage process. The stages in this process are sales in percentage, year, business, product, business, graph.
Scatter Chart Template 1 Ppt PowerPoint Presentation Show Slides
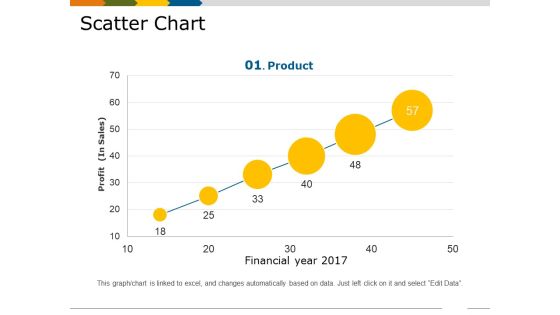
This is a scatter chart template 1 ppt powerpoint presentation show slides. This is a six stage process. The stages in this process are financial year, profit in sales, growth, business, marketing, product.

Bar Chart Ppt PowerPoint Presentation Outline Introduction
This is a bar chart ppt powerpoint presentation outline introduction. This is a one stage process. The stages in this process are sales in percentage, product, business, financial years, graph.
Scatter Bubble Chart Ppt PowerPoint Presentation Professional Graphics Pictures
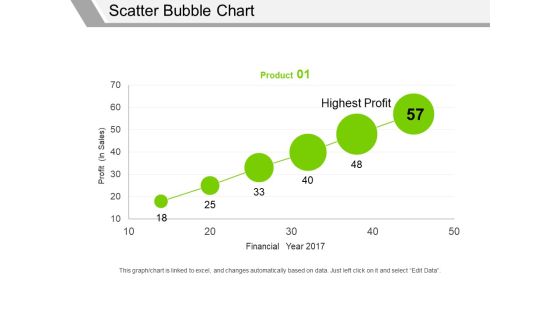
This is a scatter bubble chart ppt powerpoint presentation professional graphics pictures. This is a one stage process. The stages in this process are profit in sales, financial year, highest profit, product.

Area Chart Ppt PowerPoint Presentation Gallery Icons
This is a area chart ppt powerpoint presentation gallery icons. This is a two stage process. The stages in this process are financial year, sales in percentage, product, finance, graph.

Bar Graph Ppt PowerPoint Presentation Ideas Graphic Tips
This is a bar graph ppt powerpoint presentation ideas graphic tips. This is a three stage process. The stages in this process are financial year, sales in percentage, product, bar graph, growth.

Clustered Column Line Ppt PowerPoint Presentation Show Influencers
This is a clustered column line ppt powerpoint presentation show influencers. This is a four stage process. The stages in this process are financial year, sales in percentage, product, growth, success.
Line Chart Ppt PowerPoint Presentation Outline Infographic Template
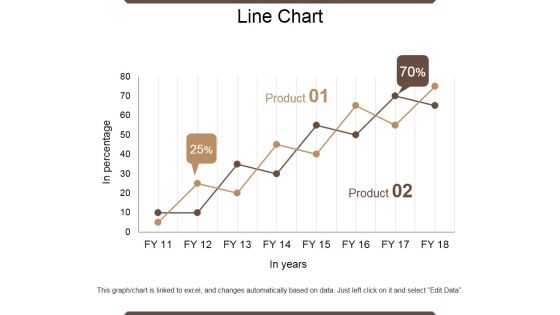
This is a line chart ppt powerpoint presentation outline infographic template. This is a two stage process. The stages in this process are in percentage, product, in year, growth, success.

Scatter Bubble Chart Ppt PowerPoint Presentation Summary Files
This is a scatter bubble chart ppt powerpoint presentation summary files. This is a six stage process. The stages in this process are product, financial year, profit, highest profit.

Area Chart Ppt PowerPoint Presentation Pictures Files
This is a area chart ppt powerpoint presentation pictures files. This is a two stage process. The stages in this process are product, sales, in percentage, financial year, business.

Bar Graph Template 1 Ppt PowerPoint Presentation Slides Format Ideas
This is a bar graph template 1 ppt powerpoint presentation slides format ideas. This is a three stage process. The stages in this process are product, years, bar graph, business, marketing.

Clustered Column Ppt PowerPoint Presentation Ideas Graphic Tips
This is a clustered column ppt powerpoint presentation ideas graphic tips. This is a two stage process. The stages in this process are financial year, sales in percentage, product, graph, business.

Area Chart Ppt PowerPoint Presentation Show Templates
This is a area chart ppt powerpoint presentation show templates. This is a two stage process. The stages in this process are product, in percentage, in years, finance, graph.

Bar Chart Ppt PowerPoint Presentation Outline Guidelines
This is a bar chart ppt powerpoint presentation outline guidelines. This is a four stage process. The stages in this process are product, unit count, in years, graph, finance, business.

Column Chart Ppt PowerPoint Presentation Summary Graphics
This is a column chart ppt powerpoint presentation summary graphics. This is a nine stage process. The stages in this process are product, years, expenditure in billions, graph, business.

Combo Chart Ppt PowerPoint Presentation Summary Layouts
This is a combo chart ppt powerpoint presentation summary layouts. This is a eight stage process. The stages in this process are product, sales in percentage, in years, in price, graph.

Area Chart Ppt PowerPoint Presentation Layouts Vector
This is a area chart ppt powerpoint presentation layouts vector. This is a two stage process. The stages in this process are area chart, product, sales in percentage, financial year.

Clustered Column Line Ppt PowerPoint Presentation Portfolio Outline
This is a clustered column line ppt powerpoint presentation portfolio outline. This is a four stage process. The stages in this process are sales in percentage, financial year, product, graph, growth.
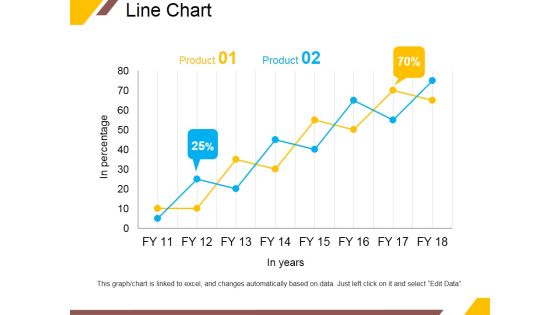
Line Chart Ppt PowerPoint Presentation Portfolio Infographic Template
This is a line chart ppt powerpoint presentation portfolio infographic template. This is a two stage process. The stages in this process are product, in years, business, percentage, growth.
Scatter Bubble Chart Ppt PowerPoint Presentation Icon Elements
This is a scatter bubble chart ppt powerpoint presentation icon elements. This is a six stage process. The stages in this process are highest profit, profit, financial year, product.

Clustered Column Ppt PowerPoint Presentation Portfolio Smartart
This is a clustered column ppt powerpoint presentation portfolio smartart. This is a two stage process. The stages in this process are financial year, product, sales in percentage, finance, business, graph.

Area Chart Ppt PowerPoint Presentation File Graphic Tips
This is a area chart ppt powerpoint presentation file graphic tips. This is a two stage process. The stages in this process are product, in percentage, financial year, business, growth.

Clustered Column Ppt PowerPoint Presentation Pictures Mockup
This is a clustered column ppt powerpoint presentation pictures mockup. This is a two stage process. The stages in this process are product, sales in percentage, financial year, graph, business.
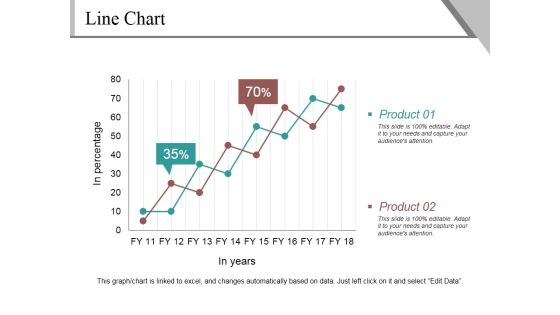
Line Chart Ppt PowerPoint Presentation Infographics Example
This is a line chart ppt powerpoint presentation infographics example. This is a two stage process. The stages in this process are product, in percentage, in years, finance, growth.
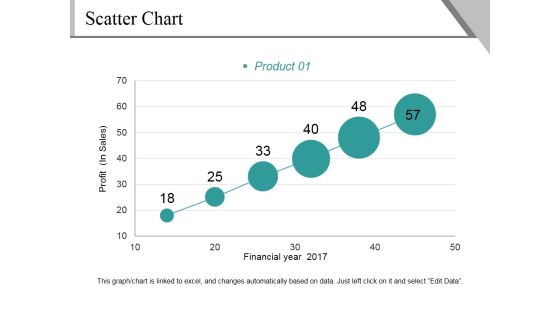
Scatter Chart Ppt PowerPoint Presentation File Background Image
This is a scatter chart ppt powerpoint presentation file background image. This is a six stage process. The stages in this process are profit, financial year, product, growth, success.

Bar Chart Ppt PowerPoint Presentation Icon Demonstration
This is a bar chart ppt powerpoint presentation icon demonstration. This is a seven stage process. The stages in this process are product, sales in percentage, financial year, graph.

Clustered Column Ppt PowerPoint Presentation File Slide
This is a clustered column ppt powerpoint presentation file slide. This is a two stage process. The stages in this process are product, financial year, sales in percentage, bar graph.
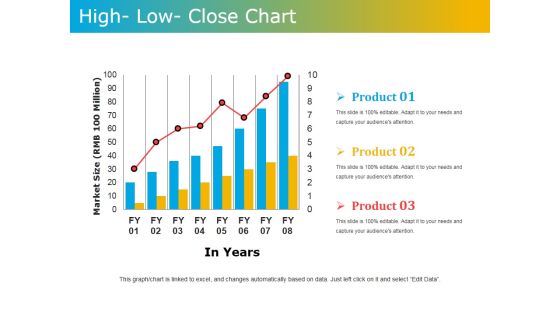
High Low Close Chart Ppt PowerPoint Presentation Model Graphics Tutorials
This is a high low close chart ppt powerpoint presentation model graphics tutorials. This is a three stage process. The stages in this process are market size, in years, product.

Clustered Column Ppt PowerPoint Presentation Slides Smartart
This is a clustered column ppt powerpoint presentation slides smartart. This is a two stage process. The stages in this process are product, sales in percentage, financial year, bar graph.

Stacked Line Chart Ppt PowerPoint Presentation Pictures Elements
This is a stacked line chart ppt powerpoint presentation pictures elements. This is a two stage process. The stages in this process are product, profit, stacked line chart, year, business.

Column Chart Ppt PowerPoint Presentation Gallery Background
This is a column chart ppt powerpoint presentation gallery background. This is a two stage process. The stages in this process are product, sales in percentage, financial year, graph, success.

Line Chart Ppt PowerPoint Presentation Professional Graphics Design
This is a line chart ppt powerpoint presentation professional graphics design. This is a two stage process. The stages in this process are financial years, sales in percentage, product, growth, success.

Line Chart Ppt PowerPoint Presentation Infographics Infographics
This is a line chart ppt powerpoint presentation infographics infographics. This is a two stage process. The stages in this process are product, sales in percentage, financial year, line chart, finance.

Column Chart Ppt PowerPoint Presentation Model Graphics Download
This is a column chart ppt powerpoint presentation model graphics download. This is a two stage process. The stages in this process are product, financial year, sales in percentage, bar graph, success.

Line Chart Ppt PowerPoint Presentation Layouts Example
This is a line chart ppt powerpoint presentation layouts example. This is a two stage process. The stages in this process are sales in percentage, product, financial years, growth, success.

Clustered Column Ppt PowerPoint Presentation File Graphics
This is a clustered column ppt powerpoint presentation file graphics. This is a two stage process. The stages in this process are product, financial year, sales in percentage, graph, growth.

Line Chart Ppt PowerPoint Presentation File Example File
This is a line chart ppt powerpoint presentation file example file. This is a two stage process. The stages in this process are product, in percentage, in years, growth, success.

Column Chart Ppt PowerPoint Presentation Infographics Deck
This is a column chart ppt powerpoint presentation infographics deck. This is a two stage process. The stages in this process are product, expenditure in, years, bar graph, growth.

Clustered Column Line Ppt PowerPoint Presentation Icon Good
This is a clustered column line ppt powerpoint presentation icon good. This is a three stage process. The stages in this process are product, financial year, bar graph, business, growth.
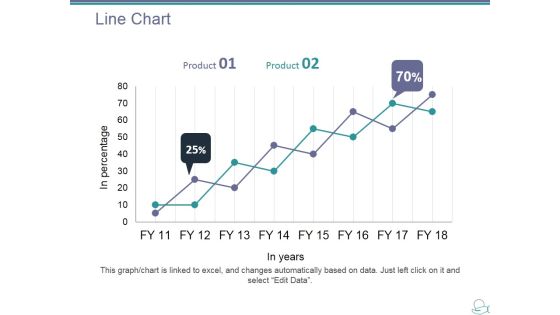
Line Chart Ppt PowerPoint Presentation Layouts Show
This is a line chart ppt powerpoint presentation layouts show. This is a two stage process. The stages in this process are product, in years, in percentage, line chart, growth.

Bar Chart Ppt PowerPoint Presentation Icon Information
This is a bar chart ppt powerpoint presentation icon information. This is a one stage process. The stages in this process are product, sales in percentage, financial years, bar graph, growth.
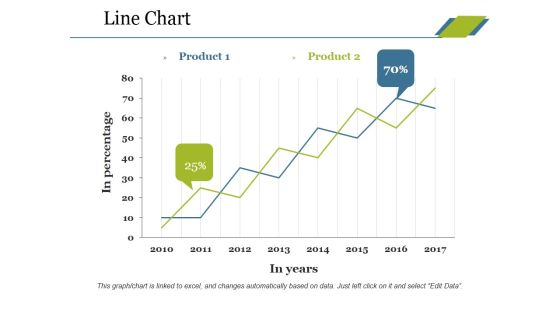
Line Chart Ppt PowerPoint Presentation Professional Tips
This is a line chart ppt powerpoint presentation professional tips. This is a two stage process. The stages in this process are product, in percentage, in years, growth, success.

Line Chart Ppt PowerPoint Presentation Slides Ideas
This is a line chart ppt powerpoint presentation slides ideas. This is a two stage process. The stages in this process are product, in percentage, in years, growth, success.

Column Chart Ppt PowerPoint Presentation Portfolio Slide Download
This is a column chart ppt powerpoint presentation portfolio slide download. This is a two stage process. The stages in this process are product, year, bar graph, success, business.

Line Chart Ppt PowerPoint Presentation Show Guide
This is a line chart ppt powerpoint presentation show guide. This is a two stage process. The stages in this process are product, sales in percentage, financial years, growth, success.
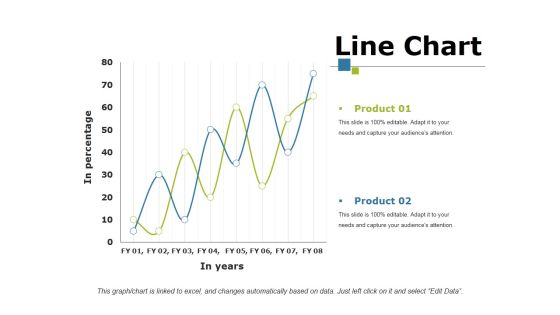
Line Chart Ppt PowerPoint Presentation Portfolio Mockup
This is a line chart ppt powerpoint presentation portfolio mockup. This is a two stage process. The stages in this process are product, in percentage, in year, growth, success.

Column Chart Ppt PowerPoint Presentation Layouts Graphics Example
This is a column chart ppt powerpoint presentation layouts graphics example. This is a two stage process. The stages in this process are product, year, bar graph, business, finance.

Line Chart Ppt PowerPoint Presentation Gallery Rules
This is a line chart ppt powerpoint presentation gallery rules. This is a two stage process. The stages in this process are financial years, product, sales in percentage, line chart, growth.

Clustered Column Ppt PowerPoint Presentation Gallery Structure
This is a clustered column ppt powerpoint presentation gallery structure. This is a two stage process. The stages in this process are product, sales in percentage, financial year, bar graph, finance.

Bar Chart Ppt PowerPoint Presentation Inspiration Demonstration
This is a bar chart ppt powerpoint presentation inspiration demonstration. This is a two stage process. The stages in this process are bar chart, financial years, sales in percentage, product, finance.

Column Chart Ppt PowerPoint Presentation Gallery Slide Portrait
This is a column chart ppt powerpoint presentation gallery slide portrait. This is a two stage process. The stages in this process are sales in percentage, financial year, product, bar graph, growth.

Line Chart Ppt PowerPoint Presentation Gallery Templates
This is a line chart ppt powerpoint presentation gallery templates. This is a two stage process. The stages in this process are product, financial years, sales in percentage, line chart.

Column Chart Ppt PowerPoint Presentation Styles Graphics Design
This is a column chart ppt powerpoint presentation styles graphics design. This is a two stage process. The stages in this process are expenditure in, product, years, growth, success.

Column Chart Ppt PowerPoint Presentation File Summary
This is a column chart ppt powerpoint presentation file summary. This is a two stage process. The stages in this process are product, dollars, in years, bar graph, growth.

Column Chart Ppt PowerPoint Presentation Ideas Vector
This is a column chart ppt powerpoint presentation ideas vector. This is a two stage process. The stages in this process are column chart, product, financial years, sales in percentage, growth.

High Low Close Chart Ppt PowerPoint Presentation Portfolio Topics
This is a high low close chart ppt powerpoint presentation portfolio topics. This is a three stage process. The stages in this process are product, market size, in years, success, bar graph.

Column Chart Ppt PowerPoint Presentation Pictures Graphic Images
This is a column chart ppt powerpoint presentation pictures graphic images. This is a two stage process. The stages in this process are product, years, growth, success, bar graph.

Line Chart Ppt PowerPoint Presentation Slides Mockup
This is a line chart ppt powerpoint presentation slides mockup. This is a two stage process. The stages in this process are in percentage, in years, product, growth, success.

Bar Chart Ppt PowerPoint Presentation Outline Backgrounds
This is a bar chart ppt powerpoint presentation outline backgrounds. This is a one stage process. The stages in this process are sales in percentage, financial years, product, bar graph, finance.

Bar Chart Ppt PowerPoint Presentation Model Picture
This is a bar chart ppt powerpoint presentation model picture. This is a two stage process. The stages in this process are product, sales in percentage, financial years, bar chart.

Bar Chart Ppt PowerPoint Presentation Ideas Deck
This is a bar chart ppt powerpoint presentation ideas deck. This is a two stage process. The stages in this process are product, in percentage, in years, financial, business.

Column Chart Ppt PowerPoint Presentation Infographics Guidelines
This is a column chart ppt powerpoint presentation infographics guidelines. This is a two stage process. The stages in this process are product, expenditure in, years, business, bar graph.
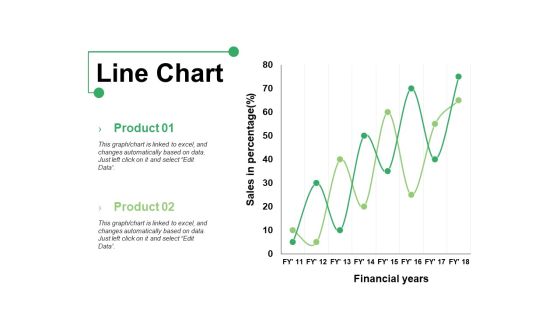
Line Chart Ppt PowerPoint Presentation Show Graphics Example
This is a line chart ppt powerpoint presentation show graphics example. This is a two stage process. The stages in this process are product, line chart, financial years, sales in percentage.

Bar Chart Ppt PowerPoint Presentation Infographics Format Ideas
This is a bar chart ppt powerpoint presentation infographics format ideas. This is a two stage process. The stages in this process are bar graph, product, financial year, sales in percentage.

Line Chart Ppt PowerPoint Presentation Professional Grid
This is a line chart ppt powerpoint presentation professional grid. This is a two stage process. The stages in this process are sales in percentage, financial years, product, line chart.
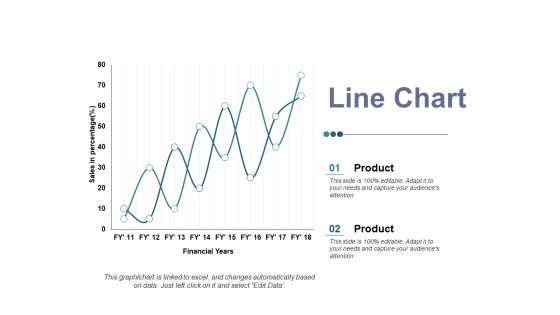
Line Chart Ppt PowerPoint Presentation Ideas Elements
This is a line chart ppt powerpoint presentation ideas elements. This is a two stage process. The stages in this process are product, sales in percentage, financial year, business, line chart.

Stacked Line Template 1 Ppt PowerPoint Presentation Infographic Template Graphics
This is a stacked line template 1 ppt powerpoint presentation infographic template graphics. This is a three stage process. The stages in this process are product, unit count, in years, business, marketing.

Line Chart Ppt PowerPoint Presentation Infographic Template Master Slide
This is a line chart ppt powerpoint presentation infographic template master slide. This is a two stage process. The stages in this process are product, financial years, sales in percentage.

Bar Chart Ppt PowerPoint Presentation Slides Example File
This is a bar chart ppt powerpoint presentation slides example file. This is a two stage process. The stages in this process are product, financial years, sales in percentage.

Clustered Column Ppt PowerPoint Presentation Infographic Template Backgrounds
This is a clustered column ppt powerpoint presentation infographic template backgrounds. This is a two stage process. The stages in this process are sales in percentage, financial year, product.
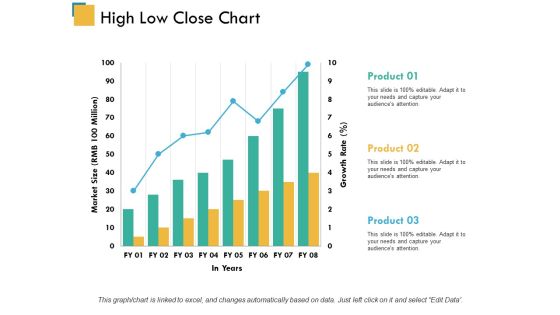
High Low Close Chart Ppt PowerPoint Presentation Model Inspiration
This is a high low close chart ppt powerpoint presentation model inspiration. This is a three stage process. The stages in this process are product, market size, in years.
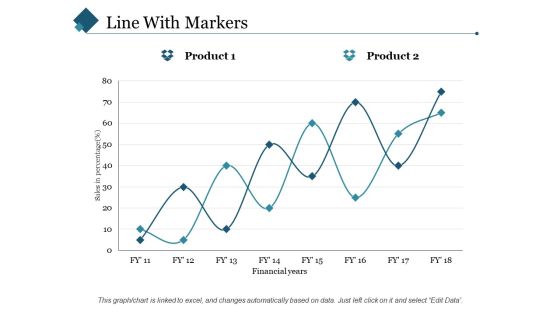
Line With Markers Ppt PowerPoint Presentation Styles Slide Portrait
This is a line with markers ppt powerpoint presentation styles slide portrait. This is a two stage process. The stages in this process are sales in percentage, financial years, product.

Area Chart Ppt PowerPoint Presentation Icon Summary
This is a area chart ppt powerpoint presentation icon summary. This is a two stage process. The stages in this process are financial year, area chart, in percentage, product.

Area Stacked Ppt PowerPoint Presentation Infographics Shapes
This is a area stacked ppt powerpoint presentation infographics shapes. This is a two stage process. The stages in this process are product, area stacked, sales in percentage, financial year.
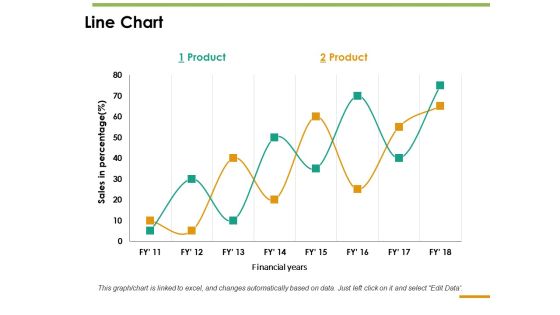
Line Chart Ppt PowerPoint Presentation Inspiration Guide
This is a line chart ppt powerpoint presentation inspiration guide. This is a two stage process. The stages in this process are line chart, sales in percentage, product, financial years.

Area Chart Ppt PowerPoint Presentation Icon Show
This is a area chart ppt powerpoint presentation icon show. This is a two stage process. The stages in this process are product, financial year, in percentage, area chart.

Clustered Chart Ppt PowerPoint Presentation Outline Templates
This is a clustered chart ppt powerpoint presentation outline templates. This is a three stage process. The stages in this process are product, in percentage, in years, clustered chart.

Combo Chart Ppt PowerPoint Presentation Gallery Diagrams
This is a combo chart ppt powerpoint presentation gallery diagrams. This is a three stage process. The stages in this process are combo chart, market size, product, in years, growth rate.

Stacked Area Clustered Column Ppt PowerPoint Presentation Summary Slides
This is a stacked area clustered column ppt powerpoint presentation summary slides. This is a three stage process. The stages in this process are product, in percentage, financial year, bar graph.

Line Chart Ppt PowerPoint Presentation Gallery Format Ideas
This is a line chart ppt powerpoint presentation gallery format ideas. This is a two stage process. The stages in this process are line chart, product, in year, profit.

Column Chart Ppt PowerPoint Presentation Gallery Background Images
This is a column chart ppt powerpoint presentation gallery background images. This is a two stage process. The stages in this process are column chart, product, year, growth, expenditure.

Column Chart Ppt PowerPoint Presentation Portfolio Example Topics
This is a column chart ppt powerpoint presentation portfolio example topics. This is a two stage process. The stages in this process are product, financial year, sales in percentage, column chart.

Column Chart Ppt PowerPoint Presentation Slides Show
This is a column chart ppt powerpoint presentation slides show. This is a two stage process. The stages in this process are column chart, product, sales in percentage, financial year, growth.
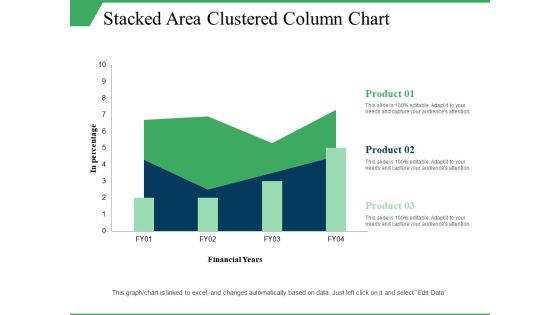
Stacked Area Clustered Column Chart Ppt PowerPoint Presentation Visual Aids Model
This is a stacked area clustered column chart ppt powerpoint presentation visual aids model. This is a three stage process. The stages in this process are in percentage, product, financial years, growth, column chart.
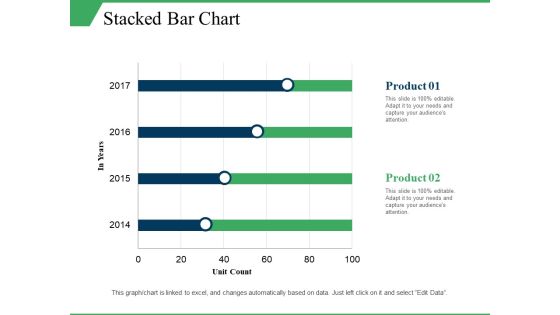
Stacked Bar Chart Ppt PowerPoint Presentation Infographics Elements
This is a stacked bar chart ppt powerpoint presentation infographics elements. This is a two stage process. The stages in this process are stacked bar chart, product, unit count, in year.

Stacked Area Clustered Column Ppt PowerPoint Presentation Professional Influencers
This is a stacked area clustered column ppt powerpoint presentation professional influencers. This is a three stage process. The stages in this process are stacked area clustered column, percentage, product, year.
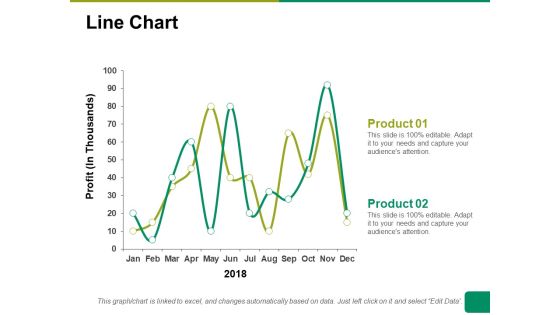
Line Chart Ppt PowerPoint Presentation Summary Ideas
This is a line chart ppt powerpoint presentation summary ideas. This is a two stage process. The stages in this process are line chart, profit, product, financial years, business.

Column Chart Ppt PowerPoint Presentation Icon Show
This is a column chart ppt powerpoint presentation icon show. This is a two stage process. The stages in this process are column chart, product, years, bar graph, growth.

Combo Chart Ppt PowerPoint Presentation Slides Outline
This is a combo chart ppt powerpoint presentation slides outline. This is a three stage process. The stages in this process are combo chart, growth, product, financial year, business.

Area Chart Financial Ppt PowerPoint Presentation Outline Professional
This is a area chart financial ppt powerpoint presentation outline professional. This is a four stage process. The stages in this process are product, sales in percentage, financial year.

Bar Graph Ppt PowerPoint Presentation Styles Skills
This is a bar graph ppt powerpoint presentation styles skills. This is a two stage process. The stages in this process are bar graph, product, in year, in percentage, business.

Stacked Column Chart Ppt PowerPoint Presentation Summary Gallery
This is a stacked column chart ppt powerpoint presentation summary gallery. This is a two stage process. The stages in this process are stacked column chart, product, in years, growth, percentage.

Column Chart Ppt PowerPoint Presentation Layouts File Formats
This is a column chart ppt powerpoint presentation layouts file formats. This is a three stage process. The stages in this process are column chart, product, in percentage, year, finance.
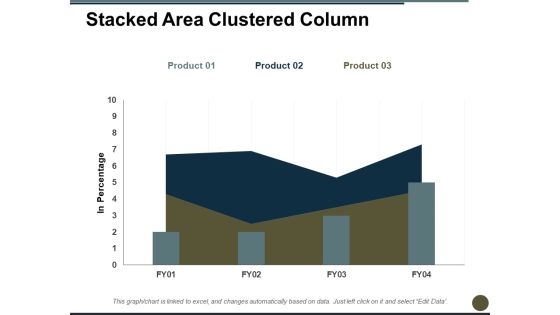
Stacked Area Clustered Column Ppt PowerPoint Presentation Professional Graphics
This is a stacked area clustered column ppt powerpoint presentation professional graphics. This is a three stage process. The stages in this process are in percentage, bar chart, product, growth, year.

Clustered Column Chart Ppt PowerPoint Presentation Professional Ideas
This is a clustered column chart ppt powerpoint presentation professional ideas. This is a three stage process. The stages in this process are product, sales in percentage, column, years.

Clustered Bar Capability Maturity Matrix Ppt PowerPoint Presentation Summary Show
This is a clustered bar capability maturity matrix ppt powerpoint presentation summary show. This is a three stage process. The stages in this process are clustered bar, product, year, business, marketing.

Clustered Column Capability Maturity Matrix Ppt PowerPoint Presentation Pictures Slideshow
This is a clustered column capability maturity matrix ppt powerpoint presentation pictures slideshow. This is a three stage process. The stages in this process are clustered column, product, year, business, marketing.

Stacked Column Capability Maturity Matrix Ppt PowerPoint Presentation Model Shapes
This is a stacked column capability maturity matrix ppt powerpoint presentation model shapes. This is a three stage process. The stages in this process are stacked column, product, year, finance, business.
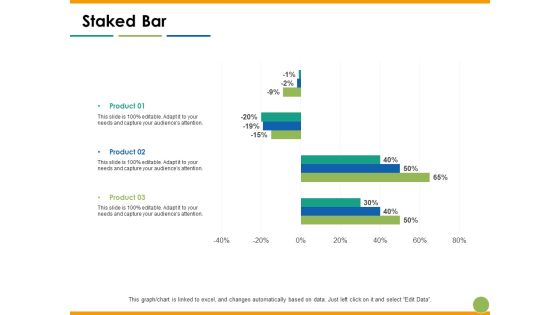
Staked Bar Capability Maturity Matrix Ppt PowerPoint Presentation Slides Outfit
This is a staked bar capability maturity matrix ppt powerpoint presentation slides outfit. This is a three stage process. The stages in this process are staked bar, product, year, finance, percentage.
Stacked Area Clustered Column Ppt PowerPoint Presentation Inspiration Icon
This is a stacked area clustered column ppt powerpoint presentation inspiration icon. This is a three stage process. The stages in this process are stacked area clustered column, product, year, in dollars, business.

Stacked Bar Chart Ppt PowerPoint Presentation Portfolio Templates
This is a stacked bar chart ppt powerpoint presentation portfolio templates. This is a three stage process. The stages in this process are stacked bar chart, product, year, business, finance.

Clustered Bar Finance Ppt Powerpoint Presentation Ideas Themes
This is a clustered bar finance ppt powerpoint presentation ideas themes. This is a three stage process. The stages in this process are clustered bar, product, in percentage, years, profit.
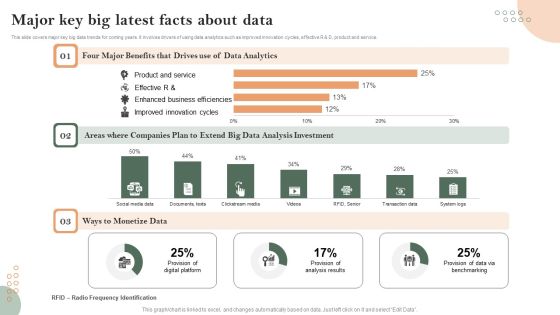
Major Key Big Latest Facts About Data Guidelines PDF
This slide covers major key big data trends for coming years. It involves drivers of using data analytics such as improved innovation cycles, effective R and D, product and service.

Timeline For Team Business Target Achievement Powerpoint Slides
This PowerPoint template contains circles around business team. It may be used to display analysis of team strategy. Download this PPT slide to demonstrate how you intend to navigate your steps towards the desired corporate goal.

Action Steps To Increase Consumer Satisfaction Infographics PDF
The slide showcases an action plan that provides an enterprise a base for creating an action plan for increasing customer satisfaction. It involves companywide goal, understand goal, recognize and address customer touch points, identify right team members and identify KPIs to monitor and review. Presenting Action Steps To Increase Consumer Satisfaction Infographics PDF to dispense important information. This template comprises five stages. It also presents valuable insights into the topics including Understand Goal, Identify Right, Members, Review. This is a completely customizable PowerPoint theme that can be put to use immediately. So, download it and address the topic impactfully.
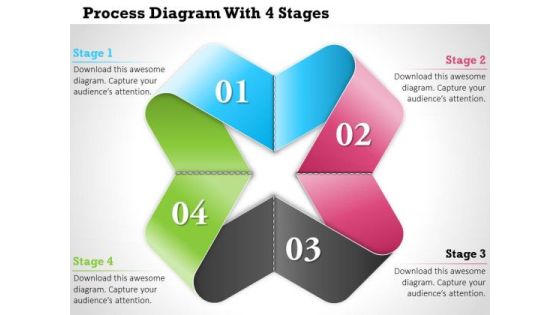
Consulting Slides Business Process Diagram With 4 Stages Business Presentation
Use this graphic to explain your professional ideas that are broad based but combined for specific goal. It is an excellent graphic to attract the attention of your audience. Illustrate your plan of action with this diagram.
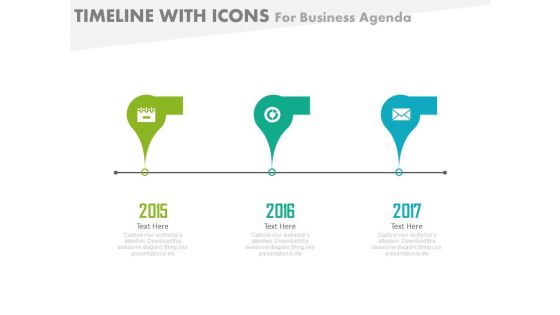
Three Staged Business Strategy Analysis Powerpoint Slides
This PowerPoint template contains three staged timeline diagram. It may be used to display analysis of business strategy. Download this PPT slide to demonstrate how you intend to navigate your steps towards the desired corporate goal.

Mentorship For Effective Business Diagram Powerpoint Templates
This is a mentorship for effective business diagram powerpoint templates. This is a eight stage process. The stages in this process are advice, training, direction, success, coaching, goal, motivation, support, mentoring.

Business Analysis Vision Diagram Sample Presentations
This is a business analysis vision diagram sample presentations. This is a eight stage process. The stages in this process are connect, teamwork, research, innovation, vision, strategy, growth, goal.

Business Analysis Foundation Ppt Powerpoint Presentation
This is a business analysis foundation ppt powerpoint presentation. This is a eight stage process. The stages in this process are innovation, implement, trust, solution, success, goal, strategy, creativity.

Customer Acquiring Price For Retaining New Clients Timeline Of Companys Client Acquisition Costs Elements PDF
This slide shows the trends in CAC costs and cost of PPC. This table shows an increasing CAC over years. This table shows data for 4 years. Deliver an awe inspiring pitch with this creative customer acquiring price for retaining new clients timeline of companys client acquisition costs elements pdf bundle. Topics like timeline of companys client acquisition costs can be discussed with this completely editable template. It is available for immediate download depending on the needs and requirements of the user.

Timeline Of Companys Client Acquisition Costs Microsoft PDF
This slide shows the trends in CAC costs and cost of PPC. This table shows an increasing CAC over years. This table shows data for 4 years. Deliver an awe inspiring pitch with this creative timeline of companys client acquisition costs microsoft pdf bundle. Topics like timeline of companys client acquisition costs can be discussed with this completely editable template. It is available for immediate download depending on the needs and requirements of the user.
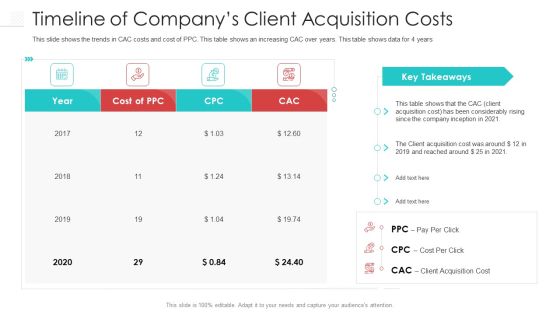
Timeline Of Companys Client Acquisition Costs Sample PDF
This slide shows the trends in CAC costs and cost of PPC. This table shows an increasing CAC over years. This table shows data for 4 years. Deliver an awe inspiring pitch with this creative timeline of companys client acquisition costs sample pdf bundle. Topics like timeline of companys client acquisition costs can be discussed with this completely editable template. It is available for immediate download depending on the needs and requirements of the user.
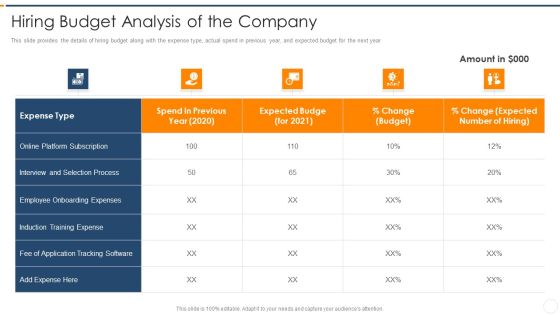
Recruitment Training Enhance Candidate Hiring Process Hiring Budget Analysis Of The Company Background PDF
This slide provides the details of hiring budget along with the expense type, actual spend in previous year, and expected budget for the next year. Deliver an awe inspiring pitch with this creative recruitment training enhance candidate hiring process hiring budget analysis of the company background pdf bundle. Topics like hiring budget analysis of the company can be discussed with this completely editable template. It is available for immediate download depending on the needs and requirements of the user.
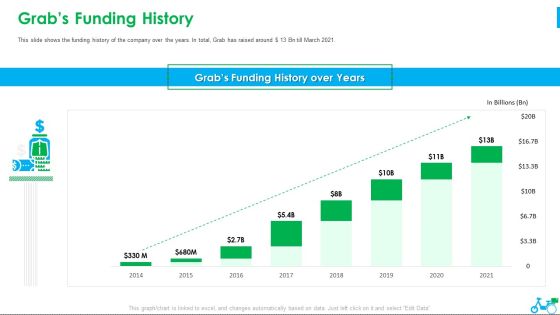
Grab Investor Financing Elevator Grabs Funding History Ppt Summary Example PDF
This slide shows the funding history of the company over the years. In total, Grab has raised around Dollar 13 Bn till March 2021. Deliver and pitch your topic in the best possible manner with this Grab Investor Financing Elevator Grabs Funding History Ppt Summary Example PDF. Use them to share invaluable insights on Grabs Funding History over Years, 2014 TO 2021 and impress your audience. This template can be altered and modified as per your expectations. So, grab it now.
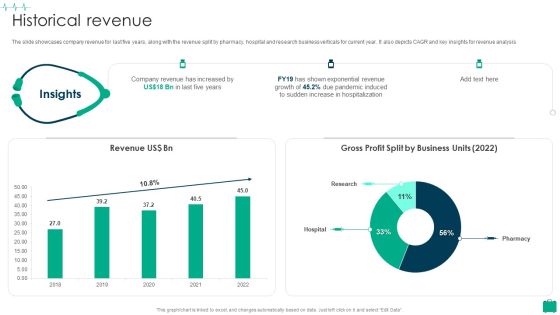
Healthcare Services Company Profile Historical Revenue Brochure PDF
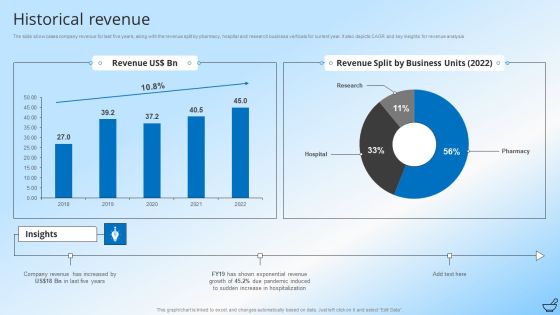
The slide showcases company revenue for last five years, along with the revenue split by pharmacy, hospital and research business verticals for current year. It also depicts CAGR and key insights for revenue analysis.Deliver an awe inspiring pitch with this creative Healthcare Services Company Profile Historical Revenue Brochure PDF bundle. Topics like Revenue Increased, Exponential Revenue, Increase Hospitalization can be discussed with this completely editable template. It is available for immediate download depending on the needs and requirements of the user.

Investment Banking Security Underwriting Pitchbook Major Investment Banking Deals Summary PDF
The slide provides the top five deals by profit amount of the company in last five years. It comprises, year, client name, deal type and brief information about all the five deals.Deliver an awe inspiring pitch with this creative Investment Banking Security Underwriting Pitchbook Major Investment Banking Deals Summary PDF bundle. Topics like Provided Underwriting, Provides Commitment, Healthcare Company can be discussed with this completely editable template. It is available for immediate download depending on the needs and requirements of the user.

Portable Home Safety Systems Company Profile Competitive Operations And Financials Sample PDF
This slide highlights the security company competitive analysis which includes founding year, recurring monthly revenue, CSR initiatives, revenue, net profit and employee count. Deliver an awe inspiring pitch with this creative Portable Home Safety Systems Company Profile Competitive Operations And Financials Sample PDF bundle. Topics like Founding year, Net profit, CSR initiatives can be discussed with this completely editable template. It is available for immediate download depending on the needs and requirements of the user.

Compensation Survey Sheet Interpretation Of Survey Cont Topics PDF
This slide translates the interpretation of conducting salary survey. It represents the data showing salary raise in previous year, percentage increase in salary, and bonus receive in past year. Deliver an awe inspiring pitch with this creative Compensation Survey Sheet Interpretation Of Survey Cont Topics PDF bundle. Topics like Interpretation Of Survey can be discussed with this completely editable template. It is available for immediate download depending on the needs and requirements of the user.

Income Assessment Report Compare Key Survey Findings With Industry Highlights Sample PDF
This slide translates the interpretation of conducting salary survey. It represents the data showing salary raise in previous year, percentage increase in salary, and bonus receive in past year.Deliver an awe inspiring pitch with this creative Income Assessment Report Compare Key Survey Findings With Industry Highlights Sample PDF bundle. Topics like Average Increments, Reasons For Attrition, Junior Management can be discussed with this completely editable template. It is available for immediate download depending on the needs and requirements of the user.

Income Assessment Report Interpretation Of Survey Contd Portrait PDF
This slide translates the interpretation of conducting salary survey. It represents the data showing salary raise in previous year, percentage increase in salary, and bonus receive in past year.Deliver and pitch your topic in the best possible manner with this Income Assessment Report Interpretation Of Survey Contd Portrait PDF. Use them to share invaluable insights on Increment Criteria, Projected Increment, Middle Management and impress your audience. This template can be altered and modified as per your expectations. So, grab it now.

Medical Care Company Overview Historical Revenue Microsoft PDF
The slide showcases company revenue for last five years, along with the revenue split by pharmacy, hospital and research business verticals for current year. It also depicts CAGR and key insights for revenue analysis. Deliver an awe inspiring pitch with this creative Medical Care Company Overview Historical Revenue Microsoft PDF bundle. Topics like Historical Revenue can be discussed with this completely editable template. It is available for immediate download depending on the needs and requirements of the user.
Pharmaceutical And Clinical Research Summary Historical Revenue Microsoft PDF
The slide showcases company revenue for last five years, along with the revenue split by pharmacy, hospital and research business verticals for current year. It also depicts CAGR and key insights for revenue analysis. Deliver an awe inspiring pitch with this creative Pharmaceutical And Clinical Research Summary Historical Revenue Microsoft PDF bundle. Topics like Company Revenue, Business Units can be discussed with this completely editable template. It is available for immediate download depending on the needs and requirements of the user.

Income Assessment Document Compare Key Survey Findings With Industry Elements PDF
This slide translates the interpretation of conducting salary survey. It represents the data showing salary raise in previous year, percentage increase in salary, and bonus receive in past year. Deliver an awe inspiring pitch with this creative Income Assessment Document Compare Key Survey Findings With Industry Elements PDF bundle. Topics like Employees, Average Increments, Senior Management can be discussed with this completely editable template. It is available for immediate download depending on the needs and requirements of the user.
Strategic Planning Exercises For Business Groups Powerpoint Graphics
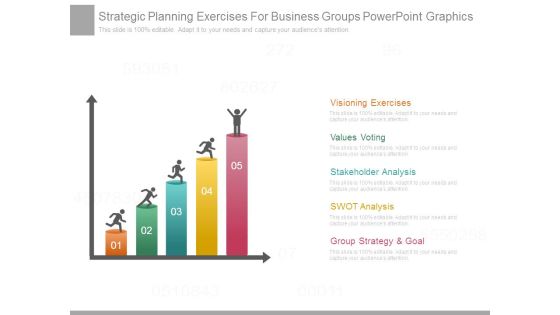
This is a strategic planning exercises for business groups powerpoint graphics. This is a five stage process. The stages in this process are visioning exercises, values voting, stakeholder analysis, swot analysis, group strategy and goal.

Business Problem Solving Approach Ppt Background Graphics
This is a business problem solving approach ppt background graphics. This is a four stage process. The stages in this process are business goal, dependent variables, independent variables, business drivers and relationship.

Traditional Business Ideas Ppt Powerpoint Images
This is a traditional business ideas ppt powerpoint images. This is a four stage process. The stages in this process are take action, action, energy, reality, goal, simplify, conscious awareness, take awes and turning points, acknowledgement and applause.

Circles With Business Deal Financial Strategy Icons Powerpoint Templates
This PPT slide displays diagram of circles with financial strategy icons. This PowerPoint template has been designed to exhibit how to work together to achieve a common goal. You can present your opinions using this impressive slide

Business Analysis Internship Ppt Powerpoint Slides
This is a business analysis internship ppt powerpoint slides. This is a seven stage process. The stages in this process are goal, personal development, skills, experiences, training, mentor, opportunity.

Investment Management Business Plan Powerpoint Layout
This is a investment management business plan powerpoint layout. This is a five stage process. The stages in this process are needs and goal, monitor report revise, customized portfolio, design and implement, asset allocation principal.
FY23 Projected Revenue And Expense With Objective Details One Pager Documents
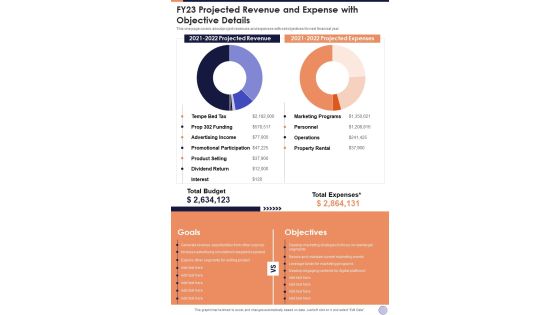
This one page covers about project revenues and expenses with set objectives for next financial year. Presenting you an exemplary FY23 Projected Revenue And Expense With Objective Details One Pager Documents. Our one-pager comprises all the must-have essentials of an inclusive document. You can edit it with ease, as its layout is completely editable. With such freedom, you can tweak its design and other elements to your requirements. Download this FY23 Projected Revenue And Expense With Objective Details One Pager Documents brilliant piece now.
Business Development And Strategy Sample Diagram Powerpoint Images
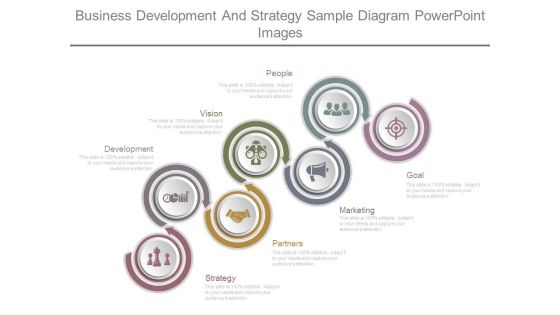
This is a business development and strategy sample diagram powerpoint images. This is a seven stage process. The stages in this process are development, strategy, vision, partners, marketing, people, goal.

Our Achievements Business Ppt PowerPoint Presentation Inspiration Good
This is a our achievements business ppt powerpoint presentation inspiration good. This is a six stage process. The stages in this process are our mission, vision, goal, business, strategy.

Business Target Steps Tags Sample Of Ppt Presentation
This is a business target steps tags sample of ppt presentation. This is a six stage process. The stages in this process are goal, conservative growth, moderate growth, moderate aggressive growth, aggressive growth more diversification, conservative growth, concentrated aggressive growth.

Activities Of Business Strategic Planning Example Of Ppt Presentation
This is a activities of business strategic planning example of ppt presentation. This is a five stage process. The stages in this process are goal, execute, strategize, envision solution, identify problem.

Our Mission Business Marketing Planning Ppt PowerPoint Presentation Infographics Styles
This is a our mission business marketing planning ppt powerpoint presentation infographics styles. This is a one stage process. The stages in this process are our mission, vision, goal, marketing, strategy.
Our Mission Companys Business Model Canvas Ppt PowerPoint Presentation Icon Introduction
This is a our mission companys business model canvas ppt powerpoint presentation icon introduction. This is a three stage process. The stages in this process are mission, vision, goal, management, value.
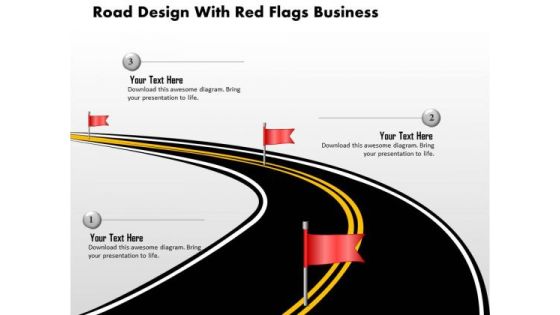
Consulting Slides Road Design With Red Flags Business Presentation
Use this roadmap diagram for achieving a particular goal. You can edit the given placeholders to add your own text and you will be on your way to making an attractive roadmap presentation.

Product Overview Template 3 Ppt PowerPoint Presentation Slides Display
This is a product overview template 3 ppt powerpoint presentation slides display. This is a three stage process. The stages in this process are project overview, business issue opportunity, project business goal, business, management.

Product Overview Template 3 Ppt PowerPoint Presentation Outline Grid
This is a product overview template 3 ppt powerpoint presentation outline grid. This is a three stage process. The stages in this process are project overview, business issue opportunity, project business goal.

Heart Framework To Business Online Success Measurement Download PDF
The following slide illustrates HEART framework to track E-business success. It provides information about happiness, engagement, adoption, retention, task success, goal, signals, metrics, etc. Pitch your topic with ease and precision using this Heart Framework To Business Online Success Measurement Download PDF. This layout presents information on Heart Framework, Goal, Metrics. It is also available for immediate download and adjustment. So, changes can be made in the color, design, graphics or any other component to create a unique layout.
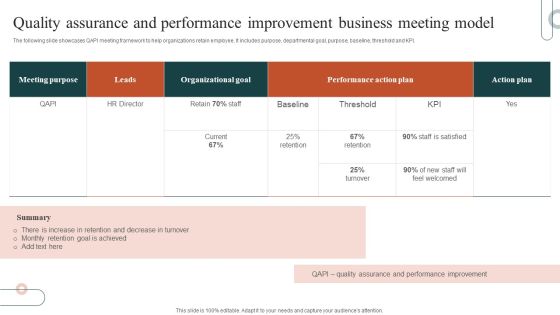
Quality Assurance And Performance Improvement Business Meeting Model Background PDF
The following slide showcases QAPI meeting framework to help organizations retain employee. It includes purpose, departmental goal, purpose, baseline, threshold and KPI. Showcasing this set of slides titled Quality Assurance And Performance Improvement Business Meeting Model Background PDF. The topics addressed in these templates are Organizational Goal, Performance Action Plan, Action Plan. All the content presented in this PPT design is completely editable. Download it and make adjustments in color, background, font etc. as per your unique business setting.
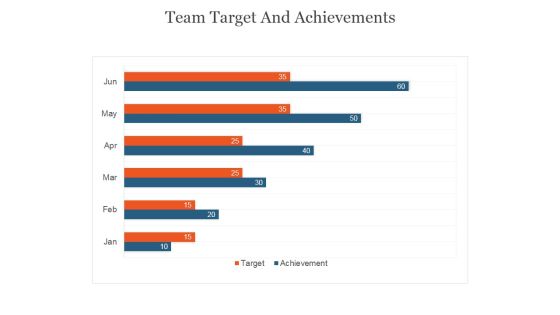
Team Target And Achievements Ppt PowerPoint Presentation Background Designs
This is a team target and achievements ppt powerpoint presentation background designs. This is a three stage process. The stages in this process are overall territory performance, task done, estimation done, complexity done, weight, to goal.
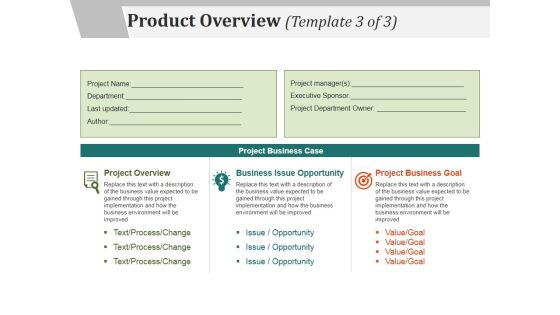
Product Overview Template 3 Ppt PowerPoint Presentation Show Templates
This is a product overview template 3 ppt powerpoint presentation show templates. This is a three stage process. The stages in this process are project overview, business issue opportunity, project business goal, project business case.

Stock Photo Multiple Blue Arrows In Circle Team PowerPoint Slide
Make awesome presentations with this multiple blue arrows in circle. Arrows are often used for demonstrating the idea of reaching a goal. Use this professional image for making business, finance related presentations.
Our Mission Values Ppt PowerPoint Presentation Icon Graphics Pictures
This is a our mission values ppt powerpoint presentation icon graphics pictures. This is a three stage process. The stages in this process are our mission, vision, goal, marketing, strategy.

Our Mission And Vision Ppt PowerPoint Presentation Ideas Objects
This is a our mission and vision ppt powerpoint presentation ideas objects. This is a three stage process. The stages in this process are our mission, vision, goal, business, strategy.
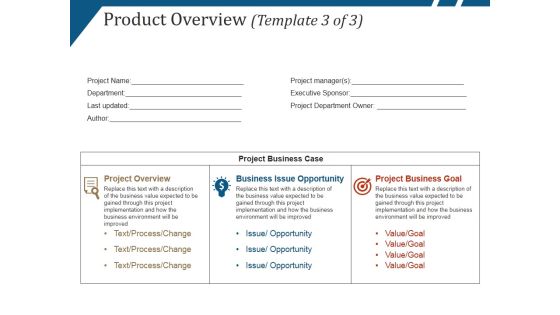
Product Overview Template 3 Ppt PowerPoint Presentation Ideas Design Templates
This is a product overview template 3 ppt powerpoint presentation ideas design templates. This is a three stage process. The stages in this process are project overview, business issue opportunity, project business goal.

Diagram Of Agile Methodology Powerpoint Templates
This PPT slide displays diagram of agile methodology. This has been designed to exhibit how to work together to achieve a common goal. You can present your opinions using this impressive slide

Business Journey Employee Action Plan In A Company Ppt Infographic Template Model PDF
This slide covers the employee action plan based on goal, objective, activities performed, lead accountability and involved partners details. Deliver and pitch your topic in the best possible manner with this business journey employee action plan in a company ppt infographic template model pdf. Use them to share invaluable insights on goal, objective, activities performed, lead accountability, involved partners details and impress your audience. This template can be altered and modified as per your expectations. So, grab it now.
Our Mission Ppt PowerPoint Presentation Portfolio Icons
This is a our mission ppt powerpoint presentation portfolio icons. This is a three stage process. The stages in this process are our vision, our mission, our goal, business, management.
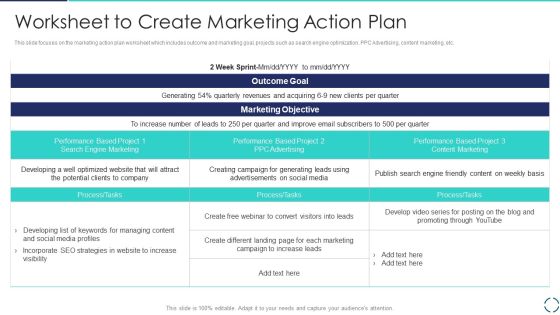
Optimizing E Business Promotion Plan Worksheet To Create Marketing Action Plan Formats PDF
This slide focuses on the marketing action plan worksheet which includes outcome and marketing goal, projects such as search engine optimization, PPC Advertising, content marketing, etc. Deliver an awe inspiring pitch with this creative Optimizing E Business Promotion Plan Worksheet To Create Marketing Action Plan Formats PDF bundle. Topics like Marketing Objective, Outcome Goal, Process can be discussed with this completely editable template. It is available for immediate download depending on the needs and requirements of the user.

Our Mission Values Ppt PowerPoint Presentation Slides Tips
This is a our mission values ppt powerpoint presentation slides tips. This is a three stage process. The stages in this process are our mission, vision, goal, marketing, strategy.
Formulate An Action Plan Ppt PowerPoint Presentation Icon Elements
This is a formulate an action plan ppt powerpoint presentation icon elements. This is a four stage process. The stages in this process are action plan, change behavior, goal, table, business.
Our Mission And Vision Ppt PowerPoint Presentation Inspiration Icons
This is a our mission and vision ppt powerpoint presentation inspiration icons. This is a three stage process. The stages in this process are our mission, vision, goal, business, strategy.
Our Mission And Vision Ppt PowerPoint Presentation File Icons
This is a our mission and vision ppt powerpoint presentation file icons. This is a three stage process. The stages in this process are our mission, vision, goal, business, strategy.
Our Mission Slide Marketing Ppt PowerPoint Presentation Icon Example Introduction
This is a our mission slide marketing ppt powerpoint presentation icon example introduction. This is a three stage process. The stages in this process are our mission, vision, goal, business, strategy.

Timeline Diagram For Strategic Planning Powerpoint Slides
This PowerPoint template contains graphics of linear flow timeline diagram. It may be used to display strategic planning for business. Download this PPT slide to demonstrate how you intend to navigate your steps towards the desired corporate goal.

Sales Team Structure Strategy Ppt PowerPoint Presentation Portfolio Maker
This is a sales team structure strategy ppt powerpoint presentation portfolio maker. This is a six stage process. The stages in this process are our goal, arrow, business, planning, management.

Challenges Faced By Our Clients Template 2 Ppt PowerPoint Presentation Icon Example File
This is a challenges faced by our clients template 2 ppt powerpoint presentation icon example file. This is a three stage process. The stages in this process are challenge, goal, business, success, marketing.
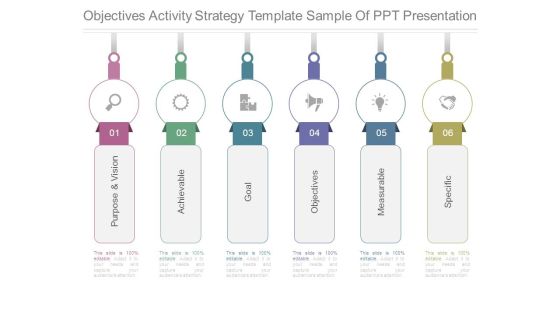
Objectives Activity Strategy Template Sample Of Ppt Presentation
This is a objectives activity strategy template sample of ppt presentation. This is a six stage process. The stages in this process are purpose and vision, achievable, goal, objectives, measurable, specific.

Our Mission Values Ppt PowerPoint Presentation File Gridlines
This is a our mission values ppt powerpoint presentation file gridlines. This is a two stage process. The stages in this process are our mission, vision, goal, marketing, strategy.
Our Mission Values Ppt PowerPoint Presentation Infographic Template Professional
This is a our mission values ppt powerpoint presentation infographic template professional. This is a three stage process. The stages in this process are our mission, vision, mission, goal.

Our Mission Values Ppt PowerPoint Presentation Show Deck
This is a our mission values ppt powerpoint presentation show deck. This is a three stage process. The stages in this process are our mission, vision, goal, marketing, strategy.

Our Mission Value Ppt PowerPoint Presentation Summary Introduction
This is a our mission value ppt powerpoint presentation summary introduction. This is a three stage process. The stages in this process are our mission, vision, goal, marketing, strategy.

Our Mission Ppt PowerPoint Presentation Professional Templates
This is a our mission ppt powerpoint presentation professional templates. This is a three stage process. The stages in this process are our vision, our mission, our goal, business, icons.
Our Vision Template 2 Ppt PowerPoint Presentation Professional Portrait
This is a our vision template 2 ppt powerpoint presentation professional portrait. This is a three stage process. The stages in this process are vision, mission, goal, business, icons.

Our Vision Template 3 Ppt PowerPoint Presentation Styles Diagrams
This is a our vision template 3 ppt powerpoint presentation styles diagrams. This is a three stage process. The stages in this process are vision, mission, goal, business, icons.

4 Phases For Company Cash Flow Statement Interpretation Ppt PowerPoint Presentation Infographics
This is a 4 phases for company cash flow statement interpretation ppt powerpoint presentation infographics. This is a four stage process. The stages in this process are business, goal, target, business, plan.

Social Media Measurement Framework Powerpoint Slides
This is a social media measurement framework powerpoint slides. This is a six stage process. The stages in this process are innovation, brand health, customer experience, marketing optimization, business goal, revenue generation.\n\n\n\n\n\n

Corporate Vision Mission And Values Ppt PowerPoint Presentation Examples
This is a corporate vision mission and values ppt powerpoint presentation examples. This is a five stage process. The stages in this process are vision, mission, goal, strategies, values.

Mission Vision Value Ppt PowerPoint Presentation Styles Show
This is a mission vision value ppt powerpoint presentation styles show. This is a three stage process. The stages in this process are our mission, vision, goal, marketing, strategy.
Website Performance Review Ppt PowerPoint Presentation Icon Deck
This is a website performance review ppt powerpoint presentation icon deck. This is a three stage process. The stages in this process are conversion rate, average visit value goal, visits.
Vision Mission And Targets With Icons Ppt PowerPoint Presentation Template
This is a vision mission and targets with icons ppt powerpoint presentation template. This is a four stage process. The stages in this process are vision, mission, goal, strategies.
