Year Over Year Growth

Combo Chart Ppt PowerPoint Presentation Inspiration Images
This is a combo chart ppt powerpoint presentation inspiration images. This is a three stage process. The stages in this process are market size, in years, growth rate, product.

Combo Chart Ppt PowerPoint Presentation Summary Ideas
This is a combo chart ppt powerpoint presentation summary ideas. This is a eight stage process. The stages in this process are market size, growth rate, product, in years.

Combo Chart Ppt PowerPoint Presentation Gallery Diagrams
This is a combo chart ppt powerpoint presentation gallery diagrams. This is a three stage process. The stages in this process are combo chart, market size, product, in years, growth rate.
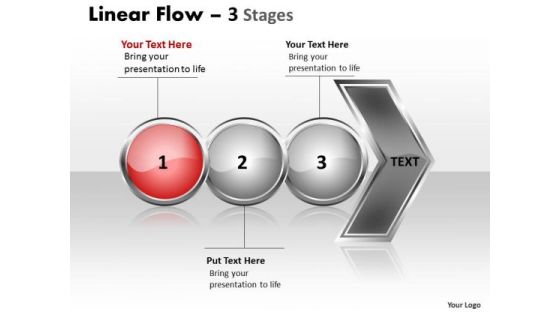
Sales Ppt Background Horizontal Flow Of 3 Stages Operations Management PowerPoint 2 Image
We present our sales PPT Background horizontal flow of 3 stages operations management PowerPoint 2 Image. Use our Spheres PowerPoint Templates because, Use this slide to detail and highlight your thought process, your views and your positive expectations. Use our Symbol PowerPoint Templates because, the plans are in your head, stage by stage, year by year. Use our Business PowerPoint Templates because, Visual appeal is a priority for us. Use our Arrows PowerPoint Templates because, Harness these opportunities, celebrate your performance till date and focus on greater growth and expansion in coming years. Use our Shapes PowerPoint Templates because, Many a core idea has various enveloping layers. Use these PowerPoint slides for presentations relating to Arrow, Background, Business, Chart, Diagram, Financial, Flow, Graphic, Gray, Icon, Illustration, Linear, Management, Orange, Perspective, Process, Reflection, Spheres, Stage, Text. The prominent colors used in the PowerPoint template are Red, Gray, and Black
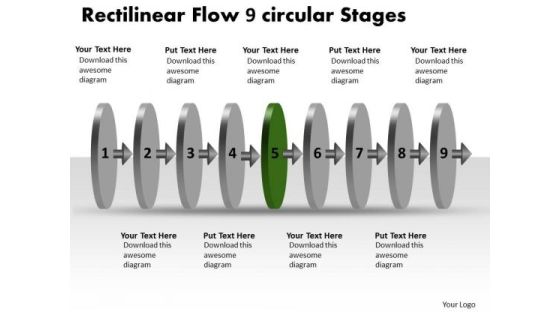
Rectilinear Flow 9 Circular Stages Charts PowerPoint Templates
We present our rectilinear flow 9 circular stages charts PowerPoint templates.Use our Circle Charts PowerPoint Templates because, The plans are in your head, stage by stage, year by year. Use our Arrows PowerPoint Templates because,They are the tools that helped most of us evolve. Use our Design PowerPoint Templates because, This diagram helps you to harness the opportunities, celebrate your performance till date and focus on greater growth and expansion in coming years. Use our Shapes PowerPoint Templates because, this slide can help to bullet point your views. Use our Process and Flows PowerPoint Templates because,Readymade PowerPoint templates can prove best of your knowledge for your slides to show.Use these PowerPoint slides for presentations relating to abstract, arrow, blank, business, chart, circular, circulation, concept, conceptual, design, diagram, executive, flow, icon, idea, illustration, linear, management, model, numbers, organization, procedure, process, progression, resource, sequence, sequential, stages, steps, strategy. The prominent colors used in the PowerPoint template are Blue, Gray, Black
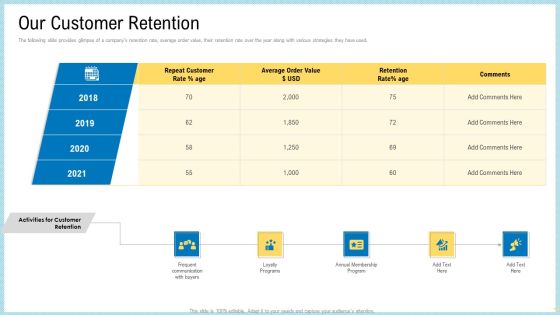
Marketing Technology Stack Our Customer Retention Clipart PDF
The following slide provides glimpse of a companys retention rate, average order value, their retention rate over the year along with various strategies they have used.This is a marketing technology stack our customer retention clipart pdf template with various stages. Focus and dispense information on five stages using this creative set, that comes with editable features. It contains large content boxes to add your information on topics like average order value, frequent communication with buyers, loyalty programs, annual membership program. You can also showcase facts, figures, and other relevant content using this PPT layout. Grab it now.

Investor Pitch Deck To Procure Federal Debt From Banks Our Company Achievements With Details Professional PDF
This slide shows some business achievements over a period such as Market Leadership Award , Increase in Global Sales, Logistics provider of the Year Award etc. This is a investor pitch deck to procure federal debt from banks our company achievements with details professional pdf template with various stages. Focus and dispense information on six stages using this creative set, that comes with editable features. It contains large content boxes to add your information on topics like market share, global sales have increased, market leadership award. You can also showcase facts, figures, and other relevant content using this PPT layout. Grab it now.

Online Streaming Services Corporate History And Achievements Timeline Ppt Icon Visuals PDF
This slide displays over the year milestone record of an OTT platform. It includes major events such as company launch, IPO, workforce increase, subscriber increase, etc. Presenting Online Streaming Services Corporate History And Achievements Timeline Ppt Icon Visuals PDF to dispense important information. This template comprises five stages. It also presents valuable insights into the topics including New Employees, Initial Public Offering, Online Streaming. This is a completely customizable PowerPoint theme that can be put to use immediately. So, download it and address the topic impactfully.

Global Healthcare Device Sale Trends Microsoft PDF
This slide shows international market sale trends that can be used to frame future marketing strategies to boost overall revenue of organization. It include projected sales over next five years, current growth data and top global players etc.Showcasing this set of slides titled Global Healthcare Device Sale Trends Microsoft PDF. The topics addressed in these templates are Market Growth, Incremental Growth, Growth Current. All the content presented in this PPT design is completely editable. Download it and make adjustments in color, background, font etc. as per your unique business setting.

Client Referrals Results Powerpoint Slide Show
This is a client referrals results powerpoint slide show. This is a three stage process. The stages in this process are series, year, success, planning, growth.

Banking Solutions Company Overview Total Deposits Inspiration PDF
The slide highlights the total deposits for financial banking groups over the period of five years. It showcases current accounts, saving accounts, term deposits and overall growth in each. Deliver and pitch your topic in the best possible manner with this Banking Solutions Company Overview Total Deposits Inspiration PDF. Use them to share invaluable insights on Growth, Term Deposits and impress your audience. This template can be altered and modified as per your expectations. So, grab it now.
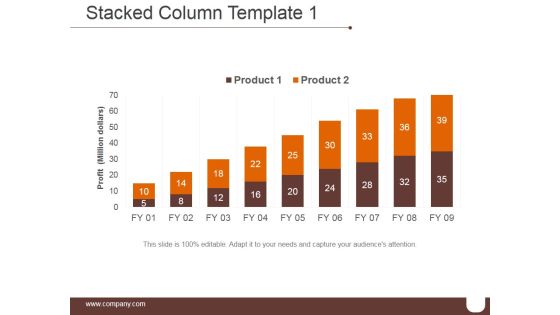
Stacked Column Template 1 Ppt PowerPoint Presentation Ideas
This is a stacked column template 1 ppt powerpoint presentation ideas. This is a nine stage process. The stages in this process are business, growth, success, marketing, year.

Bar Graph Ppt PowerPoint Presentation File Demonstration
This is a bar graph ppt powerpoint presentation file demonstration. This is a four stage process. The stages in this process are graph, year, success, growth, business.

Column Chart Ppt PowerPoint Presentation Infographics Model
This is a column chart ppt powerpoint presentation infographics model. This is a two stage process. The stages in this process are bar graph, growth, product, percentage, year.
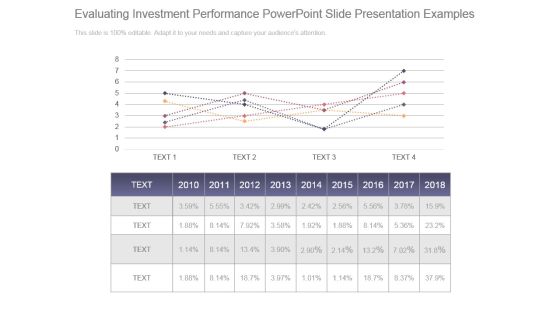
Evaluating Investment Performance Powerpoint Slide Presentation Examples
This is a evaluating investment performance powerpoint slide presentation examples. This is a five stage process. The stages in this process are graph, year, planning, growth, success.

Line Chart Ppt PowerPoint Presentation Pictures Maker
This is a line chart ppt powerpoint presentation pictures maker. This is a two stage process. The stages in this process are financial years, product, growth, success.

Column Chart Ppt PowerPoint Presentation Portfolio Topics
This is a column chart ppt powerpoint presentation portfolio topics. This is a two stage process. The stages in this process are expenditure, years, product, growth, success.

Demand Statistics Ppt PowerPoint Presentation Portfolio Guide
This is a demand statistics ppt powerpoint presentation portfolio guide. This is a four stage process. The stages in this process are demand, graph, growth, success, year.

Marketing Roadmap Planner Ppt Ideas
This is a marketing roadmap planner ppt ideas. This is a eight stage process. The stages in this process are finance, percentage, planning, year, growth.

Column Chart Ppt PowerPoint Presentation Icon Graphics Pictures
This is a column chart ppt powerpoint presentation icon graphics pictures. This is a nine stage process. The stages in this process are product, growth, year, chart, management.

Column Chart Ppt PowerPoint Presentation Show Images
This is a column chart ppt powerpoint presentation show images. This is a two stage process. The stages in this process are product, expenditure, years, bar graph, growth.

Stacked Line Chart Ppt PowerPoint Presentation Styles Graphics
This is a stacked line chart ppt powerpoint presentation styles graphics. This is a two stage process. The stages in this process are product, year, profit, percentage, growth.

Column Chart Ppt PowerPoint Presentation Gallery Show
This is a column chart ppt powerpoint presentation gallery show. This is a two stage process. The stages in this process are column chart, product, year, expenditure, growth.

Financial Performance Logistic Company Investor Fund Raising Pitch Deck Designs PDF
Mentioned slide provides information about digital freight networking company financial performance. It includes business revenue on yearly basis and year to year growth. This modern and well-arranged Financial Performance Logistic Company Investor Fund Raising Pitch Deck Designs PDF provides lots of creative possibilities. It is very simple to customize and edit with the Powerpoint Software. Just drag and drop your pictures into the shapes. All facets of this template can be edited with Powerpoint, no extra software is necessary. Add your own material, put your images in the places assigned for them, adjust the colors, and then you can show your slides to the world, with an animated slide included.
Line Chart Ppt PowerPoint Presentation Icon Inspiration
This is a line chart ppt powerpoint presentation icon inspiration. This is a two stage process. The stages in this process are product, financial years, sales in percentage.

Area Chart Ppt PowerPoint Presentation Summary Deck
This is a area chart ppt powerpoint presentation summary deck. This is a two stage process. The stages in this process are sales in percentage, financial year.

Column Chart Ppt PowerPoint Presentation Professional Aids
This is a column chart ppt powerpoint presentation professional aids. This is a two stage process. The stages in this process are product, sales in percentage, financial years.

Line Chart Ppt PowerPoint Presentation Pictures Layout
This is a line chart ppt powerpoint presentation pictures layout. This is a two stage process. The stages in this process are product, financial years, sales in percentage.

Column Chart Ppt PowerPoint Presentation Gallery Layout
This is a column chart ppt powerpoint presentation gallery layout. This is a two stage process. The stages in this process are product, sales in percentage, year.
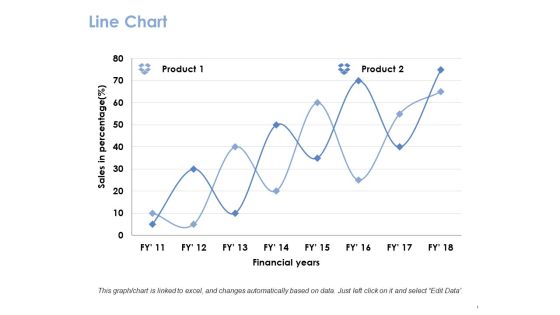
Line Chart Ppt PowerPoint Presentation Gallery Guide
This is a line chart ppt powerpoint presentation gallery guide. This is a two stage process. The stages in this process are product, financial years, sales in percentage.

Area Graph Ppt PowerPoint Presentation Slides Ideas
This is a area graph ppt powerpoint presentation slides ideas. This is a two stage process. The stages in this process are sales in percentage, financial year, product.

Customer Referrals Annual Report Chart Ppt Examples Slides
This is a customer referrals annual report chart ppt examples slides. This is a three stage process. The stages in this process are business, marketing, graph, success, years.

Column Chart Ppt PowerPoint Presentation Infographic Template Inspiration
This is a column chart ppt powerpoint presentation infographic template inspiration. This is a two stage process. The stages in this process are bar, years, business, marketing, success.

Combo Chart Ppt PowerPoint Presentation File Model
This is a combo chart ppt powerpoint presentation file model. This is a eight stage process. The stages in this process are product, year, market size, business, marketing.

Line Chart Ppt PowerPoint Presentation Layouts Templates
This is a line chart ppt powerpoint presentation layouts templates. This is a two stage process. The stages in this process are product, in percentage, in years.

Market Opportunity Analysis Ppt PowerPoint Presentation Templates
This is a market opportunity analysis ppt powerpoint presentation templates. This is a two stage process. The stages in this process are today, business, marketing, year, financial.

Bar Graph Ppt PowerPoint Presentation Design Ideas
This is a bar graph ppt powerpoint presentation design ideas. This is a four stage process. The stages in this process are business, management, marketing, finance, year.
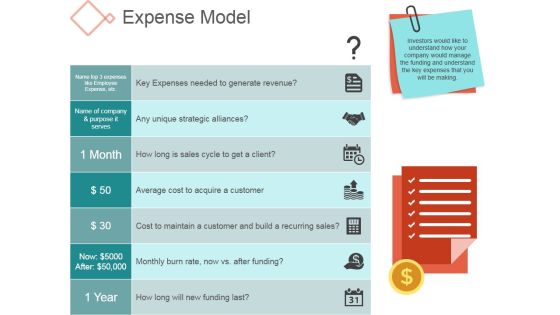
Expense Model Template 1 Ppt PowerPoint Presentation Rules
This is a expense model template 1 ppt powerpoint presentation rules. This is a seven stage process. The stages in this process are month, year, icons, strategy.

Column Chart Ppt PowerPoint Presentation Model Visuals
This is a column chart ppt powerpoint presentation model visuals. This is a two stage process. The stages in this process are product, year, graph, business, finance.

Column Chart Ppt PowerPoint Presentation Model Graphics Example
This is a column chart ppt powerpoint presentation model graphics example. This is a two stage process. The stages in this process are expenditure in, product, years.

Area Chart Ppt PowerPoint Presentation Styles Brochure
This is a area chart ppt powerpoint presentation styles brochure. This is a two stage process. The stages in this process are product, financial years, in percentage.

Line Chart Ppt PowerPoint Presentation Gallery Example Introduction
This is a line chart ppt powerpoint presentation portfolio shapes. This is a two stage process. The stages in this process are product, financial years, line chart.

Column Chart Ppt PowerPoint Presentation Ideas Clipart
This is a column chart ppt powerpoint presentation ideas clipart. This is a two stage process. The stages in this process are product, expenditure in, years.

Column Chart Ppt PowerPoint Presentation Show Slideshow
This is a column chart ppt powerpoint presentation show slideshow. This is a two stage process. The stages in this process are product, expenditure, years.
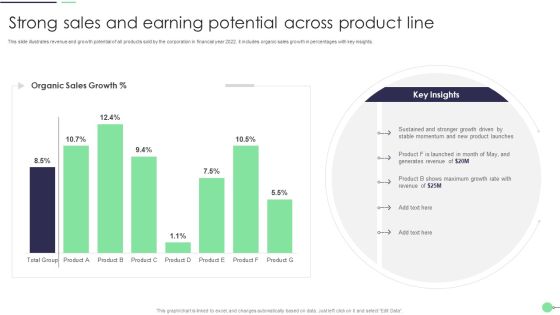
Strong Sales And Earning Potential Across Product Line Professional PDF
This slide illustrates revenue and growth potential of all products sold by the corporation in financial year 2022. it includes organic sales growth in percentages with key insights. Showcasing this set of slides titled Strong Sales And Earning Potential Across Product Line Professional PDF. The topics addressed in these templates are Product Launches, Generates Revenue, Growth Rate. All the content presented in this PPT design is completely editable. Download it and make adjustments in color, background, font etc. as per your unique business setting.

Company Department Cultural Dashboard Pictures PDF
The purpose of this slide is to provide a graph showing the production and sales over the last 4 years in the organization, also defining the rationale behind the decrease in production and sales within the company.Deliver an awe inspiring pitch with this creative company department cultural dashboard pictures pdf bundle. Topics like company culture, average per department, growth and development can be discussed with this completely editable template. It is available for immediate download depending on the needs and requirements of the user.

Banking Solutions Company Overview Net Profit And Margin Topics PDF
The slide highlights the net profit of and margin of financial banking group. It showcases profitability of the firm from its banking activities and its growth over five years time period. Deliver and pitch your topic in the best possible manner with this Banking Solutions Company Overview Net Profit And Margin Topics PDF. Use them to share invaluable insights on Overall Net Profit, Net Profit Margin and impress your audience. This template can be altered and modified as per your expectations. So, grab it now.

Civil Contractors Construction Company Milestones Ppt Pictures Slide Download PDF
This slide provides the construction companys milestone showing organization growth over the years so far. This is a civil contractors construction company milestones ppt pictures slide download pdf template with various stages. Focus and dispense information on eigth stages using this creative set, that comes with editable features. It contains large content boxes to add your information on topics like strive business expansion, delivering exceptional customer service, 1985 to 2020, establishes charitable foundation, employee stock ownership plan. You can also showcase facts, figures, and other relevant content using this PPT layout. Grab it now.

Cloud Based Marketing Company Milestones Ppt PowerPoint Presentation Ideas Sample PDF
This slide provides the companys milestone showing organization growth over the years so far. This is a cloud based marketing company milestones ppt powerpoint presentation ideas sample pdf template with various stages. Focus and dispense information on six stages using this creative set, that comes with editable features. It contains large content boxes to add your information on topics like founded, first data center opened, awarded gold medal certification, announced city z overseas headquarters, 2010 to 2020. You can also showcase facts, figures, and other relevant content using this PPT layout. Grab it now.

Bar Chart Ppt PowerPoint Presentation Icon Information
This is a bar chart ppt powerpoint presentation icon information. This is a one stage process. The stages in this process are product, sales in percentage, financial years, bar graph, growth.

Clustered Column Line Ppt PowerPoint Presentation Show Influencers
This is a clustered column line ppt powerpoint presentation show influencers. This is a four stage process. The stages in this process are financial year, sales in percentage, product, growth, success.

Line Chart Ppt PowerPoint Presentation Layouts Example
This is a line chart ppt powerpoint presentation layouts example. This is a two stage process. The stages in this process are sales in percentage, product, financial years, growth, success.

Bar Diagram Ppt PowerPoint Presentation Gallery Structure
This is a bar diagram ppt powerpoint presentation gallery structure. This is a three stage process. The stages in this process are financial in years, sales in percentage, bar graph, growth, success.

Column Chart Ppt PowerPoint Presentation Layouts Tips
This is a column chart ppt powerpoint presentation layouts tips. This is a six stage process. The stages in this process are sales in percentage, financial year, bar graph, growth, success.

Bar Diagram Ppt PowerPoint Presentation Pictures Background Image
This is a bar diagram ppt powerpoint presentation pictures background image. This is a three stage process. The stages in this process are financial in years, sales in percentage, bar graph, growth, success.

Bar Graph Ppt PowerPoint Presentation Ideas Graphic Tips
This is a bar graph ppt powerpoint presentation ideas graphic tips. This is a three stage process. The stages in this process are financial year, sales in percentage, product, bar graph, growth.

Clustered Column Line Ppt PowerPoint Presentation Portfolio Outline
This is a clustered column line ppt powerpoint presentation portfolio outline. This is a four stage process. The stages in this process are sales in percentage, financial year, product, graph, growth.

Column Chart Ppt PowerPoint Presentation Gallery Slide Portrait
This is a column chart ppt powerpoint presentation gallery slide portrait. This is a two stage process. The stages in this process are sales in percentage, financial year, product, bar graph, growth.

Column Chart Ppt PowerPoint Presentation Ideas Vector
This is a column chart ppt powerpoint presentation ideas vector. This is a two stage process. The stages in this process are column chart, product, financial years, sales in percentage, growth.

Column Chart Ppt PowerPoint Presentation Slides Show
This is a column chart ppt powerpoint presentation slides show. This is a two stage process. The stages in this process are column chart, product, sales in percentage, financial year, growth.

 Home
Home