X-Y

X Y Graph For Opportunity Score Presentation Images
This is a x y graph for opportunity score presentation images. This is a one stage process. The stages in this process are engagement, quality sales development, pass to sales, nurture marketing, scrap, targeted.

Business Bar Graph And X Y Chart PowerPoint Templates Ppt Backgrounds For Slides 0613
Give them a dose of your ability. It will go down well with our Business Bar Graph And X Y Chart PowerPoint Templates PPT Backgrounds For Slides. Connect the dots with our Marketing PowerPoint Templates. Watch the whole picture clearly emerge. Dot your thoughts with our Success PowerPoint Templates. Give your demeanour that Propah look.

Bar Graph X Y Chart Shows Growth PowerPoint Templates Ppt Backgrounds For Slides 0413
We present our Bar Graph X Y Chart Shows Growth PowerPoint Templates PPT Backgrounds For Slides 0413.Download and present our Arrows PowerPoint Templates because It will Raise the bar of your Thoughts. They are programmed to take you to the next level. Present our Business PowerPoint Templates because Our PowerPoint Templates and Slides will provide weight to your words. They will bring out the depth of your thought process. Present our Success PowerPoint Templates because Our PowerPoint Templates and Slides are innately eco-friendly. Their high recall value negate the need for paper handouts. Use our Shapes PowerPoint Templates because Our PowerPoint Templates and Slides will effectively help you save your valuable time. They are readymade to fit into any presentation structure. Present our Signs PowerPoint Templates because you can Break through with our PowerPoint Templates and Slides. Bring down the mental barriers of your audience.Use these PowerPoint slides for presentations relating to Bar graph X Y chart shows growth, arrows, success, business, shapes, signs. The prominent colors used in the PowerPoint template are Red, Gray, Green.

Bar Graph And X Y Chart Business Theme PowerPoint Templates Ppt Backgrounds For Slides 0413
We present our Bar Graph And X Y Chart Business Theme PowerPoint Templates PPT Backgrounds For Slides 0413.Present our Marketing PowerPoint Templates because Our PowerPoint Templates and Slides are like the strings of a tennis racquet. Well strung to help you serve aces. Download and present our Finance PowerPoint Templates because You can Connect the dots. Fan expectations as the whole picture emerges. Download and present our Business PowerPoint Templates because You can Hit a home run with our PowerPoint Templates and Slides. See your ideas sail into the minds of your audience. Download our Success PowerPoint Templates because You will get more than you ever bargained for. Download and present our Leadership PowerPoint Templates because our PowerPoint Templates and Slides will give your ideas the shape.Use these PowerPoint slides for presentations relating to Business graph ghowing growth, marketing, finance, business, success, leadership. The prominent colors used in the PowerPoint template are Blue, White, Gray.

Monthly Progress Report On X Y Chart PowerPoint Templates Ppt Backgrounds For Slides 0313
We present our Monthly Progress Report On X Y Chart PowerPoint Templates PPT Backgrounds For Slides 0313.Download and present our Marketing PowerPoint Templates because you should once Tap the ingenuity of our PowerPoint Templates and Slides. They are programmed to succeed. Use our Success PowerPoint Templates because Our PowerPoint Templates and Slides are innately eco-friendly. Their high recall value negate the need for paper handouts. Use our Finance PowerPoint Templates because Our PowerPoint Templates and Slides will bullet point your ideas. See them fall into place one by one. Download our Business PowerPoint Templates because You canTake a leap off the starting blocks with our PowerPoint Templates and Slides. They will put you ahead of the competition in quick time. Use our Arrows PowerPoint Templates because Our PowerPoint Templates and Slides have the Brilliant backdrops. Guaranteed to illuminate the minds of your audience.Use these PowerPoint slides for presentations relating to Business graph, arrows, business, marketing, success, finance. The prominent colors used in the PowerPoint template are Green, Blue, Red.

Bar And X Y Chart For Financial Growth PowerPoint Templates Ppt Backgrounds For Slides 0413
We present our Bar And X Y Chart For Financial Growth PowerPoint Templates PPT Backgrounds For Slides 0413.Download and present our Business PowerPoint Templates because You are working at that stage with an air of royalty. Let our PowerPoint Templates and Slides be the jewels in your crown. Download our Pie charts PowerPoint Templates because Our PowerPoint Templates and Slides are effectively colour coded to prioritise your plans They automatically highlight the sequence of events you desire. Use our Shapes PowerPoint Templates because It will Strengthen your hand with your thoughts. They have all the aces you need to win the day. Use our Signs PowerPoint Templates because You are working at that stage with an air of royalty. Let our PowerPoint Templates and Slides be the jewels in your crown. Present our Process and Flows PowerPoint Templates because Our PowerPoint Templates and Slides are innately eco-friendly. Their high recall value negate the need for paper handouts.Use these PowerPoint slides for presentations relating to Bar graph and pie chart, pie charts, shapes, signs, business, process and flows. The prominent colors used in the PowerPoint template are Blue, Red, Green.
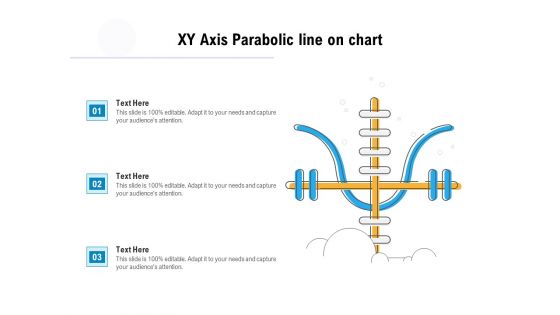
XY Axis Parabolic Line On Chart Ppt PowerPoint Presentation Model Background Image PDF
Pitch your topic with ease and precision using this xy axis parabolic line on chart ppt powerpoint presentation model background image pdf. This layout presents information on xy axis parabolic line on chart. It is also available for immediate download and adjustment. So, changes can be made in the color, design, graphics or any other component to create a unique layout.

Bar Graph With Pie And Xy Chart For Business PowerPoint Templates Ppt Backgrounds For Slides 0413
We present our Bar Graph With Pie And XY Chart For Business PowerPoint Templates PPT Backgrounds For Slides 0413.Use our Pie Charts PowerPoint Templates because Our PowerPoint Templates and Slides are created with admirable insight. Use them and give your group a sense of your logical mind. Present our Business PowerPoint Templates because You can Zap them with our PowerPoint Templates and Slides. See them reel under the impact. Download our Marketing PowerPoint Templates because These PowerPoint Templates and Slides will give the updraft to your ideas. See them soar to great heights with ease. Download and present our Success PowerPoint Templates because Watching this your Audience will Grab their eyeballs, they wont even blink. Use our Arrows PowerPoint Templates because You can Inspire your team with our PowerPoint Templates and Slides. Let the force of your ideas flow into their minds.Use these PowerPoint slides for presentations relating to Pie and progress bars chart, pie charts, business, marketing, success, arrows. The prominent colors used in the PowerPoint template are Red, Gray, Blue.
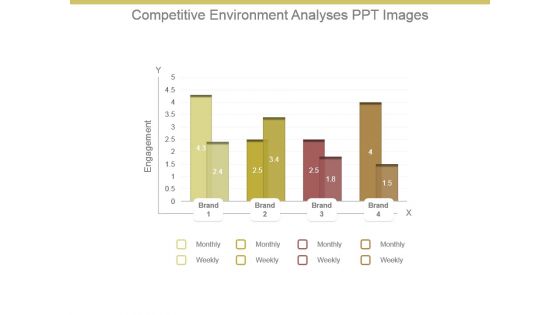
Competitive Environment Analysis Ppt Images
This is a competitive environment analysis ppt images. This is a four stage process. The stages in this process are engagement, brand, monthly, weekly, x, y.
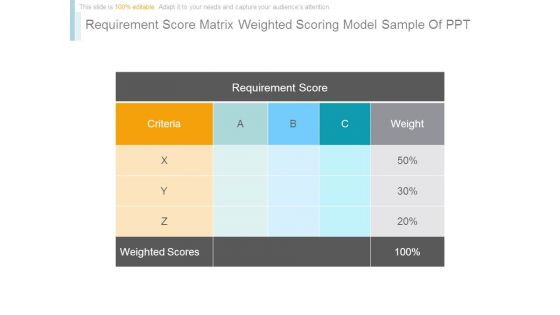
Requirement Score Matrix Weighted Scoring Model Sample Of Ppt
This is a requirement score matrix weighted scoring model sample of ppt. This is a five stage process. The stages in this process are requirement score, criteria, a, b, c, weight, x, y, z, weighted scores.

Business Framework Kano Model PowerPoint Presentation
This business diagram displays framework for Kano model. This slide contains x y graph. The X-axis represents customer satisfaction. The y-axis represents presence of characteristics. It also contains three arrows in center of graph representing delighters, satisfier and dissatisfier. Use this business diagram to earn good remarks from the target audience.
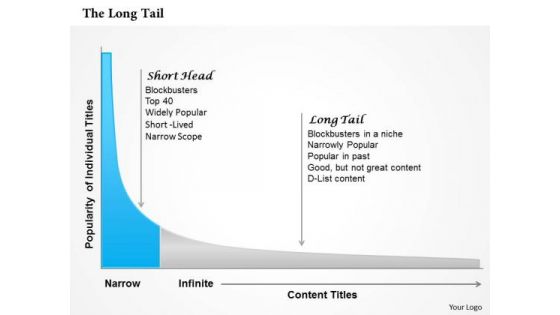
Business Framework The Long Tail PowerPoint Presentation
Our above diagram illustrates framework for long trail. It contains x-y graph of individual titles and content titles. Download this long tail diagram for business and marketing presentations.

Business Diagram Business Finance Study PowerPoint Ppt Presentation
Our above slide displays business finance study diagram. It contains x-y graph of finance efficiency further divided into four sections. This diagram reflects finance efficiency depends on storekeepers, disciplined operators, constrained advisors and value integrators.

Business Framework Variance Analysis PowerPoint Presentation 1
This slide displays business framework of varinace analysis. It conatins x-y graph of price and quantity. Arrow on this graph depicts price volume variance and volume variance. Download this diagram as a tool for business presentations.

Business Diagram Growth Chart Graph Presentation Template
This business diagram has been designed x-y graph of competitive advantage and degree of intelligence. This diagram depicts the business growth chart. Give professional appearance to your presentations using this business slide.
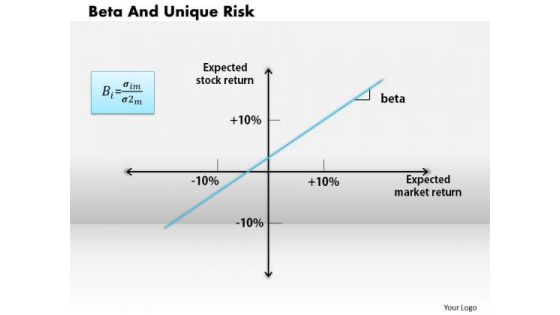
Business Framework Beta And Unique Risk PowerPoint Presentation
Explain the concept of calculating systematic risk of market with this unique power point diagram slide. This lide contains the graphic of X-Y chart with four different sections. Get the sense of price and finance risk with beta factor, define this factor in your financial presentation and display the clear picture of risk.

Business Framework Beta And Unique Risk PowerPoint Presentation 2
Define the concept of calculating risk of market with this power point diagram slide. This slide contains the graphic of X-Y chart with four different sections. Define the price and finance risk with beta factor, define this factor in your financial presentation and display the clear picture of risk.
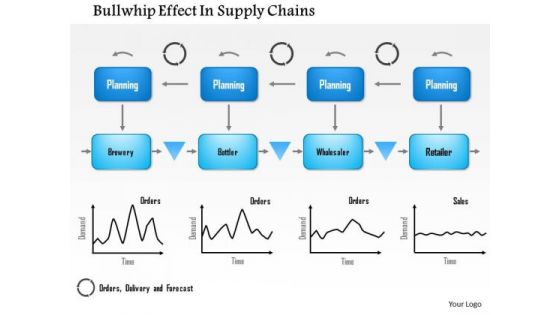
Business Framework Bullwhip Effect In Supply Chains PowerPoint Presentation
Explain the effect of bullwhip condition on larger inventories with this innovative power point diagram slide. This slide contains the graphic of this bullwhip effect with x-y chart for total effect on SCM. This effect is based on customer demand which creates larger swings on inventories. Use this diagram for SCM related presentations.
Online Shopping Business Study Of Insurance Company Ppt PowerPoint Presentation Icon Files PDF
This slide provide case study of insurance company that made progress by switching to XY cloud platform. It further includes context background of the case, challenges faced by the firm, solution for those challenges and result or outcome after adopting the cloud platform. Persuade your audience using this Online Shopping Business Study Of Insurance Company Ppt PowerPoint Presentation Icon Files PDF. This PPT design covers four stages, thus making it a great tool to use. It also caters to a variety of topics including Context, Challenge, Solution, Result. Download this PPT design now to present a convincing pitch that not only emphasizes the topic but also showcases your presentation skills.

 Home
Home