Working Capital Ratios

Profitability Ratios Template 5 Ppt PowerPoint Presentation Model Clipart Images
This is a profitability ratios template 5 ppt powerpoint presentation model clipart images. This is a two stage process. The stages in this process are net operating profit, employed capital, net income, total assets.
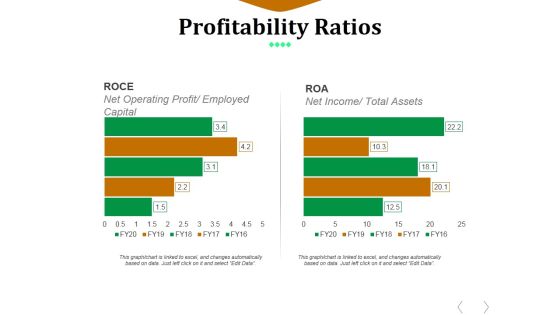
Profitability Ratios Template 6 Ppt PowerPoint Presentation File Infographic Template
This is a profitability ratios template 6 ppt powerpoint presentation file infographic template. This is a two stage process. The stages in this process are net operating profit, employed capital, net income, total assets.
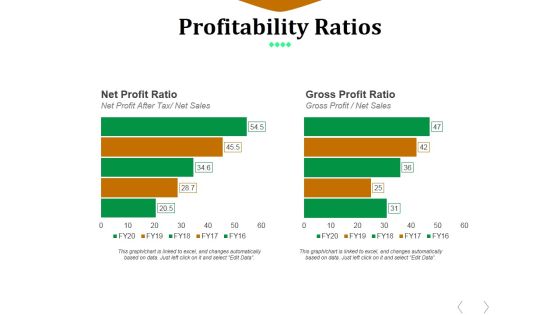
Profitability Ratios Template 2 Ppt PowerPoint Presentation Diagram Ppt
This is a profitability ratios template 2 ppt powerpoint presentation diagram ppt. This is a two stage process. The stages in this process are net profit ratio, gross profit ratio, net profit after tax, net sales.

Activity Ratios Template 1 Ppt PowerPoint Presentation Pictures Grid
This is a activity ratios template 1 ppt powerpoint presentation pictures grid. This is a two stage process. The stages in this process are inventory turnover, receivable turnover.

Activity Ratios Template 3 Ppt PowerPoint Presentation Icon Demonstration
This is a activity ratios template 3 ppt powerpoint presentation icon demonstration. This is a two stage process. The stages in this process are total asset turnover, fixed assets turnover, net sales, fixed assets.

Activity Ratios Template 1 Ppt PowerPoint Presentation Pictures Graphics Example
This is a activity ratios template 1 ppt powerpoint presentation pictures graphics example. This is a two stage process. The stages in this process are inventory turnover, receivables turnover, avg inventory, net credit sales, average accounts receivable.

Activity Ratios Template 3 Ppt PowerPoint Presentation Inspiration Example File
This is a activity ratios template 3 ppt powerpoint presentation inspiration example file. This is a two stage process. The stages in this process are total asset turnover, net sales, average total assets, fixed assets turnover, fixed assets.
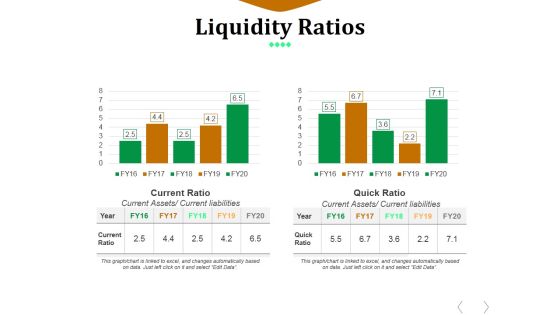
Liquidity Ratios Template 1 Ppt PowerPoint Presentation Styles Inspiration
This is a liquidity ratios template 1 ppt powerpoint presentation styles inspiration. This is a two stage process. The stages in this process are business, finance, management, current ratio, quick ratio.

Commercial Banking Template Collection Liquidity Analysis And Key Ratios Ppt Show Gridlines PDF
The slide comprises liquidity analysis of the company along with details such as networking capital, current ratio, quick ratio, current assets, current liabilities etc. It also covered the liquidity ratios current ratio, quick ratio, cash ratio, operating cash flow ratio for five years 2016 to 2020. Deliver an awe-inspiring pitch with this creative commercial banking template collection liquidity analysis and key ratios ppt show gridlines pdf bundle. Topics like inventory, operating cash flow ratio, net working capital can be discussed with this completely editable template. It is available for immediate download depending on the needs and requirements of the user.

Affle India Ltd Business Profile Key Financial Ratios Introduction PDF
This slide covers the key financial ratios for 2022 which includes return on net worth, return on capital employed, total debt, days sales outstanding, interest coverage ratio, current ratio, etc. This is a Affle India Ltd Business Profile Key Financial Ratios Introduction PDF template with various stages. Focus and dispense information on one stages using this creative set, that comes with editable features. It contains large content boxes to add your information on topics like Capital Employed, Net Worth, Interest Coverage Ratio. You can also showcase facts, figures, and other relevant content using this PPT layout. Grab it now.

Organizational Advisory Solutions Business Profile Key Financial Ratios Themes PDF
This slide shows the key financial ratios of our consulting company which includes current ratio, quick ratio, inventory turnover ratio, return on assets, interest coverage ratio for last four years. Formulating a presentation can take up a lot of effort and time, so the content and message should always be the primary focus. The visuals of the PowerPoint can enhance the presenters message, so our Organizational Advisory Solutions Business Profile Key Financial Ratios Themes PDF was created to help save time. Instead of worrying about the design, the presenter can concentrate on the message while our designers work on creating the ideal templates for whatever situation is needed. Slidegeeks has experts for everything from amazing designs to valuable content, we have put everything into Organizational Advisory Solutions Business Profile Key Financial Ratios Themes PDF.
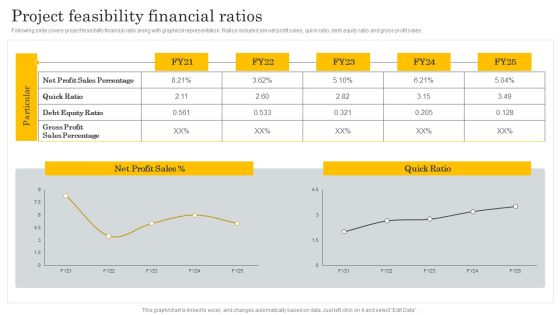
Financial Evaluation Report Project Feasibility Financial Ratios Mockup PDF
Following slide covers project feasibility financial ratio along with graphical representation. Ratios included are net profit sales, quick ratio, debt equity ratio and gross profit sales. Formulating a presentation can take up a lot of effort and time, so the content and message should always be the primary focus. The visuals of the PowerPoint can enhance the presenters message, so our Financial Evaluation Report Project Feasibility Financial Ratios Mockup PDF was created to help save time. Instead of worrying about the design, the presenter can concentrate on the message while our designers work on creating the ideal templates for whatever situation is needed. Slidegeeks has experts for everything from amazing designs to valuable content, we have put everything into Financial Evaluation Report Project Feasibility Financial Ratios Mockup PDF.

Profitability Ratios Template 5 Ppt PowerPoint Presentation File Elements
This is a profitability ratios template 5 ppt powerpoint presentation file elements. This is a two stage process. The stages in this process are roce, net operating profit, employed capital, net income, total assets.
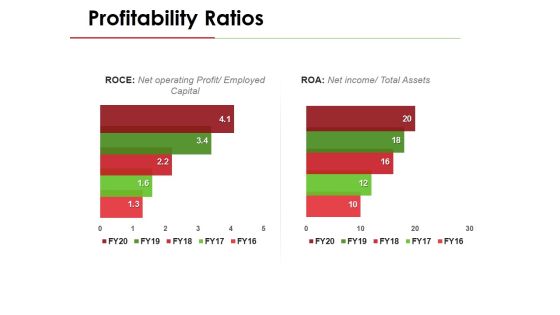
Profitability Ratios Template 6 Ppt PowerPoint Presentation Pictures Structure
This is a profitability ratios template 6 ppt powerpoint presentation pictures structure. This is a two stage process. The stages in this process are roce, net operating profit, employed capital, net income, total assets.

Profitability Ratios Template 3 Ppt PowerPoint Presentation Show Graphics Download
This is a profitability ratios template 3 ppt powerpoint presentation show graphics download. This is a two stage process. The stages in this process are roce, net operating profit, employed capital, roa, net income, total assets.

Strategic Management Consultancy Business Profile Key Financial Ratios Introduction PDF
This slide shows the key financial ratios of our consulting company which includes current ratio, quick ratio, inventory turnover ratio, return on assets, interest coverage ratio for last four years. Deliver an awe inspiring pitch with this creative Strategic Management Consultancy Business Profile Key Financial Ratios Introduction PDF bundle. Topics like Quick Ratio, Gross Margin Ratio, Interest Coverage Ratio can be discussed with this completely editable template. It is available for immediate download depending on the needs and requirements of the user.
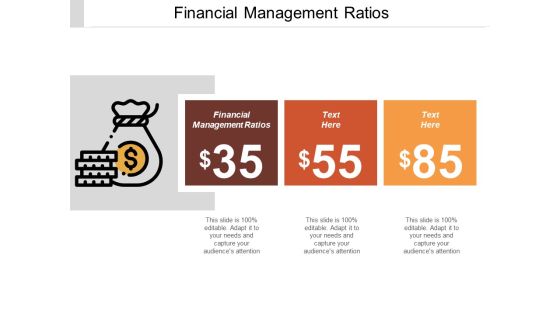
Financial Management Ratios Ppt PowerPoint Presentation Pictures Mockup Cpb
This is a financial management ratios ppt powerpoint presentation pictures mockup cpb. This is a three stage process. The stages in this process are financial management ratios.
Financial Ratios Solutions Ppt PowerPoint Presentation Infographics Example Introduction Cpb
This is a financial ratios solutions ppt powerpoint presentation infographics example introduction cpb. This is a four stage process. The stages in this process are financial ratios solutions.

Liquidity Ratios Template 1 Ppt PowerPoint Presentation Outline Themes
This is a liquidity ratios template 1 ppt powerpoint presentation outline themes. This is a two stage process. The stages in this process are current ratio, quick ratio.

Inventory Ratios Template 1 Ppt PowerPoint Presentation Gallery Master Slide
This is a inventory ratios template 1 ppt powerpoint presentation gallery master slide. This is a two stage process. The stages in this process are finance, marketing, analysis, business, investment, inventory ratios.
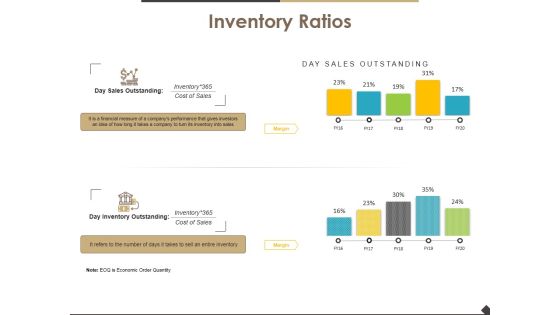
Inventory Ratios Template 2 Ppt PowerPoint Presentation Slide
This is a inventory ratios template 2 ppt powerpoint presentation slide. This is a two stage process. The stages in this process are finance, marketing, analysis, business, investment, inventory ratios.

Operating Efficiency Ratios Template 1 Ppt PowerPoint Presentation Layouts Introduction
This is a operating efficiency ratios template 1 ppt powerpoint presentation layouts introduction. This is a two stage process. The stages in this process are operating efficiency ratios, finance, marketing, strategy, business.

Key Financial Ratios Template 2 Ppt PowerPoint Presentation Professional Template
This is a key financial ratios template 2 ppt powerpoint presentation professional template. This is a four stage process. The stages in this process are liquidity ratio, profitability ratio, activity ratio, solvency ratio.
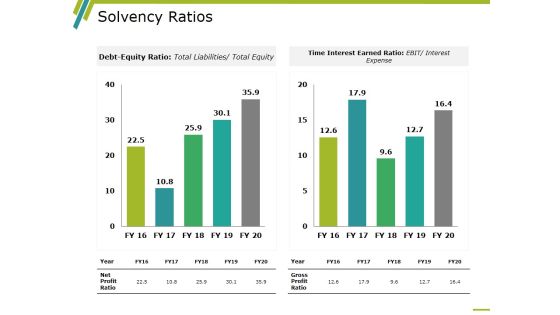
Solvency Ratios Template 1 Ppt PowerPoint Presentation Layouts Graphics Design
This is a solvency ratios template 1 ppt powerpoint presentation layouts graphics design. This is a two stage process. The stages in this process are time interest earned ratio, debt equity ratio, gross profit ratio, net profit ratio, year.

Solvency Ratios Template 2 Ppt PowerPoint Presentation Layouts Layouts
This is a solvency ratios template 2 ppt powerpoint presentation layouts layouts. This is a two stage process. The stages in this process are time interest earned ratio, debt equity ratio, gross profit ratio, net profit ratio, year.

Inventory Turnover Financial Ratios Chart Conversion Portrait PDF
This slide illustrates graph for inventory turnover ratio that can help company to analyze efficiency of inventory management. It showcases ratio graph comparison of 4 companies for a period of last 6 years Pitch your topic with ease and precision using this inventory turnover financial ratios chart conversion portrait pdf. This layout presents information on inventory turnover financial ratios chart conversion. It is also available for immediate download and adjustment. So, changes can be made in the color, design, graphics or any other component to create a unique layout.
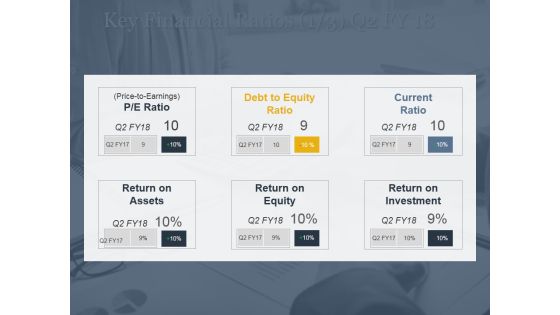
Key Financial Ratios Ppt PowerPoint Presentation Model Objects
This is a key financial ratios ppt powerpoint presentation model objects. This is a three stage process. The stages in this process are p e ratio, price to earnings, debt, equity ratio, current, ratio.

Key Financial Ratios Ppt PowerPoint Presentation Portfolio Background Image
This is a key financial ratios ppt powerpoint presentation portfolio background image. This is a four stage process. The stages in this process are debt to equity ratio, current ratio, return on assets, ratio, return.
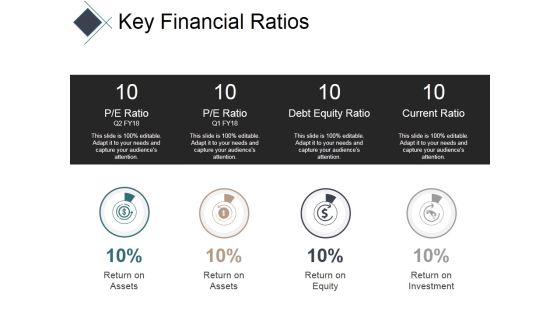
Key Financial Ratios Ppt PowerPoint Presentation Summary Inspiration
This is a key financial ratios ppt powerpoint presentation summary inspiration. This is a four stage process. The stages in this process are pe ratio, debt equity ratio, current ratio.
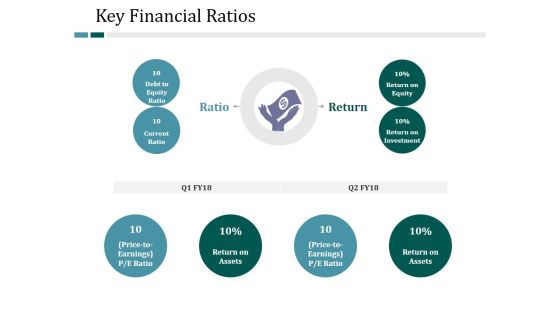
Key Financial Ratios Ppt PowerPoint Presentation File Introduction
This is a key financial ratios ppt powerpoint presentation file introduction. This is a four stage process. The stages in this process are ratio, return, return on equity, return on investment, return on assets, current ratio, debt to equity ratio.

Profitability Ratios Template 2 Ppt PowerPoint Presentation Show Example Introduction
This is a profitability ratios template 2 ppt powerpoint presentation show example introduction. This is a four stage process. The stages in this process are eps ratio, p e ratio, category, price to earning ratio, earning per share.
Selling Home Property Financial Ratios Analysis Ppt Icon Infographics PDF
Deliver an awe inspiring pitch with this creative selling home property financial ratios analysis ppt icon infographics pdf bundle. Topics like effective gross, capitalization, expense, financial can be discussed with this completely editable template. It is available for immediate download depending on the needs and requirements of the user.

Profitability Ratios Template Ppt PowerPoint Presentation Styles Slide
This is a profitability ratios template ppt powerpoint presentation styles slide. This is a two stage process. The stages in this process are net profit ratio, net profit after tax net sales, gross profit ratio, gross profit net sales.
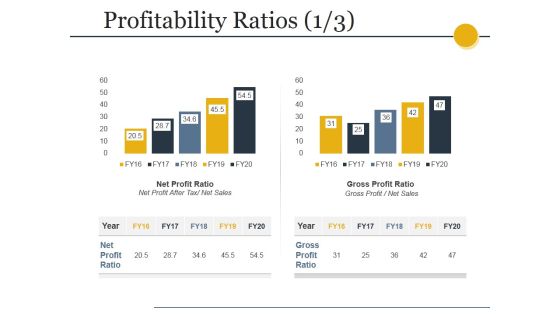
Profitability Ratios Template 1 Ppt PowerPoint Presentation Slides Inspiration
This is a profitability ratios template 1 ppt powerpoint presentation slides inspiration. This is a two stage process. The stages in this process are net profit ratio, net profit after tax net sales, gross profit ratio, gross profit net sales.

Profitability Ratios Template 1 Ppt PowerPoint Presentation Outline Information
This is a profitability ratios template 1 ppt powerpoint presentation outline information. This is a two stage process. The stages in this process are net profit ratio, gross profit ratio, net profit after tax, net sales.

Key Financial Ratios Ppt PowerPoint Presentation Outline Ideas
This is a key financial ratios ppt powerpoint presentation outline ideas. This is a eight stage process. The stages in this process are return on assets, return on equity, return on investment, current ratio, debt to equity ratio.

Liquidity Ratios Template 2 Ppt PowerPoint Presentation File Topics
This is a liquidity ratios template 2 ppt powerpoint presentation file topics. This is a two stage process. The stages in this process are current ratio, quick ratio, current assets current liabilities, current assets current liabilities.
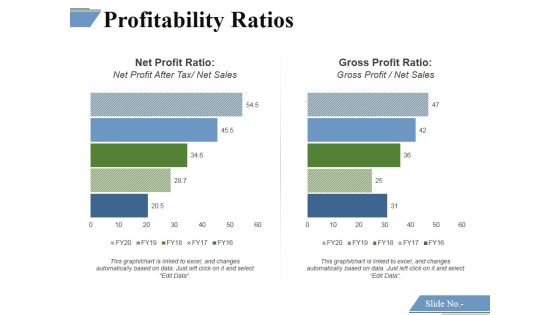
Profitability Ratios Template 1 Ppt PowerPoint Presentation Outline Deck
This is a profitability ratios template 1 ppt powerpoint presentation outline deck. This is a two stage process. The stages in this process are net profit ratio, gross profit ratio.
Profitability Ratios Template 2 Ppt PowerPoint Presentation Icon Diagrams
This is a profitability ratios template 2 ppt powerpoint presentation icon diagrams. This is a two stage process. The stages in this process are net profit ratio, gross profit ratio.

Profitability Ratios Template 1 Ppt PowerPoint Presentation Inspiration Graphics Pictures
This is a profitability ratios template 1 ppt powerpoint presentation inspiration graphics pictures. This is a two stage process. The stages in this process are net profit ratio, net profit after tax, net sales, gross profit ratio.

Profitability Ratios Template 2 Ppt PowerPoint Presentation Professional Slide
This is a profitability ratios template 2 ppt powerpoint presentation professional slide. This is a two stage process. The stages in this process are net profit ratio, net profit after tax, net sales, gross profit ratio.
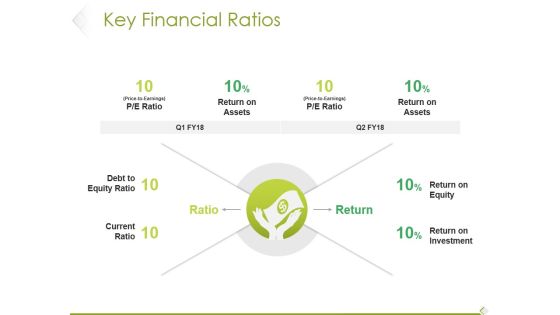
Key Financial Ratios Ppt PowerPoint Presentation Summary Graphics Pictures
This is a key financial ratios ppt powerpoint presentation summary graphics pictures. This is a one stage process. The stages in this process are current ratio, ratio, return, return on equity, return on investment.

Key Financial Ratios Template 1 Ppt PowerPoint Presentation Gallery Ideas
This is a key financial ratios template 1 ppt powerpoint presentation gallery ideas. This is a eight stage process. The stages in this process are return on assets, return on equity, return on investment, debt to equity ratio, current ratio.
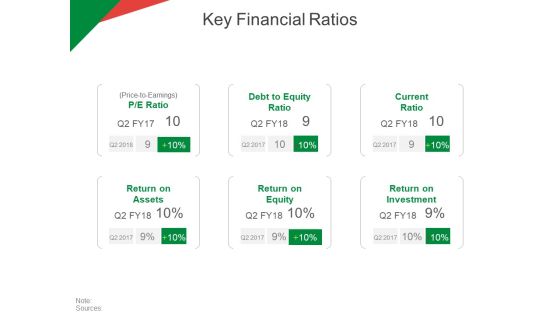
Key Financial Ratios Ppt PowerPoint Presentation File Graphics Tutorials
This is a key financial ratios ppt powerpoint presentation file graphics tutorials. This is a six stage process. The stages in this process are return on assets, return on equity return on investment, current ratio, debt to equity ratio.

Key Financial Ratios Template 1 Ppt PowerPoint Presentation Professional Samples
This is a key financial ratios template 1 ppt powerpoint presentation professional samples. This is a four stage process. The stages in this process are debt to equity ratio, current ratio, return on assets, business, marketing, finance.
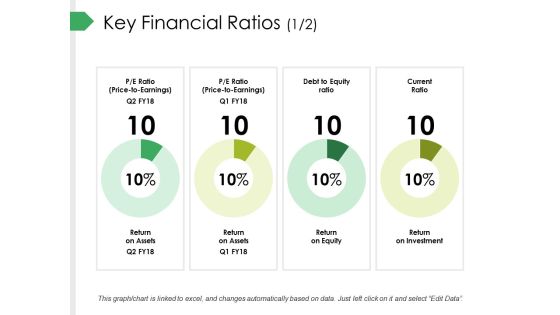
Key Financial Ratios Template 1 Ppt PowerPoint Presentation Summary Maker
This is a key financial ratios template 1 ppt powerpoint presentation summary maker. This is a four stage process. The stages in this process are return on assets, return on equity, return on investment, current ratio, debt to equity ratio.
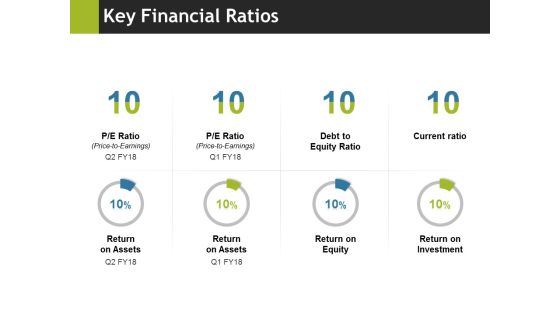
Key Financial Ratios Ppt PowerPoint Presentation Infographics Files
This is a key financial ratios ppt powerpoint presentation infographics files. This is a four stage process. The stages in this process are return on assets, return on equity, return on investment, current ratio, debt to equity ratio.
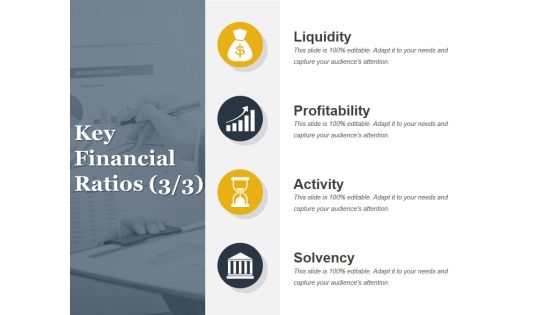
Key Financial Ratios Template 1 Ppt PowerPoint Presentation Slides Styles
This is a key financial ratios template 1 ppt powerpoint presentation slides styles. This is a six stage process. The stages in this process are debt to equity ratio, current ratio, assets, return on, equity, return on, investment.

Key Financial Ratios Ppt PowerPoint Presentation Infographic Template Master Slide
This is a key financial ratios ppt powerpoint presentation infographic template master slide. This is a eight stage process. The stages in this process are debt to equity ratio, current ratio, return on equity, return on investment.
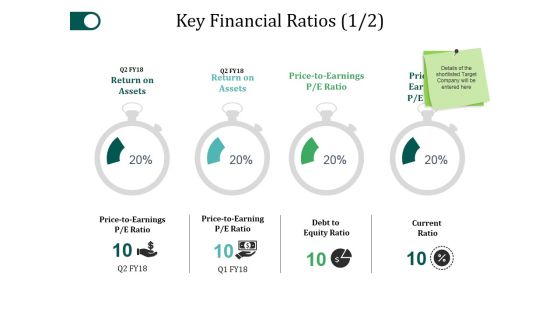
Key Financial Ratios Template 1 Ppt PowerPoint Presentation Layouts Pictures
This is a key financial ratios template 1 ppt powerpoint presentation layouts pictures. This is a four stage process. The stages in this process are return on assets, debt to equity ratio, current ratio, price to earnings.
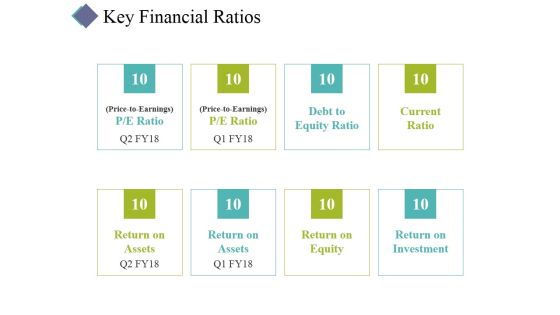
Key Financial Ratios Ppt PowerPoint Presentation Styles Portfolio
This is a key financial ratios ppt powerpoint presentation styles portfolio. This is a eight stage process. The stages in this process are return on assets, return on equity, return on investment, current ratio, debt to equity ratio.

Key Financial Ratios Ppt PowerPoint Presentation Styles Summary
This is a key financial ratios ppt powerpoint presentation styles summary. This is a eight stage process. The stages in this process are debt to equity ratio, current ratio, return on assets, return on equity, return on investment.
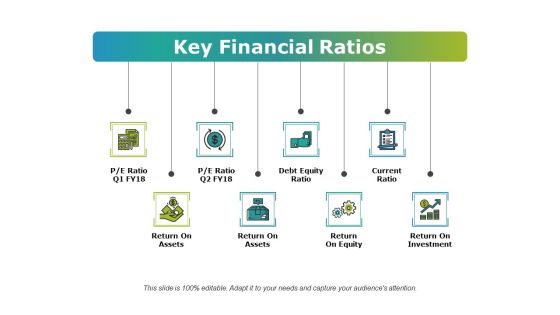
Key Financial Ratios Ppt PowerPoint Presentation Gallery Example
This is a key financial ratios ppt powerpoint presentation gallery example. This is a eight stage process. The stages in this process are return on assets, return on equity, return on investment, current ratio, debt equity ratio.

Key Financial Ratios Ppt PowerPoint Presentation Portfolio Summary
This is a key financial ratios ppt powerpoint presentation portfolio summary. This is a eight stage process. The stages in this process are return on assets, return on equity, return on investment, debt equity ratio, current ratio.

Key Financial Ratios Ppt PowerPoint Presentation Outline Slide
This is a key financial ratios ppt powerpoint presentation outline slide. This is a eight stage process. The stages in this process are return on assets, return on equity, return on investment, current ratio, debt equity ratio.
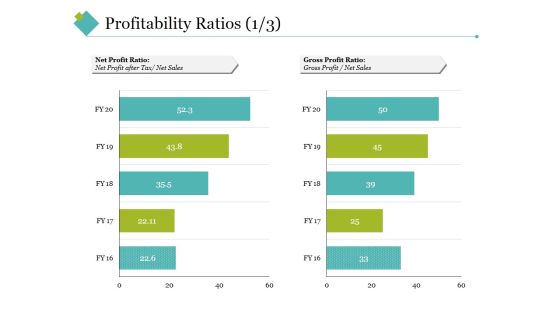
Profitability Ratios Template 1 Ppt PowerPoint Presentation Infographic Template Clipart
This is a profitability ratios template 1 ppt powerpoint presentation infographic template clipart. This is a five stage process. The stages in this process are net profit ratio, gross profit ratio, net sales, net profit after tax, net sales.
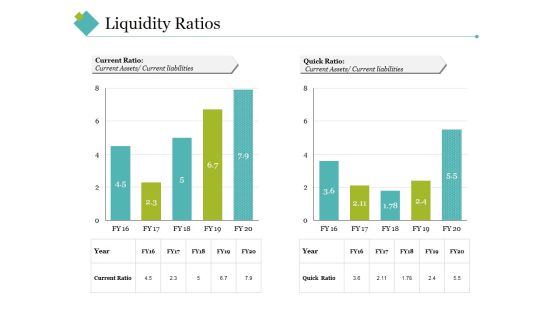
Liquidity Ratios Template 2 Ppt PowerPoint Presentation Gallery Vector
This is a liquidity ratios template 2 ppt powerpoint presentation gallery vector. This is a two stage process. The stages in this process are quick ratio, current ratio, current liabilities, current assets.
Liquidity Ratios Ppt PowerPoint Presentation Icon Graphic Images
This is a liquidity ratios ppt powerpoint presentation icon graphic images. This is a two stage process. The stages in this process are current ratio, quick ratio, current liabilities, current assetsc.
Solvency Ratios Template Ppt PowerPoint Presentation Inspiration Icons
This is a solvency ratios template ppt powerpoint presentation inspiration icons. This is a two stage process. The stages in this process are debt equity ratio, total liabilities total equity, time interest earned ratio, ebit interest expense.

Activity Ratios Template 1 Ppt PowerPoint Presentation Show Graphics
This is a activity ratios template 1 ppt powerpoint presentation show graphics. This is a two stage process. The stages in this process are inventory turnover, receivables turnover, inventory ratio, receivable ratio.

 Home
Home