AI PPT Maker
Templates
PPT Bundles
Design Services
Business PPTs
Business Plan
Management
Strategy
Introduction PPT
Roadmap
Self Introduction
Timelines
Process
Marketing
Agenda
Technology
Medical
Startup Business Plan
Cyber Security
Dashboards
SWOT
Proposals
Education
Pitch Deck
Digital Marketing
KPIs
Project Management
Product Management
Artificial Intelligence
Target Market
Communication
Supply Chain
Google Slides
Research Services
 One Pagers
All Categories
-
Home
- Customer Favorites
- Wheel Diagram
Wheel Diagram
Implementing Change Management Strategy To Transform Business Processes Technology Transformation Roadmap Icons PDF
This slide covers the roadmap for successful implementation of technology transformation which includes assessing and solutioning, change execution and go-live and normalization. Retrieve professionally designed Implementing Change Management Strategy To Transform Business Processes Technology Transformation Roadmap Icons PDF to effectively convey your message and captivate your listeners. Save time by selecting pre made slideshows that are appropriate for various topics, from business to educational purposes. These themes come in many different styles, from creative to corporate, and all of them are easily adjustable and can be edited quickly. Access them as PowerPoint templates or as Google Slides themes. You do not have to go on a hunt for the perfect presentation because Slidegeeks got you covered from everywhere.

3d Arrows Depicting 8 Concepts Ppt Technical Flow Chart PowerPoint Templates
We present our 3d arrows depicting 8 concepts ppt technical flow chart PowerPoint templates. Use our Marketing PowerPoint Templates because, You have some exciting plans to spread goodwill among the underprivileged, Expound on your ideas and show to your colleagues how they can help others and in the process increase your Brand value. Use our Business PowerPoint Templates because, Business ethics is an essential element in your growth. Use our Shapes PowerPoint Templates because, anticipate the doubts and questions in the minds of your colleagues and enlighten them with your inspired strategy to garner desired success. Use our Process and Flows PowerPoint Templates because, are the symbols of human growth. Use our Arrows PowerPoint Templates because, one pushes the other till it all comes back full circle. Use these PowerPoint slides for presentations relating to Advertising, arrow, background, banner, bookmark, choice, concept, creative, design, direction, flow, illustration, instruction, label, layout, manual, marketing, modern, next, offer, options, order, pointer, process, product, promotion, sequence, simple, special, symbol, template, tutorial, two, vector, version, website. The prominent colors used in the PowerPoint template are Gray, White, and Green

Steps For The Process In A Linear Flow 3 Stages Samples Of Business Plans PowerPoint Slides
We present our steps for the process in a linear flow 3 stages samples of business plans PowerPoint Slides.Download our Business PowerPoint Templates because you can Lead your flock steadily to greater heights. Look around at the vast potential of achievement around you. Download our Arrows PowerPoint Templates because they will Amplify your thoughts via our appropriate templates. Use our Shapes PowerPoint Templates because you have the basic goal in mind. Present our Process and Flows PowerPoint Templates because this template helps you to illustrate your method, piece by piece, and interlock the whole process in the minds of your audience. Download our Flow charts PowerPoint Templates because our PowerPoint templates give this step by step process to acheive the aim.Use these PowerPoint slides for presentations relating to Budget, business charts, character, chart, drawing on, finance, financial, flow, graph, growth, hand, isolated, horizontal, leadership, marker, pen, power, professional, progress, reducing, showing one, the concept, the employee, the line manager, success, space, upward leader. The prominent colors used in the PowerPoint template are Blue, Black, White. The feedback we get is that our steps for the process in a linear flow 3 stages samples of business plans PowerPoint Slides provide great value for your money. Be assured of finding the best projection to highlight your words. The feedback we get is that our financial PowerPoint templates and PPT Slides are Adorable. People tell us our steps for the process in a linear flow 3 stages samples of business plans PowerPoint Slides are Spectacular. We assure you our charts PowerPoint templates and PPT Slides are Striking. We assure you our steps for the process in a linear flow 3 stages samples of business plans PowerPoint Slides are Enchanting. The feedback we get is that our charts PowerPoint templates and PPT Slides are Luxuriant.

Business Process Analysis Process Marketing Ppt PowerPoint Presentation Complete Deck
This business process analysis process marketing ppt powerpoint presentation complete deck acts as backup support for your ideas, vision, thoughts, etc. Use it to present a thorough understanding of the topic. This PPT slideshow can be utilized for both in-house and outside presentations depending upon your needs and business demands. Entailing twelve slides with a consistent design and theme, this template will make a solid use case. As it is intuitively designed, it suits every business vertical and industry. All you have to do is make a few tweaks in the content or any other component to design unique presentations. The biggest advantage of this complete deck is that it can be personalized multiple times once downloaded. The color, design, shapes, and other elements are free to modify to add personal touches. You can also insert your logo design in this PPT layout. Therefore a well-thought and crafted presentation can be delivered with ease and precision by downloading this business process analysis process marketing ppt powerpoint presentation complete deck PPT slideshow.
Process Shift Process Optimize Ppt PowerPoint Presentation Complete Deck
This process shift process optimize ppt powerpoint presentation complete deck acts as backup support for your ideas, vision, thoughts, etc. Use it to present a thorough understanding of the topic. This PPT slideshow can be utilized for both in-house and outside presentations depending upon your needs and business demands. Entailing twelve slides with a consistent design and theme, this template will make a solid use case. As it is intuitively designed, it suits every business vertical and industry. All you have to do is make a few tweaks in the content or any other component to design unique presentations. The biggest advantage of this complete deck is that it can be personalized multiple times once downloaded. The color, design, shapes, and other elements are free to modify to add personal touches. You can also insert your logo design in this PPT layout. Therefore a well-thought and crafted presentation can be delivered with ease and precision by downloading this process shift process optimize ppt powerpoint presentation complete deck PPT slideshow.

Five Cyclic Process Business Process Ppt PowerPoint Presentation Complete Deck
This five cyclic process business process ppt powerpoint presentation complete deck acts as backup support for your ideas, vision, thoughts, etc. Use it to present a thorough understanding of the topic. This PPT slideshow can be utilized for both in-house and outside presentations depending upon your needs and business demands. Entailing twelve slides with a consistent design and theme, this template will make a solid use case. As it is intuitively designed, it suits every business vertical and industry. All you have to do is make a few tweaks in the content or any other component to design unique presentations. The biggest advantage of this complete deck is that it can be personalized multiple times once downloaded. The color, design, shapes, and other elements are free to modify to add personal touches. You can also insert your logo design in this PPT layout. Therefore a well-thought and crafted presentation can be delivered with ease and precision by downloading this five cyclic process business process ppt powerpoint presentation complete deck PPT slideshow.
Employing Candidate Using Internal And External Mediums Of Recruitment Slide2 Icons PDF Portrait PDF
This slide showcases timeline that can help organization to plan the activities for conducting recruitment process. Its key milestones are plan recruitment, develop recruiting materials, candidate sourcing, applicant screening, interview candidates and extend final offer. If you are looking for a format to display your unique thoughts, then the professionally designed Employing Candidate Using Internal And External Mediums Of Recruitment Slide2 Icons PDF Portrait PDF is the one for you. You can use it as a Google Slides template or a PowerPoint template. Incorporate impressive visuals, symbols, images, and other charts. Modify or reorganize the text boxes as you desire. Experiment with shade schemes and font pairings. Alter, share or cooperate with other people on your work. DownloadEmploying Candidate Using Internal And External Mediums Of Recruitment Slide2 Icons PDF Portrait PDF and find out how to give a successful presentation. Present a perfect display to your team and make your presentation unforgettable.

Business Core Processes CRM Requirements Ideas PDF
This slide provides information regarding the key business requirements that are associated for core business processes that are for effective customer relationship management. Retrieve professionally designed Business Core Processes CRM Requirements Ideas PDF to effectively convey your message and captivate your listeners. Save time by selecting pre-made slideshows that are appropriate for various topics, from business to educational purposes. These themes come in many different styles, from creative to corporate, and all of them are easily adjustable and can be edited quickly. Access them as PowerPoint templates or as Google Slides themes. You do not have to go on a hunt for the perfect presentation because Slidegeeks got you covered from everywhere.
Four Stages Of Assets Lifecycle With Icons Ppt PowerPoint Presentation Icon Background Designs PDF
Presenting this set of slides with name four stages of assets lifecycle with icons ppt powerpoint presentation icon background designs pdf. This is a four stage process. The stages in this process are acquisition, development, operation, identification of asse, determining investment, obtaining authorization, executing project essentials, identify potential customers, make asset ready for selling. This is a completely editable PowerPoint presentation and is available for immediate download. Download now and impress your audience.
six hexagons with icons to define strategies and tactics ppt powerpoint presentation icon template pdf
Presenting this set of slides with name six hexagons with icons to define strategies and tactics ppt powerpoint presentation icon template pdf. This is a six stage process. The stages in this process are market research, competitive analysis, identify target audienc, set goals and objectives, define specific, strategies and tactics, determine evaluation methods. This is a completely editable PowerPoint presentation and is available for immediate download. Download now and impress your audience.
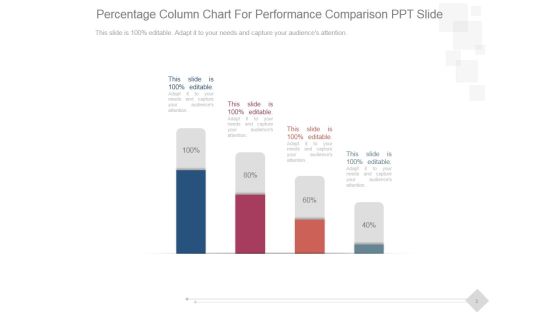
Percentage Column Chart For Performance Comparison Ppt PowerPoint Presentation Good
This is a percentage column chart for performance comparison ppt powerpoint presentation good. This is a four stage process. The stages in this process are business, marketing, technology, presentation, management.

data collection and analysis control chart ppt powerpoint presentation styles
This is a data collection and analysis control chart ppt powerpoint presentation styles. This is a one stage process. The stages in this process are upper limit, centerline, plotted points, lower limit, point labels.
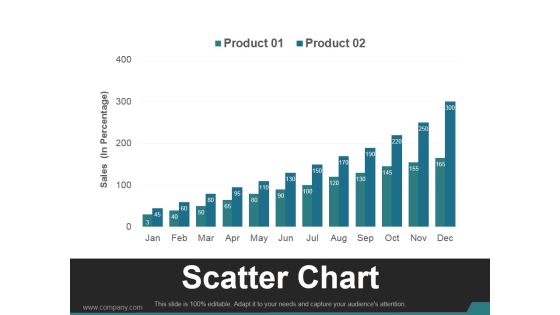
Scatter Chart Template 1 Ppt PowerPoint Presentation Visual Aids
This is a scatter chart template 1 ppt powerpoint presentation visual aids. This is a twelve stage process. The stages in this process are business, marketing, growth, finance, management.
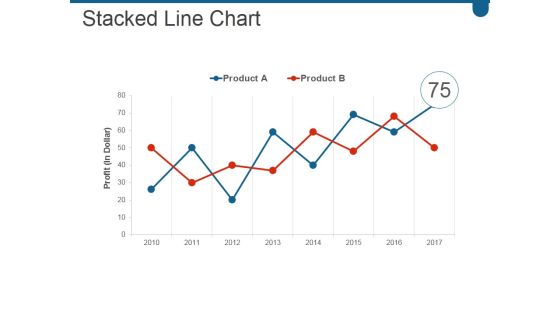
Stacked Line Chart Ppt PowerPoint Presentation Infographic Template Show
This is a stacked line chart ppt powerpoint presentation infographic template show. This is a two stage process. The stages in this process are business, marketing, growth, success, line.

Column Chart Ppt PowerPoint Presentation Show Background Images
This is a column chart ppt powerpoint presentation show background images. This is a nine stage process. The stages in this process are business, strategy, marketing, analysis, growth strategy.

Combo Chart Ppt PowerPoint Presentation Summary Graphics Tutorials
This is a combo chart ppt powerpoint presentation summary graphics tutorials. This is a eight stage process. The stages in this process are product, growth rate, market size, business.

High Low Close Chart Ppt Powerpoint Presentation Gallery Slides
This is a high low close chart ppt powerpoint presentation gallery slides. This is a five stage process. The stages in this process are close, volume, high, low, graph.

Combo Chart Ppt PowerPoint Presentation Infographic Template Deck
This is a combo chart ppt powerpoint presentation infographic template deck. This is a eight stage process. The stages in this process are business, strategy, marketing, analysis, growth strategy, market size.

Our Charts And Graphs Ppt PowerPoint Presentation File Visuals
This is a our charts and graphs ppt powerpoint presentation file visuals. This is a one stage process. The stages in this process are business, strategy, marketing, analysis, finance.

Combo Chart Ppt PowerPoint Presentation Infographic Template Influencers
This is a combo chart ppt powerpoint presentation infographic template influencers. This is a three stage process. The stages in this process are market size rmb million, growth rate.

Scatter Bubble Chart Ppt PowerPoint Presentation Pictures Show
This is a scatter bubble chart ppt powerpoint presentation pictures show. This is a eight stage process. The stages in this process are business, strategy, analysis, pretention, highest sale.

Clustered Column Line Chart Ppt PowerPoint Presentation Professional Slides
This is a clustered column line chart ppt powerpoint presentation professional slides. This is a four stage process. The stages in this process are bar, finance, business, marketing, growth.

High Low Close Chart Ppt PowerPoint Presentation Layouts Guide
This is a high low close chart ppt powerpoint presentation layouts guide. This is a ten stage process. The stages in this process are high, volume, low, business, marketing, finance.

Area Chart Ppt PowerPoint Presentation Inspiration Slide Download
This is a area chart ppt powerpoint presentation inspiration slide download. This is a two stage process. The stages in this process are product, in percentage, business, growth, strategy, finance.

High Low Close Chart Ppt PowerPoint Presentation Ideas Brochure
This is a high low close chart ppt powerpoint presentation ideas brochure. This is a three stage process. The stages in this process are in percentage, product, business, marketing, finance.

Scatter Bubble Chart Ppt PowerPoint Presentation Infographic Template Examples
This is a scatter bubble chart ppt powerpoint presentation infographic template examples. This is a two stage process. The stages in this process are highest sale, product, in price, finance, business.
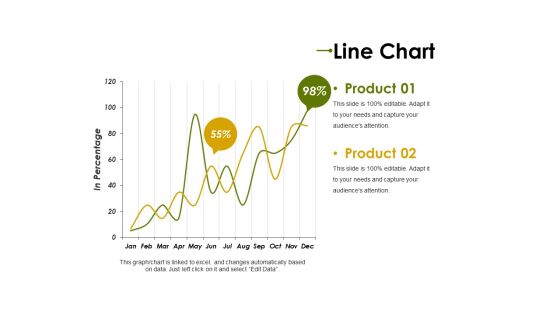
Line Chart Ppt PowerPoint Presentation Professional Clipart Images
This is a line chart ppt powerpoint presentation professional clipart images. This is a two stage process. The stages in this process are product, in percentage, graph, percentage, finance, business.

Line Chart Ppt PowerPoint Presentation Show Background Designs
This is a line chart ppt powerpoint presentation show background designs. This is a two stage process. The stages in this process are product, in months, in percentage, business.
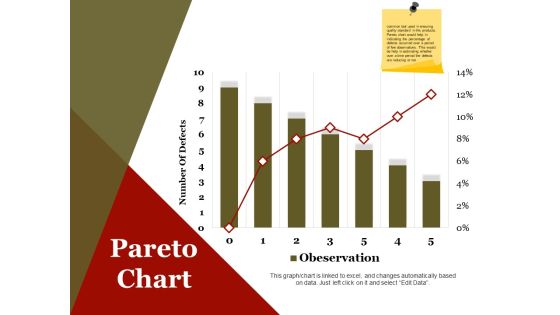
Pareto Chart Ppt PowerPoint Presentation Infographics Design Inspiration
This is a pareto chart ppt powerpoint presentation infographics design inspiration. This is a seven stage process. The stages in this process are number of defects, business, marketing, finance.

Combo Chart Ppt PowerPoint Presentation Professional Slide Download
This is a combo chart ppt powerpoint presentation professional slide download. This is a three stage process. The stages in this process are market size, growth rate, product, graph, growth.
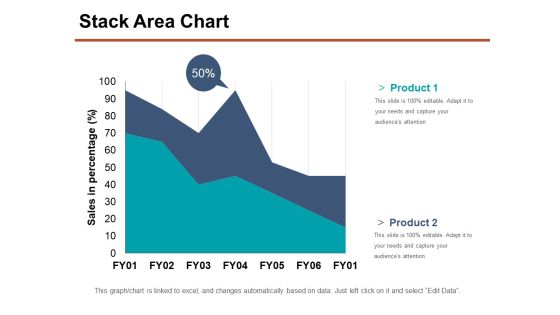
Stack Area Chart Ppt PowerPoint Presentation Show Samples
This is a stack area chart ppt powerpoint presentation show samples. This is a two stage process. The stages in this process are product, sales in percentage, business, marketing, percentage.

High Low Close Chart Ppt PowerPoint Presentation Layouts Objects
This is a high low close chart ppt powerpoint presentation layouts objects. This is a five stage process. The stages in this process are high, volume, low, business, marketing.
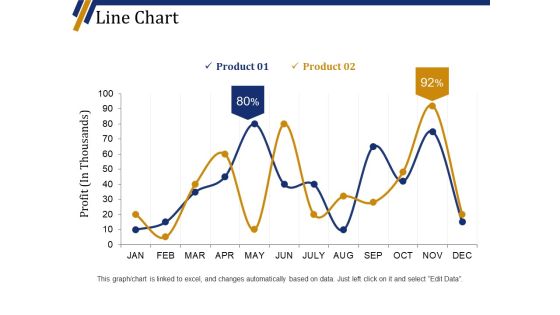
Line Chart Ppt PowerPoint Presentation Portfolio Background Designs
This is a line chart ppt powerpoint presentation portfolio background designs. This is a two stage process. The stages in this process are product, business, finance, marketing, profit in thousands.

Pareto Chart Ppt PowerPoint Presentation File Infographic Template
This is a pareto chart ppt powerpoint presentation file infographic template. This is a six stage process. The stages in this process are number of defects, business, marketing, graph.
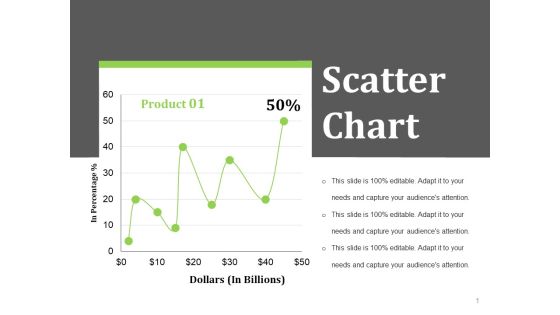
Scatter Chart Ppt PowerPoint Presentation Styles Layout Ideas
This is a scatter chart ppt powerpoint presentation styles layout ideas. This is a one stage process. The stages in this process are dollars in billions, in percentage, business, finance.
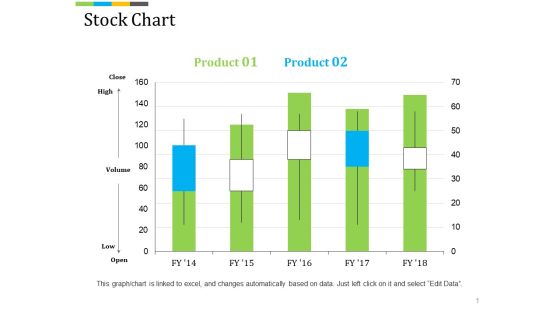
Stock Chart Ppt PowerPoint Presentation Professional Background Image
This is a stock chart ppt powerpoint presentation professional background image. This is a five stage process. The stages in this process are high, volume, low, finance, business, marketing.

Combo Chart Ppt PowerPoint Presentation Infographics Example Introduction
This is a combo chart ppt powerpoint presentation infographics example introduction. This is a four stage process. The stages in this process are units sold, business, marketing, graph, growth.
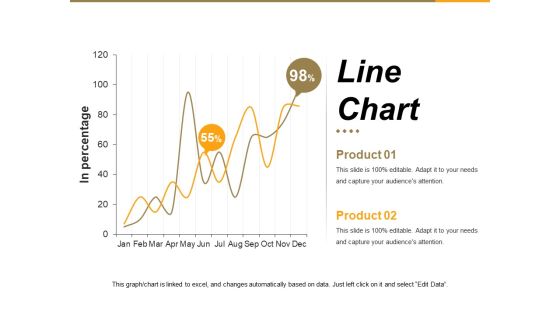
Line Chart Ppt PowerPoint Presentation Summary File Formats
This is a line chart ppt powerpoint presentation summary file formats. This is a two stage process. The stages in this process are in percentage, graph, business, marketing, growth.

Stock Chart Ppt PowerPoint Presentation Summary File Formats
This is a stock chart ppt powerpoint presentation summary file formats. This is a five stage process. The stages in this process are high, volume, low, business, graph, finance.

Column Chart Ppt PowerPoint Presentation Show Master Slide
This is a column chart ppt powerpoint presentation show master slide. This is a six stage process. The stages in this process are financial, years, business, marketing, finance, graph.
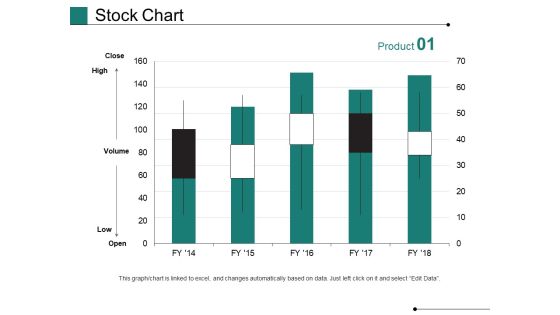
Stock Chart Ppt PowerPoint Presentation Pictures Graphics Design
This is a stock chart ppt powerpoint presentation pictures graphics design. This is a five stage process. The stages in this process are high, volume, low, business, marketing, graph.

Scatter Bubble Chart Ppt PowerPoint Presentation Gallery Example Introduction
This is a scatter bubble chart ppt powerpoint presentation gallery example introduction. This is a eight stage process. The stages in this process are business, marketing, finance, bubble, scatter.
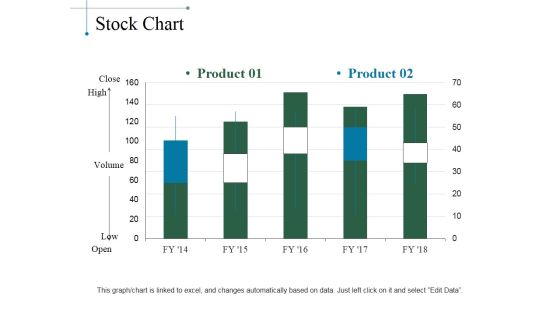
Stock Chart Ppt PowerPoint Presentation Layouts Designs Download
This is a stock chart ppt powerpoint presentation layouts designs download. This is a five stage process. The stages in this process are product, close, high, volume, low, open.

Combo Chart Ppt PowerPoint Presentation Outline Graphics Tutorials
This is a combo chart ppt powerpoint presentation outline graphics tutorials. This is a three stage process. The stages in this process are units sold, years, business, marketing, graph.

Line Chart Ppt PowerPoint Presentation Infographics Graphic Images
This is a line chart ppt powerpoint presentation infographics graphic images. This is a two stage process. The stages in this process are sales in percentage, financial years, growth, business, marketing.

Line Chart Ppt PowerPoint Presentation Professional Graphics Design
This is a line chart ppt powerpoint presentation professional graphics design. This is a two stage process. The stages in this process are financial years, sales in percentage, product, growth, success.
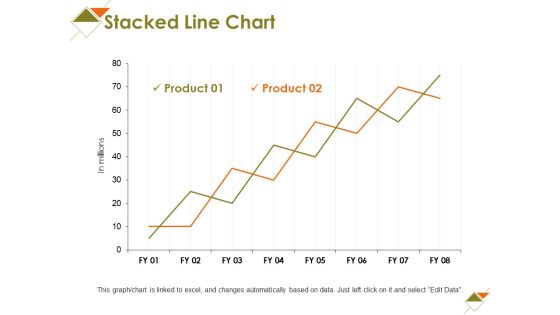
Stacked Line Chart Ppt PowerPoint Presentation File Display
This is a stacked line chart ppt powerpoint presentation file display. This is a two stage process. The stages in this process are business, marketing, graph, strategy, in millions.

Volume High Low Close Chart Ppt PowerPoint Presentation Slides Styles
This is a volume high low close chart ppt powerpoint presentation slides styles. This is a two stage process. The stages in this process are high, volume, low, business, marketing.

Scatter Chart Template 1 Ppt PowerPoint Presentation Inspiration Guidelines
This is a scatter chart template 1 ppt powerpoint presentation inspiration guidelines. This is a one stage process. The stages in this process are business, marketing, graph, values, growth.

Column Chart Ppt PowerPoint Presentation Infographics Layout Ideas
This is a column chart ppt powerpoint presentation infographics layout ideas. This is a two stage process. The stages in this process are financial year in, business, marketing, growth, graph.

Combo Chart Ppt PowerPoint Presentation Ideas Infographic Template
This is a combo chart ppt powerpoint presentation ideas infographic template. This is a three stage process. The stages in this process are market size growth rate, graph, business, strategy.
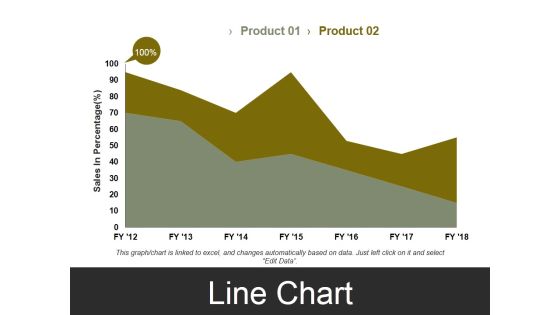
Line Chart Template 3 Ppt PowerPoint Presentation Styles Visual Aids
This is a line chart template 3 ppt powerpoint presentation styles visual aids. This is a two stage process. The stages in this process are sales in percentage, business, marketing, finance, graph.
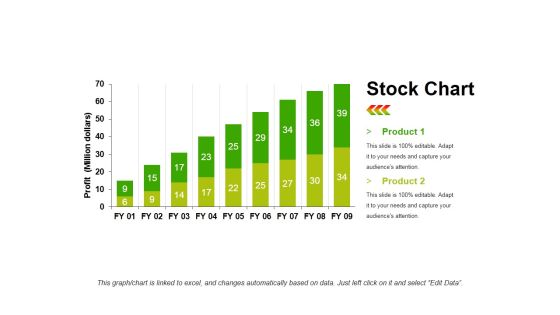
Stock Chart Template 1 Ppt PowerPoint Presentation Infographic Template Objects
This is a stock chart template 1 ppt powerpoint presentation infographic template objects. This is a two stage process. The stages in this process are product, profit, bar graph, growth, success.
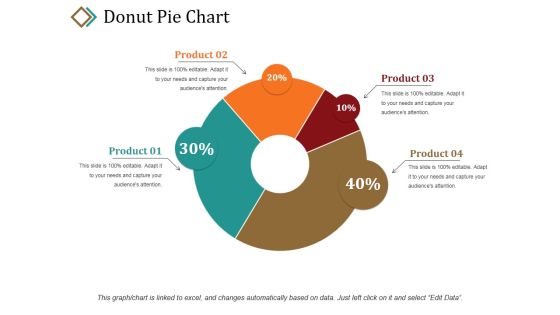
Donut Pie Chart Ppt PowerPoint Presentation Portfolio Graphic Tips
This is a donut pie chart ppt powerpoint presentation portfolio graphic tips. This is a four stage process. The stages in this process are product, percentage, business, marketing, donut.

Column Chart Ppt PowerPoint Presentation Model Clipart Images
This is a column chart ppt powerpoint presentation model clipart images. This is a two stage process. The stages in this process are product, bar graph, growth, success, business.

Line Chart Ppt PowerPoint Presentation File Example File
This is a line chart ppt powerpoint presentation file example file. This is a two stage process. The stages in this process are product, in percentage, in years, growth, success.

Combo Chart Ppt PowerPoint Presentation File Visual Aids
This is a combo chart ppt powerpoint presentation file visual aids. This is a two stage process. The stages in this process are bar graph, business, marketing, finance, planning.
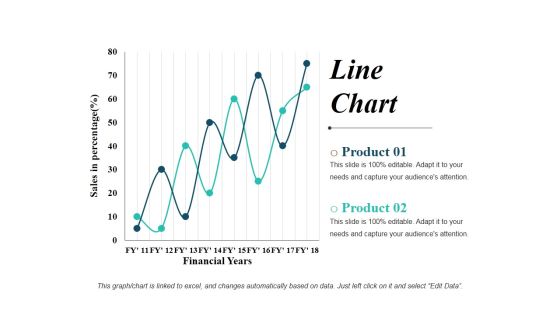
Line Chart Ppt PowerPoint Presentation Show Graphics Design
This is a line chart ppt powerpoint presentation show graphics design. This is a two stage process. The stages in this process are line graph, business, marketing, finance, planning.

Clustered Column Chart Ppt PowerPoint Presentation Show Slideshow
This is a clustered column chart ppt powerpoint presentation show slideshow. This is a six stage process. The stages in this process are financial year in, sales in percentage, business, marketing, finance.
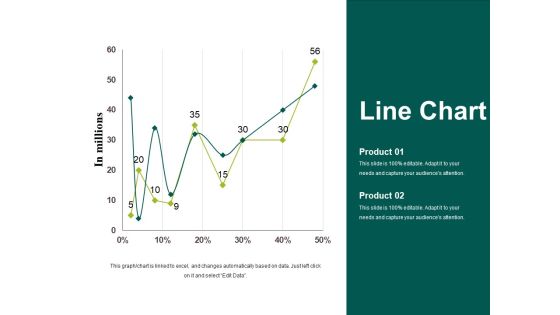
Line Chart Template 1 Ppt PowerPoint Presentation Styles Graphics Tutorials
This is a line chart template 1 ppt powerpoint presentation styles graphics tutorials. This is a two stage process. The stages in this process are in millions, business, marketing, strategy, graph.
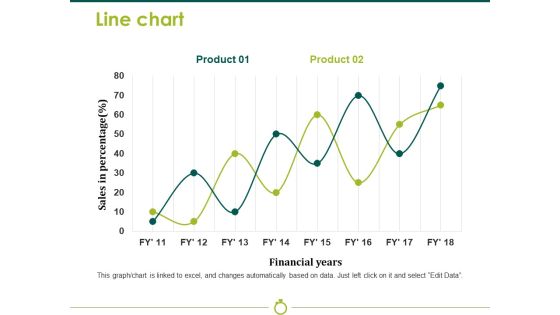
Line Chart Template 2 Ppt PowerPoint Presentation Model Background Image
This is a line chart template 2 ppt powerpoint presentation model background image. This is a two stage process. The stages in this process are sales in percentage, financial years, business, marketing, strategy, graph.

Column Chart Ppt PowerPoint Presentation Layouts Background Images
This is a column chart ppt powerpoint presentation layouts background images. This is a two stage process. The stages in this process are product, in months, graph, growth, success.
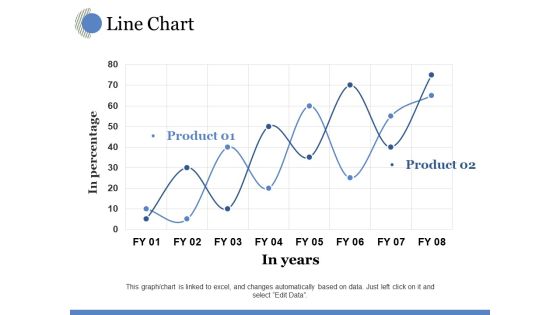
Line Chart Ppt PowerPoint Presentation Model Visual Aids
This is a line chart ppt powerpoint presentation model visual aids. This is a two stage process. The stages in this process are in years, in percentage, growth, business, marketing.

Line Chart Ppt PowerPoint Presentation Gallery Example Topics
This is a line chart ppt powerpoint presentation gallery example topics. This is a two stage process. The stages in this process are in millions, business, marketing, strategy, graph.

Column Chart Ppt PowerPoint Presentation Model Background Images
This is a column chart ppt powerpoint presentation model background images. This is a six stage process. The stages in this process are bar graph, marketing, finance, strategy, planning.

Open High Low Close Chart Ppt PowerPoint Presentation Styles Example
This is a open high low close chart ppt powerpoint presentation styles example. This is a four stage process. The stages in this process are business, marketing, finance, strategy, planning.
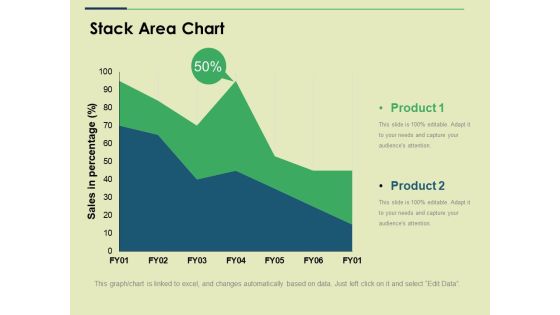
Stack Area Chart Ppt PowerPoint Presentation Show Slide
This is a stack area chart ppt powerpoint presentation show slide. This is a two stage process. The stages in this process are sales in percentage, business, marketing, strategy, graph.
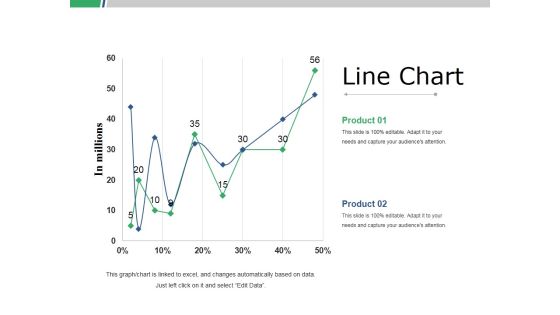
Line Chart Ppt PowerPoint Presentation Slides Graphics Template
This is a line chart ppt powerpoint presentation slides graphics template. This is a two stage process. The stages in this process are business, marketing, strategy, line graph, finance.

Column Chart Ppt PowerPoint Presentation Slides Visual Aids
This is a column chart ppt powerpoint presentation slides visual aids. This is a six stage process. The stages in this process are bar graph, growth, success, sales in percentage, financial year.

Column Chart Ppt PowerPoint Presentation Portfolio Slide Download
This is a column chart ppt powerpoint presentation portfolio slide download. This is a two stage process. The stages in this process are product, year, bar graph, success, business.
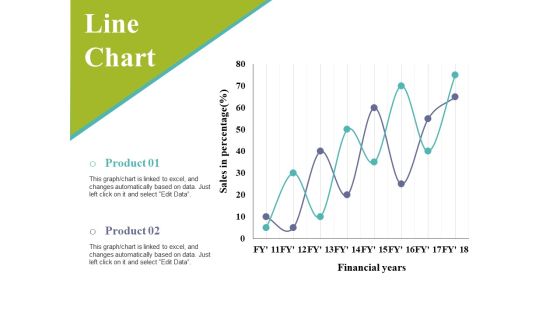
Line Chart Ppt PowerPoint Presentation Infographic Template Slides
This is a line chart ppt powerpoint presentation infographic template slides. This is a two stage process. The stages in this process are sales in percentage, financial years, business, marketing, graph.
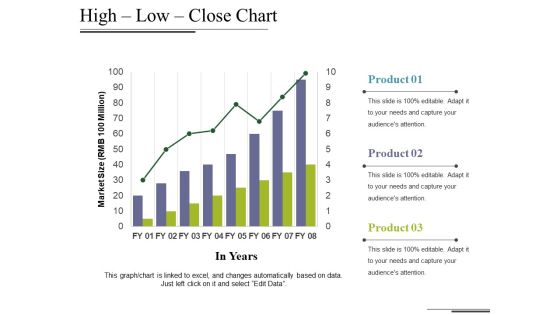
High Low Close Chart Ppt PowerPoint Presentation Styles Maker
This is a high low close chart ppt powerpoint presentation styles maker. This is a three stage process. The stages in this process are market size, in years, growth, business, marketing, graph.
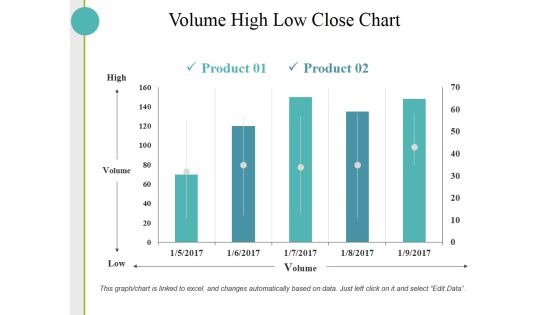
Volume High Low Close Chart Ppt PowerPoint Presentation Inspiration Skills
This is a volume high low close chart ppt powerpoint presentation inspiration skills. This is a two stage process. The stages in this process are high, volume, low, business.

Column Chart Ppt PowerPoint Presentation Infographics Design Inspiration
This is a column chart ppt powerpoint presentation infographics design inspiration. This is a two stage process. The stages in this process are slide bar, marketing, strategy, finance, planning.
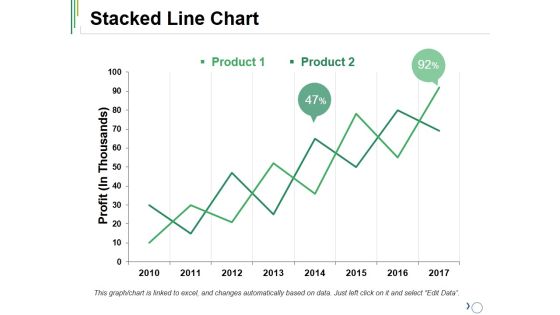
Stacked Line Chart Ppt PowerPoint Presentation Ideas Outfit
This is a stacked line chart ppt powerpoint presentation ideas outfit. This is a two stage process. The stages in this process are product, stacked line, profit, growth, success.

Column Chart Ppt PowerPoint Presentation Layouts Graphics Example
This is a column chart ppt powerpoint presentation layouts graphics example. This is a two stage process. The stages in this process are product, year, bar graph, business, finance.

Combo Chart Ppt PowerPoint Presentation Pictures Graphic Images
This is a combo chart ppt powerpoint presentation pictures graphic images. This is a three stage process. The stages in this process are bar graph, growth, market size, growth rate, success.
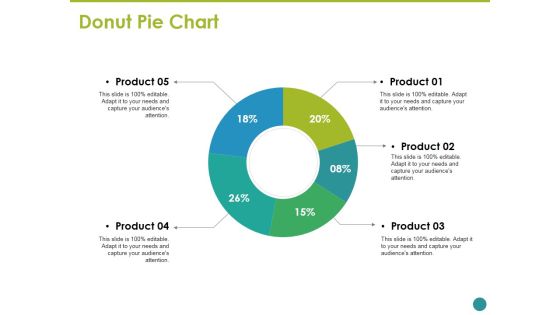
Donut Pie Chart Ppt PowerPoint Presentation Inspiration Graphic Images
This is a donut pie chart ppt powerpoint presentation inspiration graphic images. This is a five stage process. The stages in this process are business, marketing, strategy, planning, donut.

Combo Chart Ppt PowerPoint Presentation Styles Example Introduction
This is a combo chart ppt powerpoint presentation styles example introduction. This is a three stage process. The stages in this process are product, growth rate, market size, growth, success.

Clustered Column Line Chart Ppt PowerPoint Presentation Inspiration Graphics Pictures
This is a clustered column line chart ppt powerpoint presentation inspiration graphics pictures. This is a four stage process. The stages in this process are business, marketing, strategy, planning, finance.
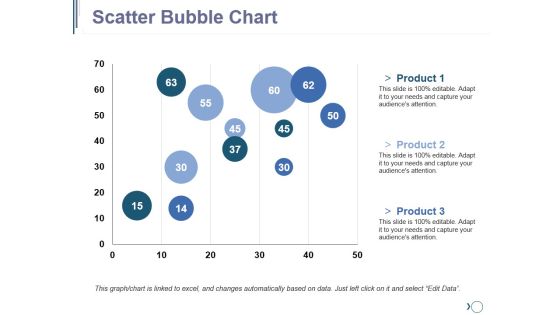
Scatter Bubble Chart Ppt PowerPoint Presentation Outline Graphics Pictures
This is a scatter bubble chart ppt powerpoint presentation outline graphics pictures. This is a three stage process. The stages in this process are finance, planning, business, marketing, strategy.

Column Chart Ppt PowerPoint Presentation Styles Graphics Design
This is a column chart ppt powerpoint presentation styles graphics design. This is a two stage process. The stages in this process are expenditure in, product, years, growth, success.

High Low Close Chart Ppt PowerPoint Presentation Portfolio Topics
This is a high low close chart ppt powerpoint presentation portfolio topics. This is a three stage process. The stages in this process are product, market size, in years, success, bar graph.

Column Chart Ppt PowerPoint Presentation Pictures Graphic Images
This is a column chart ppt powerpoint presentation pictures graphic images. This is a two stage process. The stages in this process are product, years, growth, success, bar graph.

Bar Chart Ppt PowerPoint Presentation Inspiration Background Image
This is a bar chart ppt powerpoint presentation inspiration background image. This is a two stage process. The stages in this process are business, marketing, strategy, finance, in years, in percentage.

Scatter Bubble Chart Ppt PowerPoint Presentation Gallery Show
This is a scatter bubble chart ppt powerpoint presentation gallery show. This is a two stage process. The stages in this process are profit, in percentage, finance, marketing, business.
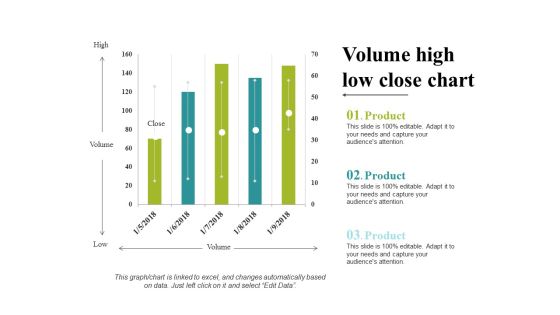
Volume High Low Close Chart Ppt PowerPoint Presentation Portfolio Clipart
This is a volume high low close chart ppt powerpoint presentation portfolio clipart. This is a five stage process. The stages in this process are business, marketing, strategy, planning, finance.

Area Chart Ppt PowerPoint Presentation Portfolio Graphics Design
This is a area chart ppt powerpoint presentation portfolio graphics design. This is a two stage process. The stages in this process are business, marketing, in percentage, graph, finance.
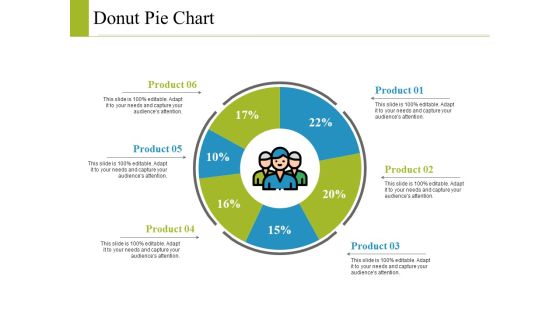
Donut Pie Chart Ppt PowerPoint Presentation Model Graphics Example
This is a donut pie chart ppt powerpoint presentation model graphics example. This is a six stage process. The stages in this process are business, marketing, strategy, planning, finance.
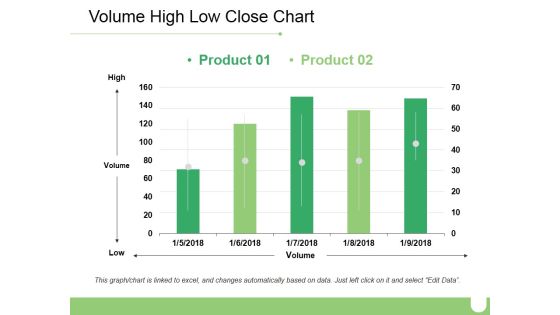
Volume High Low Close Chart Ppt PowerPoint Presentation Inspiration Brochure
This is a volume high low close chart ppt powerpoint presentation inspiration brochure. This is a two stage process. The stages in this process are business, high, volume, low, marketing.
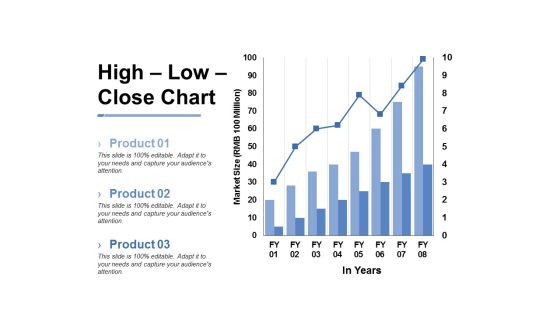
High Low Close Chart Ppt PowerPoint Presentation Inspiration Slide
This is a high low close chart ppt powerpoint presentation inspiration slide. This is a three stage process. The stages in this process are business, marketing, market size, in years, graph.
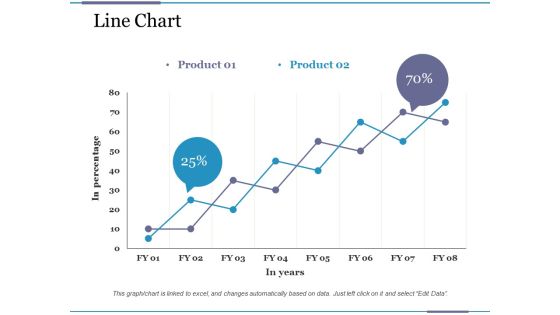
Line Chart Ppt PowerPoint Presentation Pictures File Formats
This is a line chart ppt powerpoint presentation pictures file formats. This is a two stage process. The stages in this process are business, financial, in percentage, in years, graph.

Bar Chart Ppt PowerPoint Presentation Show Format Ideas
This is a bar chart ppt powerpoint presentation show format ideas. This is a two stage process. The stages in this process are bar graph, growth, success, business, marketing.

Donut Pie Chart Ppt PowerPoint Presentation Visual Aids Model
This is a donut pie chart ppt powerpoint presentation visual aids model. This is a four stage process. The stages in this process are product, percentage, finance, donut, business.

Bar Chart Ppt PowerPoint Presentation Summary File Formats
This is a bar chart ppt powerpoint presentation summary file formats. This is a two stage process. The stages in this process are business, finance, financial years, sales in percentage, graph.

Column Chart Ppt PowerPoint Presentation Layouts Graphic Images
This is a column chart ppt powerpoint presentation layouts graphic images. This is a two stage process. The stages in this process are business, finance, years, graph, expenditure in, marketing.

Column Chart Ppt PowerPoint Presentation Outline Design Ideas
This is a column chart ppt powerpoint presentation outline design ideas. This is a two stage process. The stages in this process are business, years, expenditure in, marketing, finance.

Combo Chart Ppt PowerPoint Presentation Gallery Design Ideas
This is a combo chart ppt powerpoint presentation gallery design ideas. This is a three stage process. The stages in this process are business, financial years, sales in percentage, finance, graph.

Donut Pie Chart Ppt PowerPoint Presentation Pictures Layout Ideas
This is a donut pie chart ppt powerpoint presentation pictures layout ideas. This is a four stage process. The stages in this process are percentage, finance, donut, business, product.

Line Chart Ppt PowerPoint Presentation Infographic Template Master Slide
This is a line chart ppt powerpoint presentation infographic template master slide. This is a two stage process. The stages in this process are product, financial years, sales in percentage.

Area Chart Ppt PowerPoint Presentation Outline Graphics Pictures
This is a area chart ppt powerpoint presentation outline graphics pictures. This is a two stage process. The stages in this process are financial year, in percentage, business, marketing, finance.

Combo Chart Ppt PowerPoint Presentation Summary Background Images
This is a combo chart ppt powerpoint presentation summary background images. This is a two stage process. The stages in this process are business, marketing, financial year, in percentage, graph.

Area Chart Ppt PowerPoint Presentation Layouts Graphic Images
This is a area chart ppt powerpoint presentation layouts graphic images. This is a three stage process. The stages in this process are business, in years, marketing, in percentage, finance, graph.
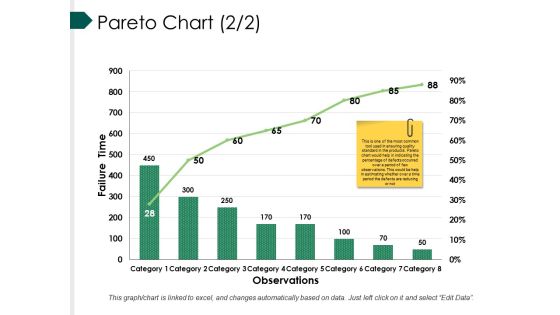
Pareto Chart Template Ppt PowerPoint Presentation Summary Graphic Images
This is a pareto chart template ppt powerpoint presentation summary graphic images. This is a eight stage process. The stages in this process are bar, marketing, strategy, finance, teamwork.
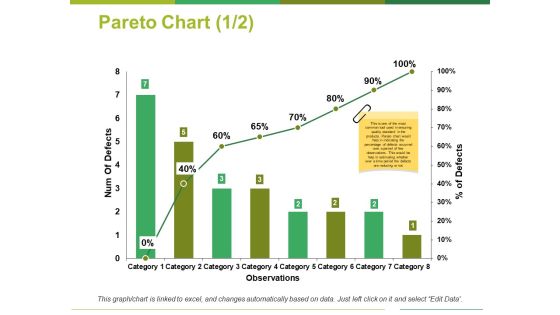
Pareto Chart Template 1 Ppt PowerPoint Presentation Outline Show
This is a pareto chart template 1 ppt powerpoint presentation outline show. This is a eight stage process. The stages in this process are num of defects, percentage of defects, observations, category.

Pareto Chart Template 1 Ppt PowerPoint Presentation File Ideas
This is a pareto chart template 1 ppt powerpoint presentation file ideas. This is a eight stage process. The stages in this process are business, finance, marketing, strategy, analysis.

Regression Line Chart Ppt PowerPoint Presentation Visual Aids Summary
This is a regression line chart ppt powerpoint presentation visual aids summary. This is a two stage process. The stages in this process are linear periodization, linear growth, linear progression.

Three Charts For Linear Relationship Ppt PowerPoint Presentation Model Example
This is a three charts for linear relationship ppt powerpoint presentation model example. This is a three stage process. The stages in this process are linear periodization, linear growth, linear progression.
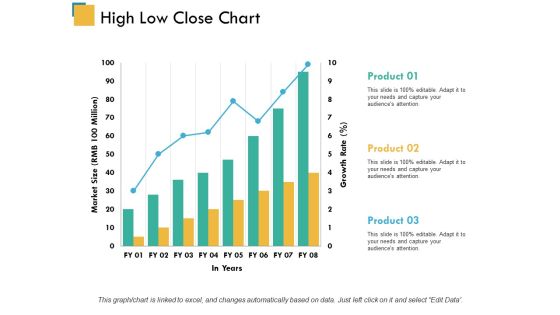
High Low Close Chart Ppt PowerPoint Presentation Model Inspiration
This is a high low close chart ppt powerpoint presentation model inspiration. This is a three stage process. The stages in this process are product, market size, in years.
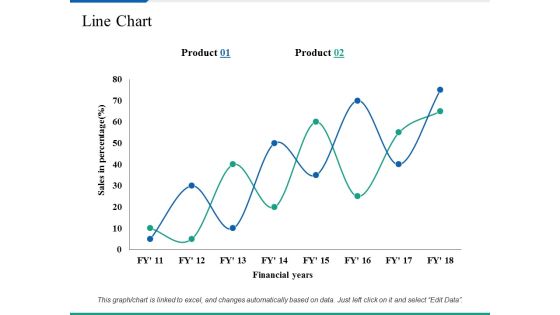
Line Chart Ppt PowerPoint Presentation Summary Clipart Images
This is a line chart ppt powerpoint presentation summary clipart images. This is a two stage process. The stages in this process are business, marketing, sales in percentage, financial years, strategy.

Bar Chart Finance Ppt PowerPoint Presentation Infographics Background Images
This is a bar chart finance ppt powerpoint presentation infographics background images. This is a seven stages process. The stages in this process are alpha testing, beta testing, full scale show.
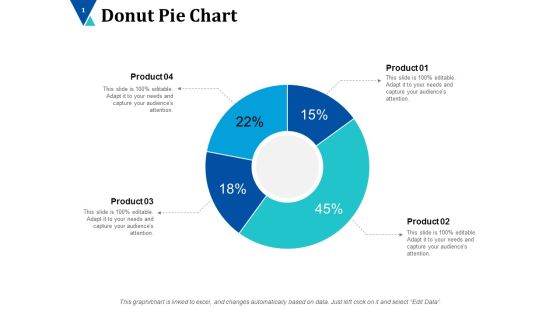
Donut Pie Chart Ppt PowerPoint Presentation Inspiration Designs Download
This is a donut pie chart ppt powerpoint presentation inspiration designs download. This is a four stage process. The stages in this process are donut, business, planning, marketing, finance.
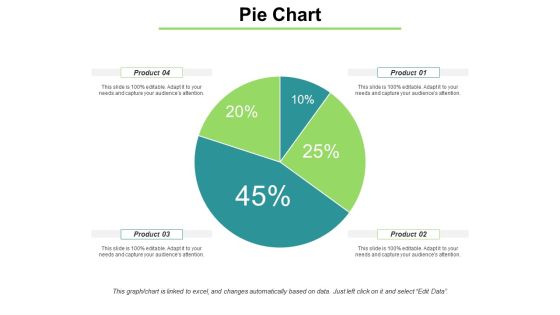
Pie Chart With Distrubation Ppt PowerPoint Presentation Model Ideas
This is a pie chart with distrubation ppt powerpoint presentation model ideas. This is a four stage process. The stages in this process are pie, finance, marketing, strategy, planning.

Combo Chart Finance Ppt PowerPoint Presentation Infographic Template Microsoft
This is a combo chart finance ppt powerpoint presentation infographic template microsoft. This is a three stage process. The stages in this process are finance, marketing, management, investment, analysis.
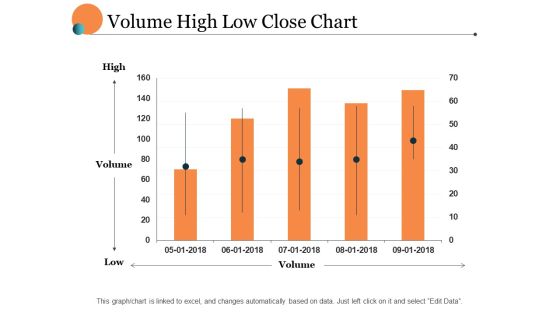
Volume High Low Close Chart Ppt PowerPoint Presentation Portfolio Layout
This is a volume high low close chart ppt powerpoint presentation portfolio layout. This is a five stage process. The stages in this process are finance, marketing, management, investment, analysis.

Clustered Column Chart Ppt PowerPoint Presentation Professional Ideas
This is a clustered column chart ppt powerpoint presentation professional ideas. This is a three stage process. The stages in this process are product, sales in percentage, column, years.

Control Charts Sample Value Ppt PowerPoint Presentation Infographics Demonstration
This is a control charts sample value ppt powerpoint presentation infographics demonstration. This is a five stage process. The stages in this process are product, percentage, marketing, business, management.

Control Charts Template 1 Ppt PowerPoint Presentation Show Graphics Design
This is a control charts template 1 ppt powerpoint presentation show graphics design. This is a one stage process. The stages in this process are business, finance, marketing, strategy, analysis.

Control Charts Template 2 Ppt PowerPoint Presentation Slides Designs
This is a control charts template 2 ppt powerpoint presentation slides designs. This is a one stage process. The stages in this process are business, finance, marketing, strategy, analysis.

Combo Chart Finance Ppt PowerPoint Presentation Infographic Template Graphics
This is a combo chart finance ppt powerpoint presentation infographic template graphics. This is a two stage process. The stages in this process are growth, finance, marketing, management, investment.

Bar Chart Finance Ppt PowerPoint Presentation Model Master Slide
This is a bar chart finance ppt powerpoint presentation model master slide. This is a two stage process. The stages in this process are finance, marketing, management, investment, analysis.
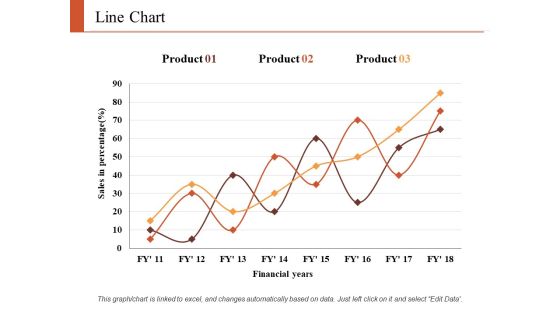
Line Chart Finance Ppt PowerPoint Presentation Infographic Template Graphics Tutorials
This is a line chart finance ppt powerpoint presentation infographic template graphics tutorials. This is a three stage process. The stages in this process are finance, marketing, analysis, business, investment.
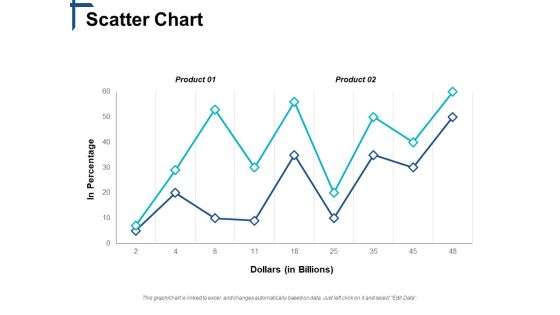
Scatter Chart Competitive Differentiation Ppt PowerPoint Presentation Show Slides
This is a scatter chart competitive differentiation ppt powerpoint presentation show slides. This is a two stage process. The stages in this process are business, management, marketing, strategy, sales.

Area Chart Finance Ppt PowerPoint Presentation Summary Design Templates
This is a area chart finance ppt powerpoint presentation summary design templates. This is a two stage process. The stages in this process are finance, marketing, management, investment, analysis.
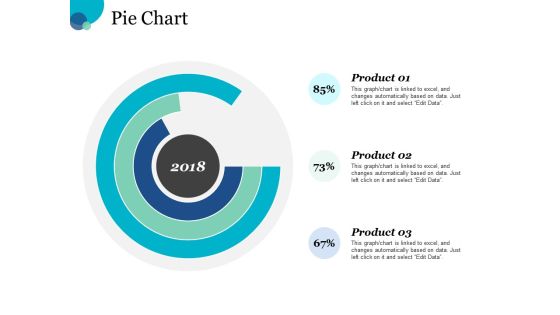
Pie Chart Finance Ppt PowerPoint Presentation Slides Graphic Images
This is a pie chart finance ppt powerpoint presentation slides graphic images. This is a three stage process. The stages in this process are finance, marketing, management, investment, analysis.

Pie Chart Finance Ppt PowerPoint Presentation Styles File Formats
This is a pie chart finance ppt powerpoint presentation styles file formats. This is a four stage process. The stages in this process are finance, analysis, business, investment, marketing.

Donut Pie Chart Ppt PowerPoint Presentation Infographic Template Slides
This is a donut pie chart ppt powerpoint presentation infographic template slides. This is a three stage process. The stages in this process are percentage, product, business, management, marketing.

Pie Chart Marketing Finance Ppt PowerPoint Presentation Gallery Good
This is a pie chart marketing finance ppt powerpoint presentation gallery good. This is a three stage process. The stages in this process are finance, analysis, business, investment, marketing.

Donut Pie Chart Finance Ppt PowerPoint Presentation Inspiration Graphics
This is a donut pie chart finance ppt powerpoint presentation inspiration graphics. This is a three stage process. The stages in this process are finance, analysis, business, investment, marketing.

Daunt Pie Chart Investment Ppt PowerPoint Presentation Infographic Template Aids
This is a daunt pie chart investment ppt powerpoint presentation infographic template aids. This is a four stage process. The stages in this process are finance, analysis, business, investment, marketing.
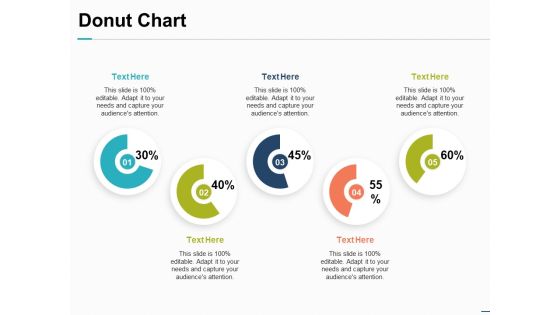
Donut Chart Financial Investment Ppt PowerPoint Presentation Inspiration Introduction
This is a donut chart financial investment ppt powerpoint presentation inspiration introduction. This is a five stage process. The stages in this process are finance, marketing, management, investment, analysis.

Clustered Bar Chart Finance Ppt PowerPoint Presentation Summary Layouts
This is a clustered bar chart finance ppt powerpoint presentation summary layouts. This is a two stage process. The stages in this process are finance, marketing, management, investment, analysis.

Area Chart Investment Ppt PowerPoint Presentation Summary Design Inspiration
This is a area chart investment ppt powerpoint presentation summary design inspiration. This is a three stage process. The stages in this process are finance, marketing, management, investment, analysis.

Clustered Column Chart Planning Ppt PowerPoint Presentation Portfolio Information
This is a clustered column chart planning ppt powerpoint presentation portfolio information. This is a four stage process. The stages in this process are finance, marketing, analysis, business, investment.

Area Chart Finance Ppt Powerpoint Presentation Infographic Template Clipart Images
This is a area chart finance ppt powerpoint presentation infographic template clipart images. This is a two stage process. The stages in this process are area bar, finance, marketing, management, analysis.
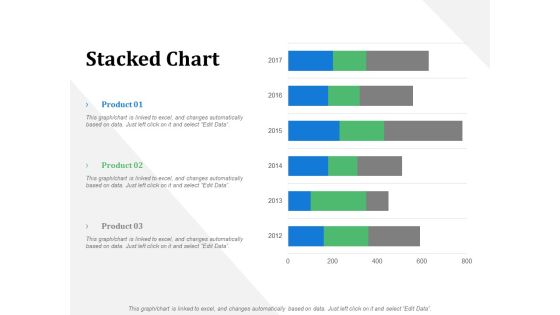
Stacked Chart Business Marketing Ppt PowerPoint Presentation File Design Ideas
This is a stacked chart business marketing ppt powerpoint presentation file design ideas. This is a three stage process. The stages in this process are business, management, marketing, product, percentage.

Donut Chart Marketing Product Ppt PowerPoint Presentation Slides Background Designs
This is a donut chart marketing product ppt powerpoint presentation slides background designs. This is a three stage process. The stages in this process are business, management, marketing, percentage, product.

Clustered Column Chart Investment Ppt PowerPoint Presentation Infographic Template Clipart
This is a clustered column chart investment ppt powerpoint presentation infographic template clipart. This is a four stage process. The stages in this process are finance, analysis, business, investment, marketing.

Combo Chart Finance Marketing Ppt PowerPoint Presentation File Guidelines
This is a combo chart finance marketing ppt powerpoint presentation file guidelines. This is a three stage process. The stages in this process are finance, analysis, business, investment, marketing.

Area Chart Finance Ppt PowerPoint Presentation Styles Designs Download
This is a area chart finance ppt powerpoint presentation styles designs download. This is a three stage process. The stages in this process are finance, analysis, business, investment, marketing.

Column Chart Finance Investment Ppt PowerPoint Presentation Inspiration Template
This is a column chart finance investment ppt powerpoint presentation inspiration template. This is a two stage process. The stages in this process are finance, analysis, business, investment, marketing.

Bubble Chart Product Ppt PowerPoint Presentation Inspiration Design Ideas
This is a bubble chart product ppt powerpoint presentation inspiration design ideas. This is a one stage process. The stages in this process are business, management, marketing, product, percentage.
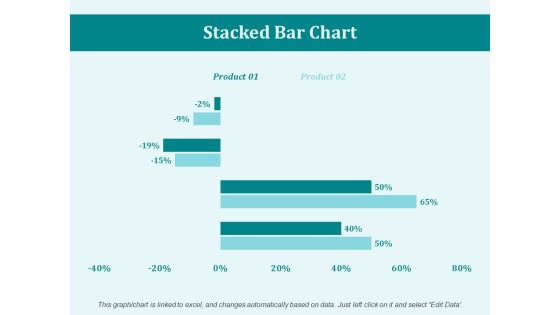
Stacked Bar Chart Percentage Ppt PowerPoint Presentation Portfolio Mockup
This is a stacked bar chart percentage ppt powerpoint presentation portfolio mockup. This is a two stage process. The stages in this process are business, marketing, management, percentage, product.
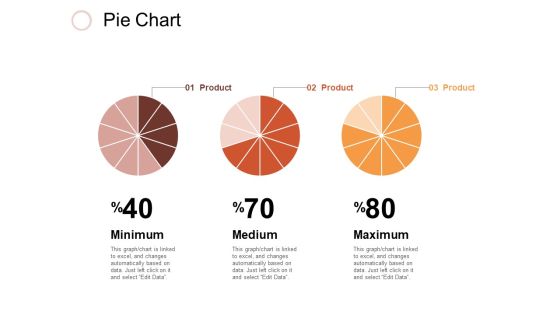
Pie Chart Investment Ppt PowerPoint Presentation Inspiration Design Inspiration
This is a pie chart investment ppt powerpoint presentation inspiration design inspiration. This is a three stage process. The stages in this process are business, management, marketing, percentage, product.

Clustered Column Chart Finance Ppt PowerPoint Presentation Gallery Styles
This is a clustered column chart finance ppt powerpoint presentation gallery styles. This is a three stage process. The stages in this process are finance, analysis, business, investment, marketing.

Combo Chart Product Ppt PowerPoint Presentation Professional Graphics Template
This is a combo chart product ppt powerpoint presentation professional graphics template. This is a three stage process. The stages in this process are finance, marketing, management, investment, product.
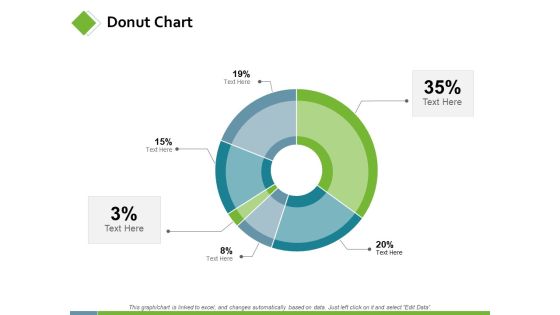
Donut Chart Marketing Planning Ppt PowerPoint Presentation Model Slideshow
This is a donut chart marketing planning ppt powerpoint presentation model slideshow. This is a six stage process. The stages in this process are finance, analysis, business, investment, marketing.
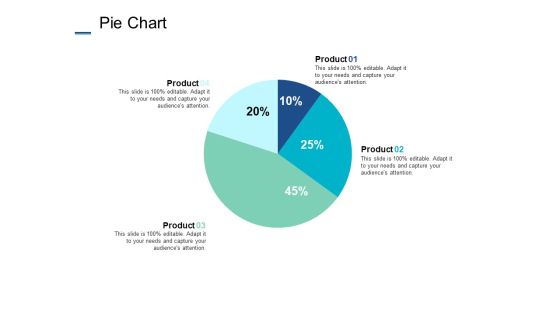
Pie Chart Finance Marketing Ppt PowerPoint Presentation Styles Outfit
This is a pie chart finance marketing ppt powerpoint presentation styles outfit. This is a four stage process. The stages in this process are finance, analysis, business, investment, marketing.

Bubble Chart Percentage Ppt PowerPoint Presentation File Layouts
This is a bubble chart percentage ppt powerpoint presentation file layouts. This is a two stage process. The stages in this process are finance, marketing, management, investment, product, percentage.

Pie Chart Marketing Finance Ppt PowerPoint Presentation File Guidelines
This is a pie chart marketing finance ppt powerpoint presentation file guidelines. This is a three stage process. The stages in this process are finance, analysis, business, investment, marketing.

Column Chart Marketing Finance Ppt PowerPoint Presentation Infographic Template Rules
This is a column chart marketing finance ppt powerpoint presentation infographic template rules. This is a two stage process. The stages in this process are finance, analysis, business, investment, marketing.

Area Chart Finance Marketing Ppt PowerPoint Presentation Gallery Graphics Design
This is a area chart finance marketing ppt powerpoint presentation gallery graphics design. This is a three stage process. The stages in this process are finance, analysis, business, investment, marketing.
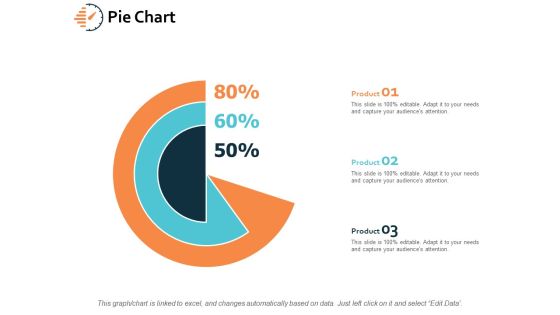
Pie Chart Investment Finance Ppt PowerPoint Presentation File Influencers
This is a pie chart investment finance ppt powerpoint presentation file influencers. This is a three stage process. The stages in this process are finance, analysis, business, investment, marketing.

Bar Chart Percentage Product Ppt PowerPoint Presentation Layouts Designs Download
This is a bar chart percentage product ppt powerpoint presentation layouts designs download. This is a two stage process. The stages in this process are percentage, product, business, management.
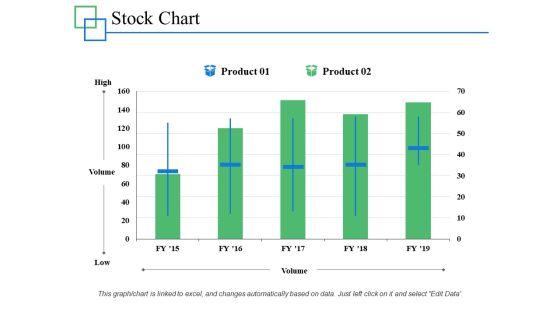
Stock Chart Management Investment Ppt PowerPoint Presentation Infographics Professional
This is a stock chart management investment ppt powerpoint presentation infographics professional. This is a two stage process. The stages in this process are marketing, business, management, percentage, product.

Column Chart Marketing Strategy Ppt PowerPoint Presentation Layouts Slide Portrait
This is a column chart marketing strategy ppt powerpoint presentation layouts slide portrait. This is a two stage process. The stages in this process are percentage, product, business, management, marketing.

Bubble Chart Percentage Product Ppt PowerPoint Presentation Ideas Aids
This is a bubble chart percentage product ppt powerpoint presentation ideas aids. This is a two stage process. The stages in this process are business, management, marketing, percentage, product.

Column Chart Finance Marketing Ppt PowerPoint Presentation Model Example Introduction
This is a column chart finance marketing ppt powerpoint presentation model example introduction. This is a two stage process. The stages in this process are business, management, marketing, percentage, product.

Combo Chart Investment Ppt PowerPoint Presentation Summary Infographic Template
This is a combo chart investment ppt powerpoint presentation summary infographic template. This is a three stage process. The stages in this process are finance, analysis, business, investment, marketing.
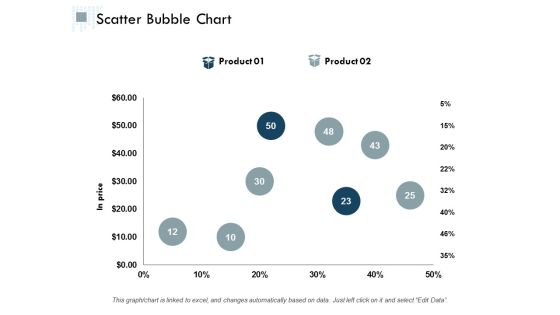
Scatter Bubble Chart Ppt PowerPoint Presentation Infographic Template Graphics Design
This is a scatter bubble chart ppt powerpoint presentation infographic template graphics design. This is a two stage process. The stages in this process are finance, analysis, business, investment, marketing.

Area Chart Marketing Finance Ppt PowerPoint Presentation Ideas Elements
This is a area chart marketing finance ppt powerpoint presentation ideas elements. This is a two stage process. The stages in this process are finance, analysis, business, investment, marketing.

Clustered Chart Finance Marketing Ppt PowerPoint Presentation Layouts Outfit
This is a clustered chart finance marketing ppt powerpoint presentation layouts outfit. This is a four stage process. The stages in this process are finance, analysis, business, investment, marketing.

Bar Chart Finance Marketing Ppt PowerPoint Presentation File Good
This is a bar chart finance marketing ppt powerpoint presentation file good. This is a three stage process. The stages in this process are finance, marketing, management, investment, analysis.

Bar Chart Management Investment Ppt PowerPoint Presentation File Rules
This is a bar chart management investment ppt powerpoint presentation file rules. This is a three stage process. The stages in this process are finance, marketing, management, investment, analysis.
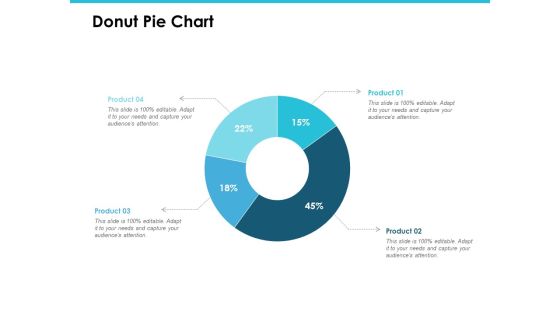
Donut Pie Chart Investment Analysis Ppt PowerPoint Presentation Gallery Introduction
This is a donut pie chart investment analysis ppt powerpoint presentation gallery introduction. This is a four stage process. The stages in this process are finance, marketing, management, investment, analysis.
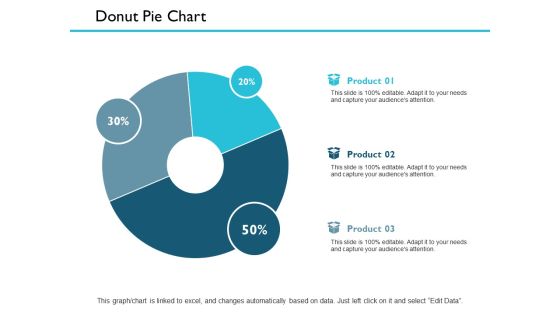
Donut Pie Chart Finance Ppt PowerPoint Presentation Outline Smartart
This is a donut pie chart finance ppt powerpoint presentation outline smartart. This is a three stage process. The stages in this process are management, marketing, business, strategy, finance.
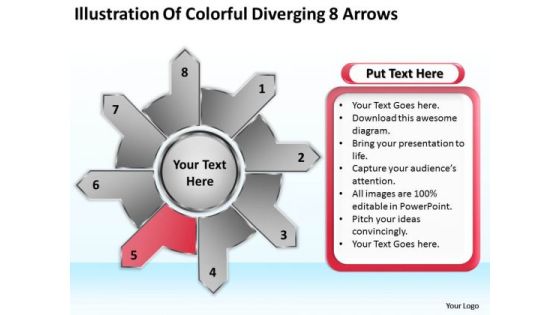
Illustration Of Colorful Diverging 8 Arrows Ppt Circular Flow Process PowerPoint Slides
We present our illustration of colorful diverging 8 arrows ppt Circular Flow Process PowerPoint Slides.Present our Process and Flows PowerPoint Templates because Our PowerPoint Templates and Slides are topically designed to provide an attractive backdrop to any subject. Use our Flow charts PowerPoint Templates because this emphasises on the relevance and importance of all milestones along the way. Use our Arrows PowerPoint Templates because this Layout can explain the relevance of the different layers and stages in getting down to your core competence, ability and desired result. Download our Signs PowerPoint Templates because this template helps you to put your finger on the pulse of your business and sense the need to re-align a bit. Download and present our Shapes PowerPoint Templates because it helps you to get your team in the desired sequence into the bracket.Use these PowerPoint slides for presentations relating to Abstract, access, arrow,blue, bright, business, chart,circle, color, colorful, concept,conceptual, connection, corporate,creative, cycle, design, different, element,empty, form, frame, graphic, green,group, idea, illustration, order, part, piece, place,process, red, shape, solution, special,speech, strategy, symbol. The prominent colors used in the PowerPoint template are Red, White, Black. People tell us our illustration of colorful diverging 8 arrows ppt Circular Flow Process PowerPoint Slides are Tasteful. Customers tell us our chart PowerPoint templates and PPT Slides are Zippy. Professionals tell us our illustration of colorful diverging 8 arrows ppt Circular Flow Process PowerPoint Slides are designed by professionals Presenters tell us our chart PowerPoint templates and PPT Slides are Fancy. Use our illustration of colorful diverging 8 arrows ppt Circular Flow Process PowerPoint Slides are second to none. Presenters tell us our chart PowerPoint templates and PPT Slides are Adorable.
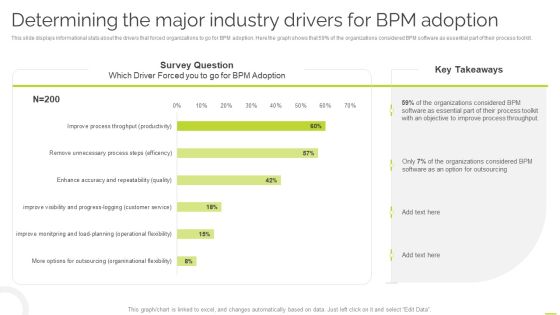
Effective BPM Tool For Business Process Management Determining The Major Industry Drivers For BPM Adoption Rules PDF
This slide displays informational stats about the drivers that forced organizations to go for BPM adoption. Here the graph shows that 59 percent of the organizations considered BPM software as essential part of their process toolkit. Whether you have daily or monthly meetings, a brilliant presentation is necessary. Effective BPM Tool For Business Process Management Determining The Major Industry Drivers For BPM Adoption Rules PDF can be your best option for delivering a presentation. Represent everything in detail using Effective BPM Tool For Business Process Management Determining The Major Industry Drivers For BPM Adoption Rules PDF and make yourself stand out in meetings. The template is versatile and follows a structure that will cater to your requirements. All the templates prepared by Slidegeeks are easy to download and edit. Our research experts have taken care of the corporate themes as well. So, give it a try and see the results.
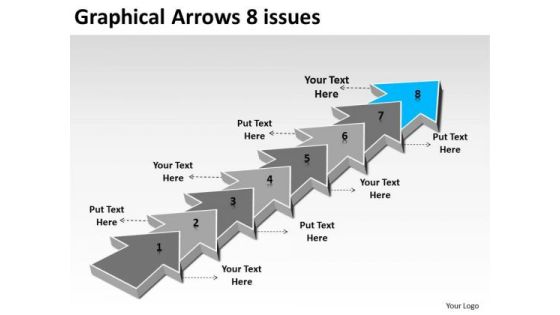
Graphical Arrows 8 Issues Ppt 9 Flow Chart Maker Free PowerPoint Slides
We present our graphical arrows 8 issues ppt 9 flow chart maker free PowerPoint Slides. Use our Marketing PowerPoint Templates because, Our Template designs are State of the Art. Use our Arrows PowerPoint Templates because, Saves your time a prized possession, an ideal aid to give an ideal presentation. Use our Business PowerPoint Templates because, Marketing Strategy Business Template:- Maximizing sales of your product is the intended destination. Use our Process and Flows PowerPoint Templates because; now funnel your marketing strategies down the cone, stage by stage, refining as you go along. Use our Leadership PowerPoint Templates because, you have the people in place, selected the team leaders and all are raring to go. Use these PowerPoint slides for presentations relating to Advertising, arrow, background, banner, bookmark, card, choice, concept, creative, design, direction, flow, idea, illustration, info graphic, instruction, label, layout, marketing, modern, next, options, process, product, promotion, sequence, simple, step, symbol, template, triangle. The prominent colors used in the PowerPoint template are Blue, Gray, and White

3d Angled Arrow Describing 5 Stages Flow Chart Of Production PowerPoint Slides
We present our 3d angled arrow describing 5 stages flow chart of production PowerPoint Slides. Use our Marketing PowerPoint Templates because, Probe the minds of your colleagues, see their faces light up as they assimilate and understand the value of your suggestions. Use our Business PowerPoint Templates because; Use your findings to help arrive at an accurate diagnosis. Use our Shapes PowerPoint Templates because, Amplify on your plans to have dedicated sub groups working on related but distinct tasks. Use our Process and Flows PowerPoint Templates because, Like your thoughts arrows are inherently precise and true. Use our Arrows PowerPoint Templates because, Timelines Display:- You have developed a vision of where you want to be a few years from now. Use these PowerPoint slides for presentations relating to Advertising, arrow, background, banner, bookmark, choice, concept, creative, design, direction, flow, illustration, instruction, label, layout, manual, marketing, modern, next, offer, options, order, pointer, process, product, promotion, sequence, simple, special, symbol, template, tutorial, two, vector, version, website. The prominent colors used in the PowerPoint template are Blue, Gray, and White

3d Angled Arrow Describing 5 Stages Ppt Business Work Flow Chart PowerPoint Slides
We present our 3d angled arrow describing 5 stages ppt business work flow chart PowerPoint Slides. Use our Marketing PowerPoint Templates because, Signpost your preferred roadmap to your eager co- travelers and demonstrate clearly how you intend to navigate them towards the desired corporate goal. Use our Business PowerPoint Templates because, Marketing Strategy Business Template: - Maximizing sales of your product is the intended destination. Use our Shapes PowerPoint Templates because; educate your staff on the means to provide the required support for speedy recovery. Use our Process and Flows PowerPoint Templates because, There are a bucketful of brilliant ideas swirling around within your group. Use our Arrows PowerPoint Templates because; now funnel your marketing strategies down the cone, stage by stage, refining as you go along. Use these PowerPoint slides for presentations relating to Advertising, arrow, background, banner, bookmark, choice, concept, creative, design, direction, flow, illustration, instruction, label, layout, manual, marketing, modern, next, offer, options, order, pointer, process, product, promotion, sequence, simple, special, symbol, template, tutorial, two, vector, version, website. The prominent colors used in the PowerPoint template are Blue, Gray, and White

3d Angled Arrow Describing 5 Stages System Flow Charts PowerPoint Templates
We present our 3d angled arrow describing 5 stages system flow charts PowerPoint templates. Use our Marketing PowerPoint Templates because, have always been a source of inspiration for us all. Use our Business PowerPoint Templates because, you have some great folks working with you, thinking with you. Use our Shapes PowerPoint Templates because, our presentation designs are for those on the go. Use our Process and Flows PowerPoint Templates because, now fire the arrows to emblazon the desired path by which you will achieve anticipated results. Use our Arrows PowerPoint Templates because, Present your views using our innovative slides and be assured of leaving a lasting impression. Use these PowerPoint slides for presentations relating to Advertising, arrow, background, banner, bookmark, choice, concept, creative, design, direction, flow, illustration, instruction, label, layout, manual, marketing, modern, next, offer, options, order, pointer, process, product, promotion, sequence, simple, special, symbol, template, tutorial, two, vector, version, website. The prominent colors used in the PowerPoint template are Purple, Gray, and White

3d Arrow Oriented Illustrating 7 Stages Production Planning Flow Chart PowerPoint Slides
We present our 3d arrow oriented illustrating 7 stages production planning flow chart PowerPoint Slides. Use our Marketing PowerPoint Templates because; Use our templates to illustrate your ability. Use our Business PowerPoint Templates because, you have the moves to sway the market. Use our Shapes PowerPoint Templates because, you have the ideas to develop the teams vision of where they need to be in the future. Use our Process and Flows PowerPoint Templates because, Ideas roll along in your mind like billiard balls. Use our Arrows PowerPoint Templates because, you are going along well but your foresight shows that it may need a slight change in plans or direction. Use these PowerPoint slides for presentations relating to Advertising, arrow, background, banner, bookmark, choice, concept, creative, design, direction, flow, illustration, instruction, label, layout, manual, marketing, modern, next, offer, options, order, pointer, process, product, promotion, sequence, simple, special, symbol, template, tutorial, two, vector, version, website. The prominent colors used in the PowerPoint template are Pink, Gray, and White

3d Horizontal Demonstration Using Arrows 8 Stages Business Plan Flow Chart PowerPoint Slides
We present our 3d horizontal demonstration using arrows 8 stages business plan flow chart PowerPoint Slides. Use our Marketing PowerPoint Templates because, you have a great plan to put the pieces together, getting all the various contributors to gel for a successful completion. Use our Shapes PowerPoint Templates because, Use our to enthuse your colleagues. Use our Business PowerPoint Templates because; Draw on its universal impact to highlight the similarities with your organizational structure and plans. Use our Process and Flows PowerPoint Templates because, and watch them strengthen your companys sinews. Use our Arrows PowerPoint Templates because, the pyramid is a symbol of the desire to reach the top in a steady manner. Use these PowerPoint slides for presentations relating to 3d, abstract, around, arrows, blue, border, business, center, circle, circular, concept, connections, copy, curve, cycle, directions, distribution, illustration, management, middle, objects, pieces, plan, pointing, process, recycle, rounded, shadows, space, system. The prominent colors used in the PowerPoint template are Blue navy, Black, Gray

Square 6 Stages Concentric Flow Chart Ppt Business Plan PowerPoint Template
We present our square 6 stages concentric flow chart ppt business plan PowerPoint template.Use our Business PowerPoint Templates because Our PowerPoint Templates and Slides will provide weight to your words. They will bring out the depth of your thought process. Download our Signs PowerPoint Templates because Our PowerPoint Templates and Slides are the chords of your song. String them along and provide the lilt to your views. Download our Shapes PowerPoint Templates because You are an avid believer in ethical practices. Highlight the benefits that accrue with our PowerPoint Templates and Slides. Download our Boxes PowerPoint Templates because you should Experience excellence with our PowerPoint Templates and Slides. They will take your breath away. Use our Process and Flows PowerPoint Templates because It can Conjure up grand ideas with our magical PowerPoint Templates and Slides. Leave everyone awestruck by the end of your presentation.Use these PowerPoint slides for presentations relating to 60s, 70s, art, background, decoration, decorative, design, fractal, generative, genetic, geometrical, hippie, illusion, illustration, kaleidoscope, kaleidoscopic, landscape, math, mathematical, mosaic, op, optical, optical illusion, pattern, pop, psychedelic, raytrace, retro, sculpture, seamless, seventies, sixties, symmetric, synthetic, vintage, virtual, virtual sculpture, wallpaper. The prominent colors used in the PowerPoint template are Green, Gray, White.
Square 6 Stages Concentric Flow Chart Ppt Business Plan PowerPoint Templates
We present our square 6 stages concentric flow chart ppt business plan PowerPoint templates.Use our Business PowerPoint Templates because Our PowerPoint Templates and Slides team portray an attitude of elegance. Personify this quality by using them regularly. Present our Signs PowerPoint Templates because Our PowerPoint Templates and Slides are topically designed to provide an attractive backdrop to any subject. Use our Shapes PowerPoint Templates because Our PowerPoint Templates and Slides will definately Enhance the stature of your presentation. Adorn the beauty of your thoughts with their colourful backgrounds. Use our Boxes PowerPoint Templates because Our PowerPoint Templates and Slides are created by a hardworking bunch of busybees. Always flitting around with solutions gauranteed to please. Use our Process and Flows PowerPoint Templates because Our PowerPoint Templates and Slides will provide weight to your words. They will bring out the depth of your thought process.Use these PowerPoint slides for presentations relating to 60s, 70s, art, background, decoration, decorative, design, fractal, generative, genetic, geometrical, hippie, illusion, illustration, kaleidoscope, kaleidoscopic, landscape, math, mathematical, mosaic, op, optical, optical illusion, pattern, pop, psychedelic, raytrace, retro, sculpture, seamless, seventies, sixties, symmetric, synthetic, vintage, virtual, virtual sculpture, wallpaper. The prominent colors used in the PowerPoint template are Green, Gray, White.

PowerPoint Design Slides Executive Success Seesaw Charts Currency Ppt Ppt Slide
PowerPoint Design Slides Executive Success Seesaw Charts Currency PPT PPT Slide-These high quality powerpoint pre-designed slides and powerpoint templates have been carefully created by our professional team to help you impress your audience. All slides have been created and are 100% editable in powerpoint. Each and every property of any graphic - color, size, orientation, shading, outline etc. can be modified to help you build an effective powerpoint presentation. Any text can be entered at any point in the powerpoint template or slide. Simply DOWNLOAD, TYPE and PRESENT!

Organization Chart And Corporate Model Transformation Mitigation Plan Checklist Actions Structure PDF
This slide covers organization people readiness based on business unit or product group actions and training. It also, covers action required, when required and action completion status. This is a organization chart and corporate model transformation mitigation plan checklist actions structure pdf template with various stages. Focus and dispense information on two stages using this creative set, that comes with editable features. It contains large content boxes to add your information on topics like business unit or product group actions, training. You can also showcase facts, figures, and other relevant content using this PPT layout. Grab it now.

Organization Chart And Corporate Model Transformation Mitigation Plan Checklist Structure PDF
This slide covers organization systems readiness based on information, communication technology, content and business application. It also covers action required, when required and action completion status. Presenting organization chart and corporate model transformation mitigation plan checklist structure pdf to provide visual cues and insights. Share and navigate important information on three stages that need your due attention. This template can be used to pitch topics like information and communications technology ict, content, business application. In addtion, this PPT design contains high resolution images, graphics, etc, that are easily editable and available for immediate download.

Stakeholders Participation Project Development Process Stakeholders Risk And Engagement Level Matrix Clipart PDF
This slide covers the stakeholders level of risk, influence and interest in project with requirement in project initiation, planning, execution, control and closing phases also the level of engagement. Deliver and pitch your topic in the best possible manner with this stakeholders participation project development process stakeholders risk and engagement level matrix clipart pdf. Use them to share invaluable insights on stakeholders risk and engagement level matrix, influence, project level, project phases, planning, engagement level and impress your audience. This template can be altered and modified as per your expectations. So, grab it now.
