AI PPT Maker
Templates
PPT Bundles
Design Services
Business PPTs
Business Plan
Management
Strategy
Introduction PPT
Roadmap
Self Introduction
Timelines
Process
Marketing
Agenda
Technology
Medical
Startup Business Plan
Cyber Security
Dashboards
SWOT
Proposals
Education
Pitch Deck
Digital Marketing
KPIs
Project Management
Product Management
Artificial Intelligence
Target Market
Communication
Supply Chain
Google Slides
Research Services
 One Pagers
All Categories
-
Home
- Customer Favorites
- Wheel Diagram
Wheel Diagram

3 Arrows In A Sphere Diagram For Revenue Cycle Profitability Analysis Ppt PowerPoint Presentation Gallery Visual Aids PDF
Presenting 3 arrows in a sphere diagram for revenue cycle profitability analysis ppt powerpoint presentation gallery visual aids pdf to dispense important information. This template comprises three stages. It also presents valuable insights into the topics including 3 arrows in a sphere diagram for revenue cycle profitability analysis. This is a completely customizable PowerPoint theme that can be put to use immediately. So, download it and address the topic impactfully.

Proven Ways Of Quickly Growing A Small Business Circular Diagram Ppt PowerPoint Presentation Infographic Template Background Designs PDF
Presenting proven ways of quickly growing a small business circular diagram ppt powerpoint presentation infographic template background designs pdf to provide visual cues and insights. Share and navigate important information on six stages that need your due attention. This template can be used to pitch topics like circular diagram. In addition, this PPT design contains high-resolution images, graphics, etc, that are easily editable and available for immediate download.
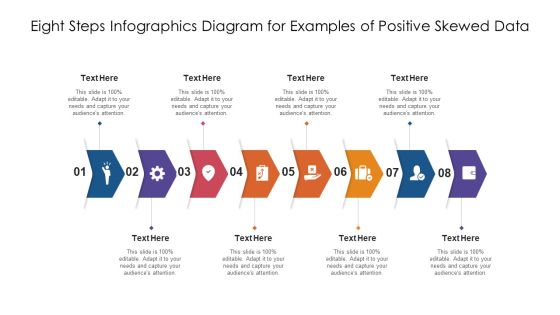
Eight Steps Infographics Diagram For Examples Of Positive Skewed Data Ppt PowerPoint Presentation Gallery Format Ideas PDF
Persuade your audience using this eight steps infographics diagram for examples of positive skewed data ppt powerpoint presentation gallery format ideas pdf. This PPT design covers eight stages, thus making it a great tool to use. It also caters to a variety of topics including eight steps infographics diagram for examples of positive skewed data. Download this PPT design now to present a convincing pitch that not only emphasizes the topic but also showcases your presentation skills.
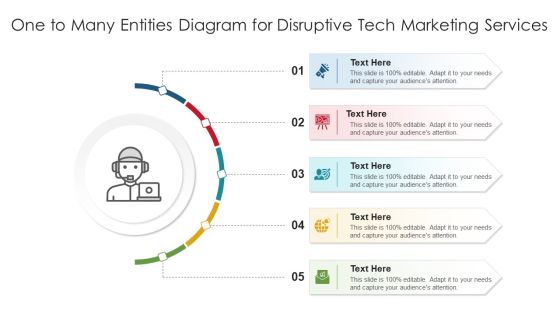
One To Many Entities Diagram For Disruptive Tech Marketing Services Ppt PowerPoint Presentation Gallery Slide Download PDF
Persuade your audience using this one to many entities diagram for disruptive tech marketing services ppt powerpoint presentation gallery slide download pdf. This PPT design covers five stages, thus making it a great tool to use. It also caters to a variety of topics including one to many entities diagram for disruptive tech marketing services. Download this PPT design now to present a convincing pitch that not only emphasizes the topic but also showcases your presentation skills.
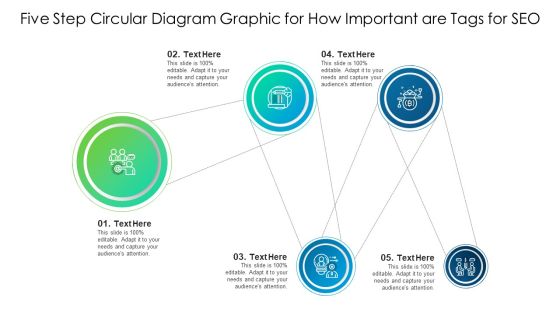
Five Step Circular Diagram Graphic For How Important Are Tags For Seo Ppt PowerPoint Presentation Slides Samples PDF
Persuade your audience using this five step circular diagram graphic for how important are tags for seo ppt powerpoint presentation slides samples pdf. This PPT design covers five stages, thus making it a great tool to use. It also caters to a variety of topics including five step circular diagram graphic for how important are tags for seo. Download this PPT design now to present a convincing pitch that not only emphasizes the topic but also showcases your presentation skills.

7 Steps Infographic Diagram For Stock Trading Technical Analysis Ppt PowerPoint Presentation Infographic Template Slide Portrait PDF
Persuade your audience using this 7 steps infographic diagram for stock trading technical analysis ppt powerpoint presentation infographic template slide portrait pdf. This PPT design covers seven stages, thus making it a great tool to use. It also caters to a variety of topics including 7 steps infographic diagram for stock trading technical analysis. Download this PPT design now to present a convincing pitch that not only emphasizes the topic but also showcases your presentation skills.

7 Piece Round Diagram Slide For Copyright Law And The Internet Ppt PowerPoint Presentation Icon Infographic Template PDF
Persuade your audience using this 7 piece round diagram slide for copyright law and the internet ppt powerpoint presentation icon infographic template pdf. This PPT design covers seven stages, thus making it a great tool to use. It also caters to a variety of topics including 7 piece round diagram slide for copyright law and the internet. Download this PPT design now to present a convincing pitch that not only emphasizes the topic but also showcases your presentation skills.
Q And A Diagram For Difference Between Correlation And Causation In Statistics Ppt PowerPoint Presentation Gallery Sample PDF
Presenting q and a diagram for difference between correlation and causation in statistics ppt powerpoint presentation gallery sample pdf to dispense important information. This template comprises two stages. It also presents valuable insights into the topics including q and a diagram for difference between correlation and causation in statistics. This is a completely customizable PowerPoint theme that can be put to use immediately. So, download it and address the topic impactfully.

Fishbone Ishikawa Cause And Effect Analysis Why Use Cause And Effect Diagram Ppt PowerPoint Presentation Gallery Background PDF
Presenting this set of slides with name fishbone ishikawa cause and effect analysis why use cause and effect diagram ppt powerpoint presentation gallery background pdf. This is a six stage process. The stages in this process are facilitates system thinking, visual linkages, communicate. This is a completely editable PowerPoint presentation and is available for immediate download. Download now and impress your audience.
Printable Rent Receipt Template 30 60 90 Days Plan For Rental Receipt Ppt PowerPoint Presentation Diagram Templates PDF
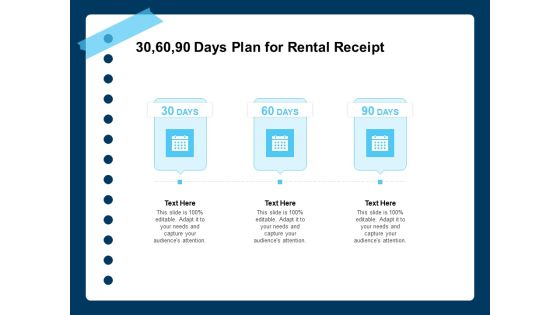
Presenting this set of slides with name printable rent receipt template 30 60 90 days plan for rental receipt ppt powerpoint presentation diagram templates pdf. This is a three stage process. The stages in this process are 30 60 90 days plan. This is a completely editable PowerPoint presentation and is available for immediate download. Download now and impress your audience.

Fishbone Ishikawa Cause And Effect Analysis What Is A Cause And Effect Diagram Ppt PowerPoint Presentation Ideas Portfolio PDF
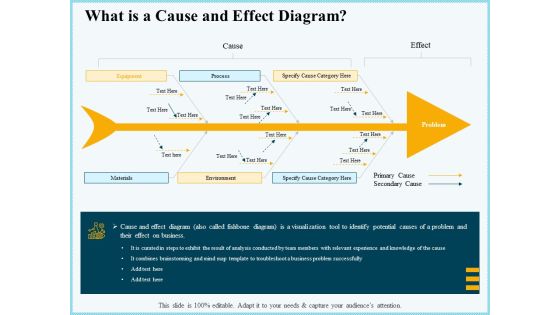
Presenting this set of slides with name fishbone ishikawa cause and effect analysis what is a cause and effect diagram ppt powerpoint presentation ideas portfolio pdf. This is a one stage process. The stages in this process are equipment, process, specify cause category here, materials, environment, specify cause category . This is a completely editable PowerPoint presentation and is available for immediate download. Download now and impress your audience.
Vicious Circle Effect On Quality Assurance What Is A Cause And Effect Diagram Ppt Infographics Deck PDF
Presenting vicious circle effect on quality assurance what is a cause and effect diagram ppt infographics deck pdf to provide visual cues and insights. Share and navigate important information on two stages that need your due attention. This template can be used to pitch topics like equipment, process, specify cause category here, materials, environment, primary cause, secondary cause, problem. In addtion, this PPT design contains high-resolution images, graphics, etc, that are easily editable and available for immediate download.
Marketing Initiatives For Tech Firms Across Different Segments Managed Service Provider MSP Ppt PowerPoint Presentation Diagram Images PDF
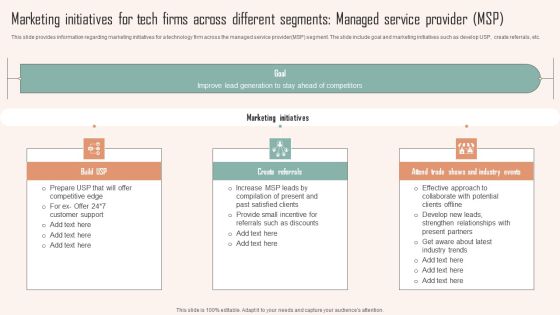
This slide provides information regarding marketing initiatives for a technology firm across the managed service providerMSP segment. The slide include goal and marketing initiatives such as develop USP, create referrals, etc. Do you know about Slidesgeeks Marketing Initiatives For Tech Firms Across Different Segments Managed Service Provider MSP Ppt PowerPoint Presentation Diagram Images PDF. These are perfect for delivering any kind od presentation. Using it, create PowerPoint presentations that communicate your ideas and engage audiences. Save time and effort by using our pre designed presentation templates that are perfect for a wide range of topic. Our vast selection of designs covers a range of styles, from creative to business, and are all highly customizable and easy to edit. Download as a PowerPoint template or use them as Google Slides themes.
Growth Score File Decline Presentation Diagrams
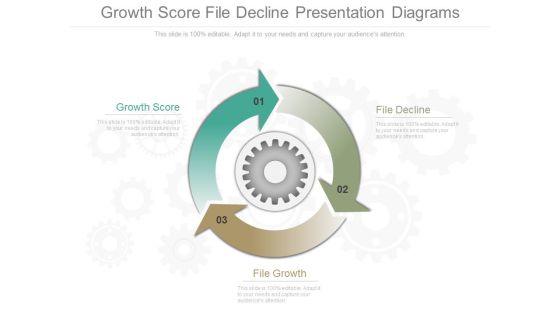
This is a growth score file decline presentation diagrams. This is a three stage process. The stages in this process are growth score, file decline, file growth.

Continuous Improvement Dashboard Ppt Presentation Diagrams
This is a continuous improvement dashboard ppt presentation diagrams. This is a five stage process. The stages in this process are benchmarking, input, process, output, pdsa, plan, do, study, act.

IT Infrastructure Management Diagrams PDF
This slide covers the store category wherein focus will be on performance, availability, service level compliance and event data.Presenting IT Infrastructure Management Diagrams PDF to provide visual cues and insights. Share and navigate important information on four stages that need your due attention. This template can be used to pitch topics like Performance, Level Compliance, Availability Response. In addtion, this PPT design contains high resolution images, graphics, etc, that are easily editable and available for immediate download.
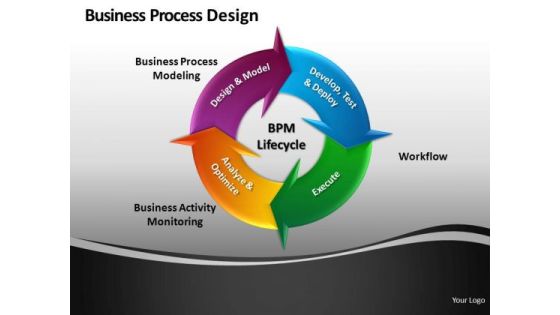
Cycle Chart Diagrams For PowerPoint
Cycle Chart Diagrams for PowerPointThese high quality powerpoint pre-designed slides and powerpoint templates have been carefully created by our professional team to help you impress your audience. All slides have been created and are 100% editable in powerpoint. Each and every property of any graphic - color, size, orientation, shading, outline etc. can be modified to help you build an effective powerpoint presentation. Any text can be entered at any point in the powerpoint template or slide. Simply DOWNLOAD, TYPE and PRESENT!
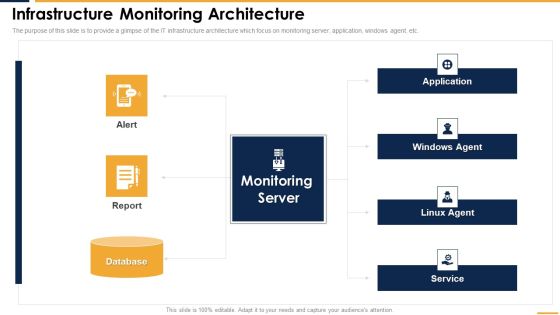
Infrastructure Monitoring Architecture Diagrams PDF
The purpose of this slide is to provide a glimpse of the IT infrastructure architecture which focus on monitoring server, application, windows agent, etc. Want to ace your presentation in front of a live audience Our Infrastructure Monitoring Architecture Diagrams PDF can help you do that by engaging all the users towards you. Slidegeeks experts have put their efforts and expertise into creating these impeccable powerpoint presentations so that you can communicate your ideas clearly. Moreover, all the templates are customizable, and easy to edit and downloadable. Use these for both personal and commercial use.
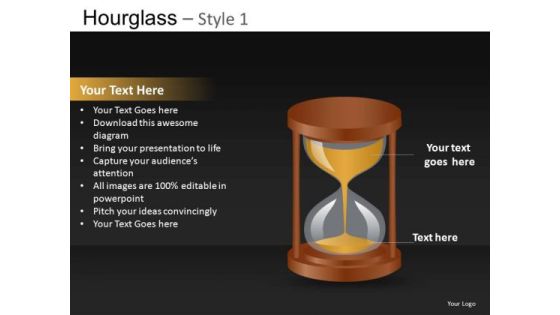
Hourglass Time Concept PowerPoint Diagrams
Hourglass Time Concept PowerPoint Diagrams-These high quality powerpoint pre-designed slides and powerpoint templates have been carefully created by our professional team to help you impress your audience. All slides have been created and are 100% editable in powerpoint. Each and every property of any graphic - color, size, orientation, shading, outline etc. can be modified to help you build an effective powerpoint presentation. Any text can be entered at any point in the powerpoint template or slide. Simply DOWNLOAD, TYPE and PRESENT! These PowerPoint presentation slides can be used to represent themes relating to -Age, antique, bulb, clock, countdown, equipment, falling, flow, flowing, glass, hand, history, hour, hour glass, hour-glass, hourglass, ideas, instrument, instrument of time, isolated, measurement, minute, object, old, old-fashioned, passing, past, pour, process, reflection, retro, retro-styled, revival, sand, sand glass, sand timer, sand-glass, sandglass, stopwatch, time, timer, vector, vertical, vintage, watch, watch glass, watch-glass, wooden-Hourglass Time Concept PowerPoint Diagrams

Business Process Engineering Presentation Diagrams
This is a business process engineering presentation diagrams. This is a four stage process. The stages in this process are jobs and structure, process, values and benefits, measurement.

Process Capability Index Ppt Diagrams
This is a process capability index ppt diagrams. This is a nine stage process. The stages in this process are lsl, target, usl, category.
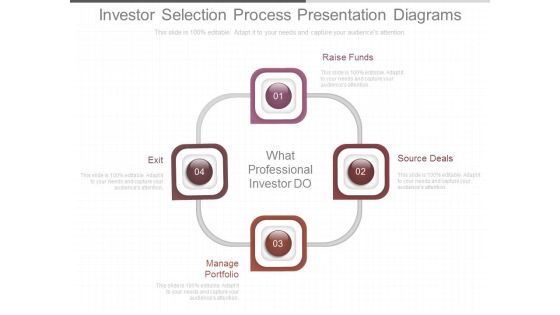
Investor Selection Process Presentation Diagrams
This is a investor selection process presentation diagrams. This is a four stage process. The stages in this process are what professional investor do, raise funds, source deals, manage portfolio, exit.
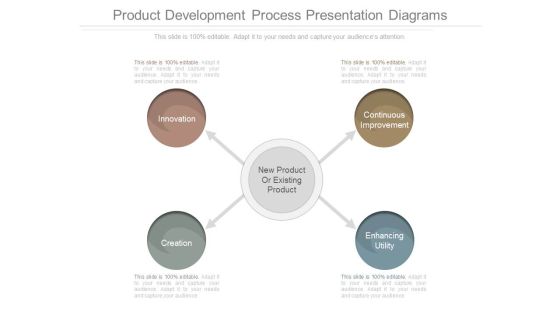
Product Development Process Presentation Diagrams
This is a product development process presentation diagrams. This is a four stage process. The stages in this process are new product or existing product, innovation, creation, continuous improvement, enhancing utility.
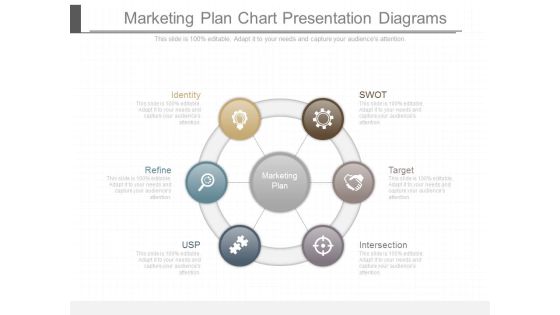
Marketing Plan Chart Presentation Diagrams
This is a marketing plan chart presentation diagrams. This is a six stage process. The stages in this process are identity, refine, usp, swot, target, intersection.

Circular Ppt PowerPoint Presentation Diagrams
This is a circular ppt powerpoint presentation diagrams. This is a six stage process. The stages in this process are business, process, management, marketing, strategy, success.
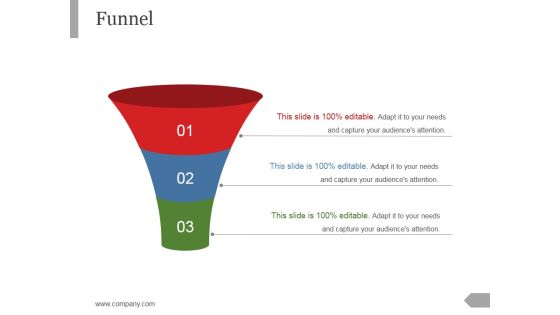
Funnel Ppt PowerPoint Presentation Diagrams
This is a funnel ppt powerpoint presentation diagrams. This is a three stage process. The stages in this process are business, marketing, management, process, planning.
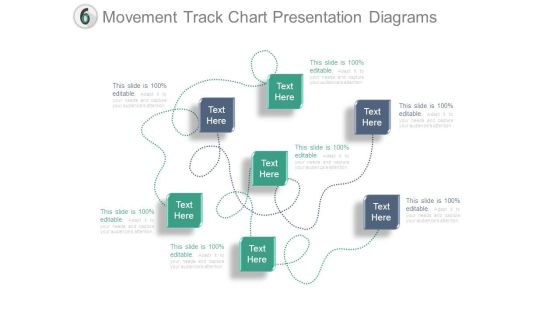
Movement Track Chart Presentation Diagrams
This is a movement track chart presentation diagrams. This is a seven stage process. The stages in this process are presentation, marketing, strategy, management.

Integrated Business Planning Ppt Diagrams
This is a integrated business planning ppt diagrams. This is a eight stage process. The stages in this process are strategic planning, program planning, facility planning, technology planning, integrated business planning, businesses processes, business policy, advancement planning, human resource planning.

Strategic Alliances Benefits Ppt Diagrams
This is a strategic alliances benefits ppt diagrams. This is a six stage process. The stages in this process are improve customer focus, teamwork, passion for excellence, trust, respect, maintain leadership.

Crm Client Fulfilment Ppt Diagrams
This is a crm client fulfilment ppt diagrams. This is a four stage process. The stages in this process are satisfy unstated, customer needs, achieve customer delight, meet basic customer requirements.
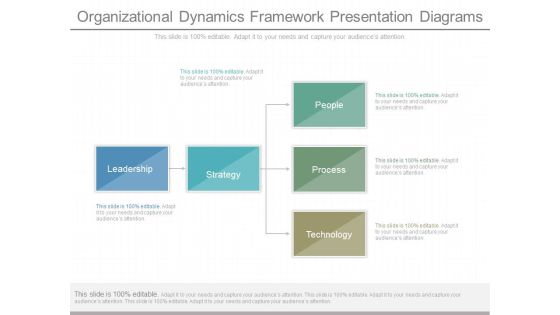
Organizational Dynamics Framework Presentation Diagrams
This is a organizational dynamics framework presentation diagrams. This is a five stage process. The stages in this process are leadership, people, process, technology, strategy.
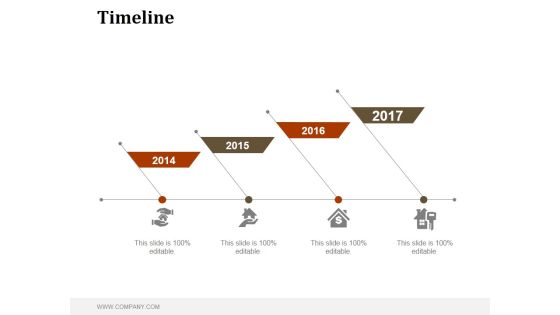
Timeline Ppt PowerPoint Presentation Diagrams
This is a timeline ppt powerpoint presentation diagrams. This is a four stage process. The stages in this process are business, marketing, timeline, planning, process.
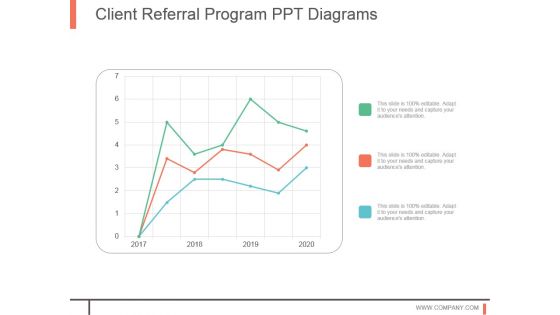
Client Referral Program Ppt Diagrams
This is a client referral program ppt diagrams. This is a three stage process. The stages in this process are business, strategy, line graph, chart and graph, marketing.

Business Accounting Methodology Presentation Diagrams
This is a business accounting methodology presentation diagrams. This is a five stage process. The stages in this process are analysis, deployment, diagnostic, design, operation.

Team Building Exercise Ppt Diagrams
This is a team building exercise ppt diagrams. This is a four stage process. The stages in this process are planning, adaptability, organic keywords, communication.
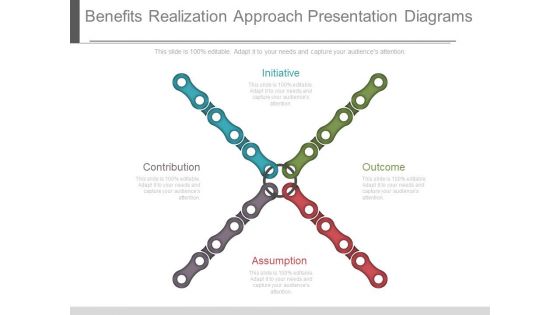
Benefits Realization Approach Presentation Diagrams
This is a benefits realization approach presentation diagrams. This is a four stage process. The stages in this process are initiative, contribution, assumption, outcome.

Grow Concepts Model Presentation Diagrams
This is a grow concepts model presentation diagrams. This is a four stage process. The stages in this process are goal, reality, obstacles options, way forward.
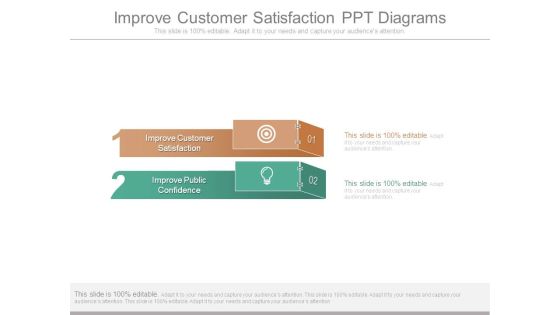
Improve Customer Satisfaction Ppt Diagrams
This is a improve customer satisfaction ppt diagrams. This is a two stage process. The stages in this process are improve customer satisfaction, improve public confidence.
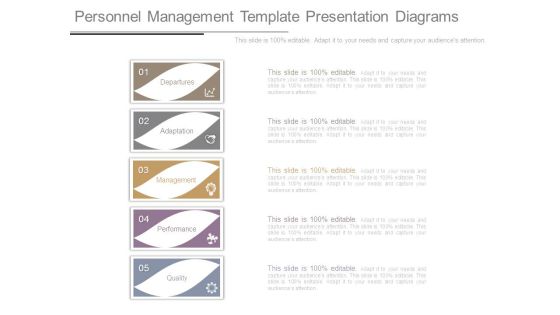
Personnel Management Template Presentation Diagrams
This is a personnel management template presentation diagrams. This is a five stage process. The stages in this process are departures, adaptation, management, performance, quality.

Brainwriting With Table Presentation Diagrams
This is a brainwriting with table presentation diagrams. This is a four stage process. The stages in this process are participants, idea.

Possible Target Audiences Ppt Diagrams
This is a possible target audiences ppt diagrams. This is a seven stage process. The stages in this process are growth, business, marketing, percentage.
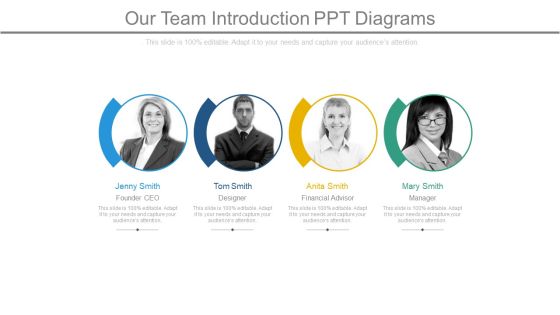
Our Team Introduction Ppt Diagrams
This is a our team introduction ppt diagrams. This is a four stage process. The stages in this process are founder ceo, designer, financial advisor, manager.

Product Information Management Ppt Diagrams
This is a product information management ppt diagrams. This is a one stage process. The stages in this process are management, success, strategy, marketing, business.
Risk Management Plan Ppt Diagrams
This is a risk management plan ppt diagrams. This is a two stage process. The stages in this process are risk, strategies.

Our Corporate Leaders Ppt Diagrams
This is a our corporate leaders ppt diagrams. This is a four stage process. The stages in this process are amanda clark, john carter, elisabeth finder, jessica parker.
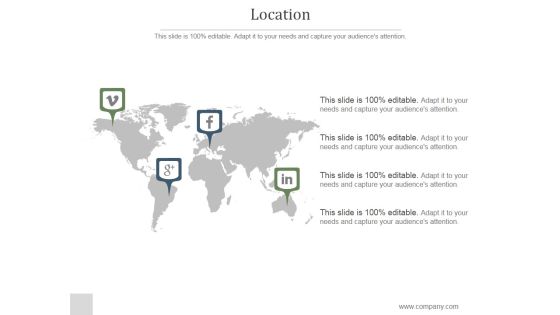
Location Ppt PowerPoint Presentation Diagrams
This is a location ppt powerpoint presentation diagrams. This is a four stage process. The stages in this process are globe, pointers, management, business, management.

Lego Ppt PowerPoint Presentation Diagrams
This is a lego ppt powerpoint presentation diagrams. This is a three stage process. The stages in this process are lego, marketing, strategy, management, business, analysis.
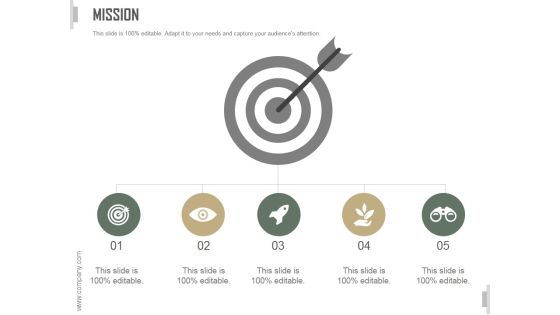
Mission Ppt PowerPoint Presentation Diagrams
This is a mission ppt powerpoint presentation diagrams. This is a five stage process. The stages in this process are business, strategy, marketing, analysis, target, our vision, mission.
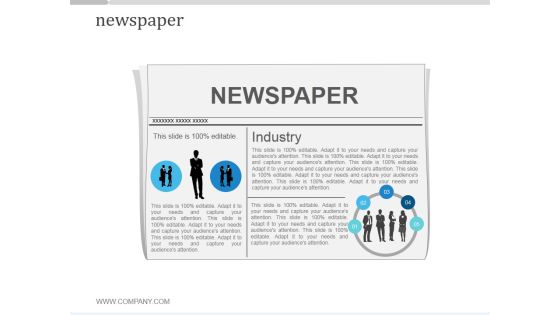
Newspaper Ppt PowerPoint Presentation Diagrams
This is a newspaper ppt powerpoint presentation diagrams. This is a one stage process. The stages in this process are newspaper, industry, information, success, marketing.

Hierarchy Ppt PowerPoint Presentation Diagrams
This is a hierarchy ppt powerpoint presentation diagrams. This is a three stage process. The stages in this process are business, marketing, management, strategy, planning.

Financials Ppt PowerPoint Presentation Diagrams
This is a financials ppt powerpoint presentation diagrams. This is a three stage process. The stages in this process are business, finance, marketing, strategy, investment, success.

Dashboard Ppt PowerPoint Presentation Diagrams
This is a dashboard ppt powerpoint presentation diagrams. This is a four stage process. The stages in this process are performance, energy, speed.

Agenda Ppt PowerPoint Presentation Diagrams
This is a agenda ppt powerpoint presentation diagrams. This is a six stage process. The stages in this process are business, strategy, marketing, analysis, success, agenda.

Target Ppt PowerPoint Presentation Diagrams
This is a target ppt powerpoint presentation diagrams. This is a four stage process. The stages in this process are target, arrow, growth, strategy, marketing, business.
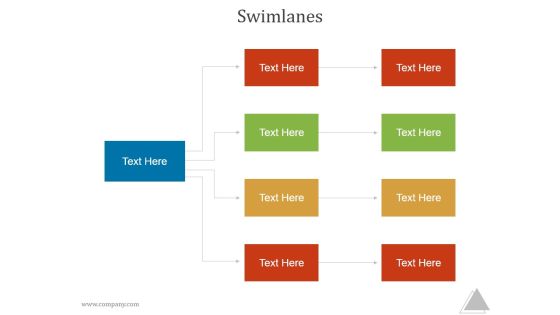
Swimlanes Ppt PowerPoint Presentation Diagrams
This is a swimlanes ppt powerpoint presentation diagrams. This is a three stage process. The stages in this process are business, marketing, management.
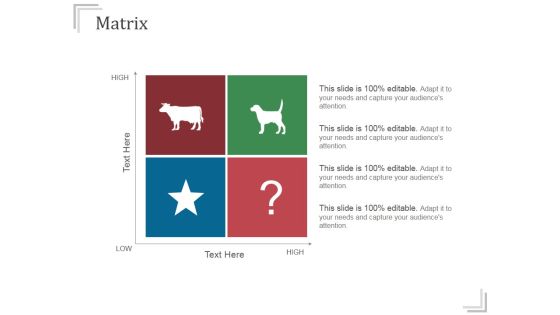
Matrix Ppt PowerPoint Presentation Diagrams
This is a matrix ppt powerpoint presentation diagrams. This is a four stage process. The stages in this process are high, low, matrix, management, business.
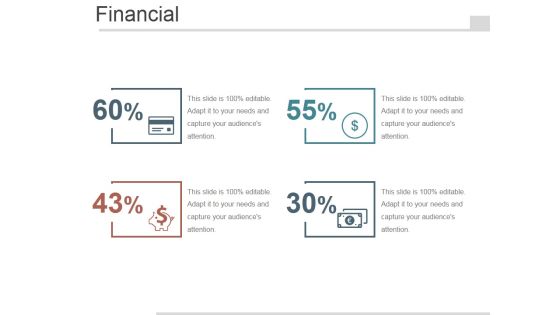
Financial Ppt PowerPoint Presentation Diagrams
This is a financial ppt powerpoint presentation diagrams. This is a four stage process. The stages in this process are finance, business, marketing, business.

Donut Ppt PowerPoint Presentation Diagrams
This is a donut ppt powerpoint presentation diagrams. This is a six stage process. The stages in this process are donut, percentage, analysis, marketing, strategy, business.
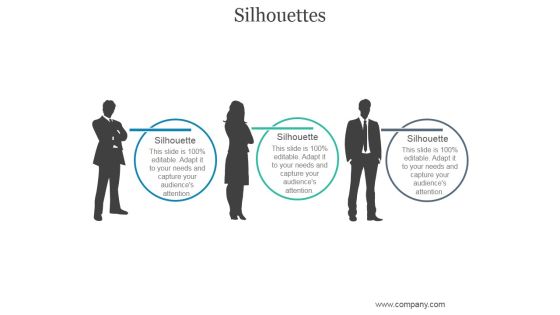
Silhouettes Ppt PowerPoint Presentation Diagrams
This is a silhouettes ppt powerpoint presentation diagrams. This is a three stage process. The stages in this process are silhouette, business, communication, marketing, success.

Comparison Ppt PowerPoint Presentation Diagrams
This is a comparison ppt powerpoint presentation diagrams. This is a two stage process. The stages in this process are finance, business, marketing, compare.
