AI PPT Maker
Templates
PPT Bundles
Design Services
Business PPTs
Business Plan
Management
Strategy
Introduction PPT
Roadmap
Self Introduction
Timelines
Process
Marketing
Agenda
Technology
Medical
Startup Business Plan
Cyber Security
Dashboards
SWOT
Proposals
Education
Pitch Deck
Digital Marketing
KPIs
Project Management
Product Management
Artificial Intelligence
Target Market
Communication
Supply Chain
Google Slides
Research Services
 One Pagers
All Categories
-
Home
- Customer Favorites
- Wheel Diagram
Wheel Diagram

5 Step Circular Diagram For Business Development Planning Ppt PowerPoint Presentation Styles
This is a 5 step circular diagram for business development planning ppt powerpoint presentation styles. This is a five stage process. The stages in this process are business, marketing, process, planning, icons.

Six Part Circular Diagram For Marketing Channels Ppt PowerPoint Presentation Picture
This is a six part circular diagram for marketing channels ppt powerpoint presentation picture. This is a six stage process. The stages in this process are business, marketing, icons, social, circular.

Ppt Connections Travel Text Circles 7 Steps Working With Slide Numbers Diagram PowerPoint Templates
PPT connections travel text circles 7 steps working with slide numbers diagram PowerPoint Templates-This Business Oriented Chart will definitely help you to be more Successful. Use this graphics as key element in streamlining your plans. It consists of Circular Bubbles connected together to form a complete process. This diagram is suitable for business and technical professionals who need to quickly and easily visualize, explore, and communicate information. -PPT connections travel text circles 7 steps working with slide numbers diagram PowerPoint Templates-Add, Aqua, Arrows, Badges, Bar, Blend, Blue, Bright, Bubbles, Buttons, Caution, Circle, Drop, Elements, Glossy, Glowing, Graphic, Heart, Help, Icons, Idea, Illustration, Navigation, Oblong, Plus, Round, Service, Shadow, Shiny, Sign, Speech, Squares
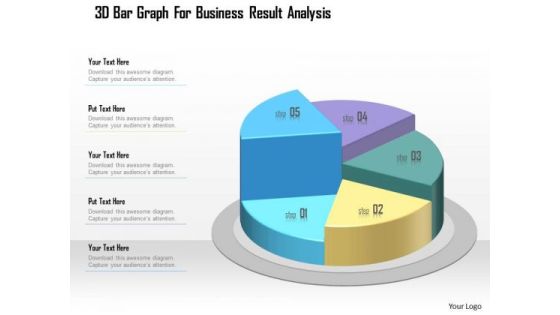
Business Diagram 3d Bar Graph For Business Result Analysis Presentation Template
This business slide displays five staged pie chart. This diagram is a data visualization tool that gives you a simple way to present statistical information. This slide helps your audience examine and interpret the data you present.

Competitive Analysis Steve Blanks Petal Diagram On Competitive Landscape Ppt PowerPoint Presentation Slides Sample
This is a competitive analysis steve blanks petal diagram on competitive landscape ppt powerpoint presentation slides sample. This is a five stage process. The stages in this process are business, marketing, process, circular, success.
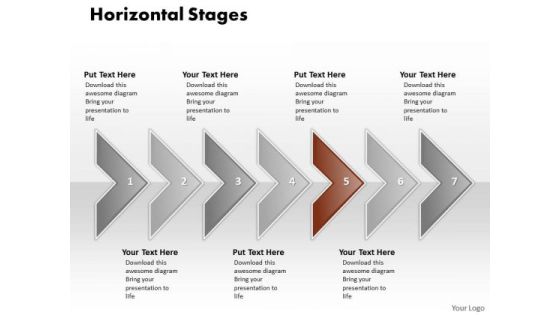
Ppt Correlated Arrows In Horizontal Create PowerPoint Macro 7 State Diagram Templates
PPT correlated arrows in horizontal create powerpoint macro 7 state diagram Templates-This Diagram is used to illustrate how information will move between interrelated systems in the accomplishment of a given function, task or process. The visual description of this information flow with each given level showing how data is fed into a given process step and subsequently passed along at the completion of that step.-PPT correlated arrows in horizontal create powerpoint macro 7 state diagram Templates-Aim, Arrow, Badge, Border, Color, Connection, Curve, Design, Direction, Download, Icon, Illustration, Indicator, Internet, Label, Link, Magenta, Mark, Next, Object, Orientation, Paper, Peeling, Pointer, Rounded, Set, Shadow, Shape, Sign
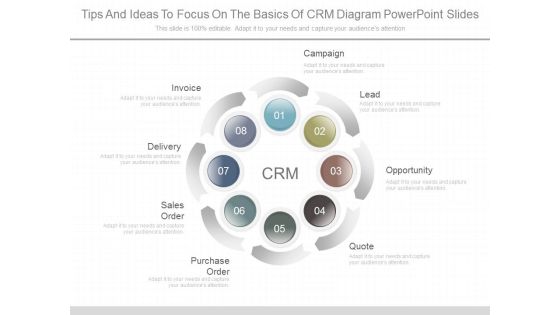
Tips And Ideas To Focus On The Basics Of Crm Diagram Powerpoint Slides
This is a tips and ideas to focus on the basics of crm diagram powerpoint slides. This is a eight stage process. The stages in this process are invoice, delivery, sales order, purchase order, campaign, lead, opportunity, quote.
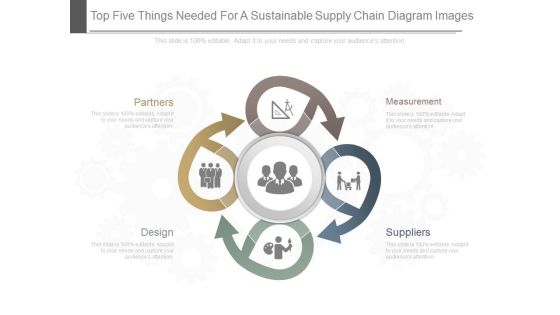
Top Five Things Needed For A Sustainable Supply Chain Diagram Images
This is a top five things needed for a sustainable supply chain diagram images. This is a four stage process. The stages in this process are partners, measurement, design, suppliers.

Sample Of Three Types Of Internet Of Things Diagram Ppt Slides
This is a sample of three types of internet of things diagram ppt slides. This is a three stage process. The stages in this process are things with networked sensors, analytic engines, data storage.
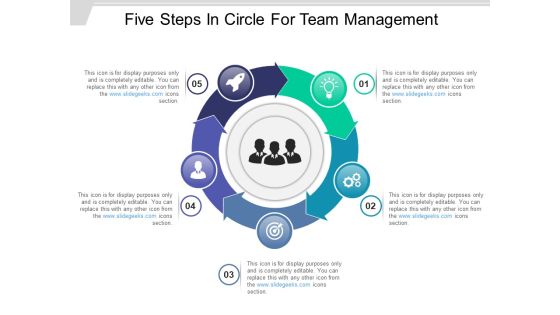
Five Steps In Circle For Team Management Ppt PowerPoint Presentation Diagram Templates
This is a five steps in circle for team management ppt powerpoint presentation diagram templates. This is a five stage process. The stages in this process are 5 stages circular arrows, 5 steps circle arrows, 5 stages cycle arrows.

Self Improvement Strategies Channel Partner Strategy Transition Plans Ppt PowerPoint Presentation Diagram Lists
This is a self improvement strategies channel partner strategy transition plans ppt powerpoint presentation diagram lists. This is a five stage process. The stages in this process are self improvement strategies, channel partner strategy, transition plans.
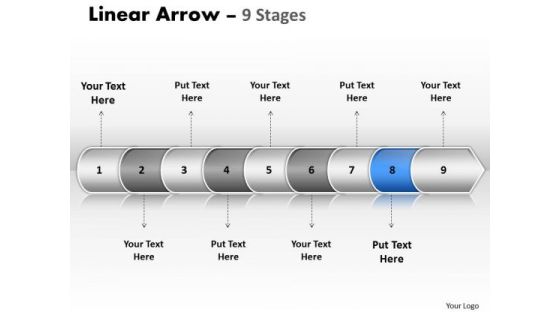
Sales Ppt Background Linear Arrow 9 Phase Diagram Business Plan PowerPoint Image
We present our sales PPT Background linear arrow 9 phase diagram business plan PowerPoint Image. Use our Arrows PowerPoint Templates because, getting it done in time is the key to success. Use our Business PowerPoint Templates because Use them to help you organize the logic of your views. Use our Marketing PowerPoint Templates because, Amplify on your plans to have dedicated sub groups working on related butdistinct tasks. Use our Technology PowerPoint Templates because, The color coding of our templates are specifically designed to highlight you points. Use our Process and flows PowerPoint Templates because, Bullet-point your thoughts and ideas to profitably accomplish every step of every stage along the way. Use these PowerPoint slides for presentations relating to Algorithm, arrow, arrow chart, business, chart, color, connection, development, diagram, direction, flow chart, flow diagram, flowchart, kind of diagram, linear, linear diagram, management, motion, organization, plan, process, process arrows, process chart, process diagram, process flow, program, sign, solution, strategy, symbol, technology. The prominent colors used in the PowerPoint template are Blue, Gray, and White
PowerPoint Template Two Phase Diagram Ppt Linear Organization Strategy 2 Graphic
We present our PowerPoint template two phase diagram ppt linear organization strategy 2 Graphic. Use our Business PowerPoint Templates because, Start with the fundamental basic activities and slowly but surely hone them down to the top of the pyramid, the ultimate goal. Use our Shapes PowerPoint Templates because; educate your team and the attention you have paid. Use our Design PowerPoint Templates because; Use our appropriate templates to get them across to your target audience. Use our Signs PowerPoint Templates because; now put it up there for all to see. Use our Process and Flows PowerPoint Templates because; anoint it with your really bright ideas. Use these PowerPoint slides for presentations relating to Arrow, Arrow, Chart, Block, Diagram, Business, Chart, Design, Development, Diagram, Direction, Element, Flow, Flow, Chart, Flow, Diagram, Flowchart, Graph, Linear, Linear, Diagram, Management, Organization, Process, Process, Arrows, Process, Chart, Process, Diagram, Process, Flow, Program, Section, Sign, Solution, Symbol. The prominent colors used in the PowerPoint template are Green, Gray, and Black
PowerPoint Template Two Phase Diagram Ppt Linear Organization Strategy 3 Graphic
We present our PowerPoint template two phase diagram ppt linear organization strategy 3 Graphic. Use our Business PowerPoint Templates because; Reaffirm to your team your faith in maintaining the highest ethical standards. Use our Shapes PowerPoint Templates because, it is in your DNA to analyses possible causes to the minutest detail. Use our Design PowerPoint Templates because, Our Template designs are State of the Art. Use our Signs PowerPoint Templates because, the pyramid is a symbol of the desire to reach the top in a steady manner. Use our Process and Flows PowerPoint Templates because, discuss each one and slowly but surely move up the pyramid narrowing down to the best and most success oriented project. Use these PowerPoint slides for presentations relating to Arrow, Arrow, Chart, Block, Diagram, Business, Chart, Design, Development, Diagram, Direction, Element, Flow, Flow, Chart, Flow, Diagram, Flowchart, Graph, Linear, Linear, Diagram, Management, Organization, Process, Process, Arrows, Process, Chart, Process, Diagram, Process, Flow, Program, Section, Sign, Solution, Symbol. The prominent colors used in the PowerPoint template are Yellow, Gray, and Black

Usa Ppt Background Linear Arrow 10 State PowerPoint Project Diagram 6 Image
USA PPT Background linear arrow 10 state powerpoint project diagram 6 Image-Use this diagram to display your ideas and highlight their ability to accelerate the growth of your company and you. Impress upon the audience how your strategy will carry all to the top of the corporate heap.-USA PPT Background linear arrow 10 state powerpoint project diagram 6 Image-Arrow, Background, Collection, Completed, Concept, Confirmation, Design, Flow, Graph, Graphic, Illustration, Indication, Indicator, Information, Instruction, Interface, Internet, Layout, Measurement, Order, Phase, Pointer, Process, Progress, Reflection, Scale, Shape, Sign
Strategies For Improving Corporate Culture Linear Diagram Ppt Icon Objects PDF
This is a strategies for improving corporate culture linear diagram ppt icon objects pdf template with various stages. Focus and dispense information on seven stages using this creative set, that comes with editable features. It contains large content boxes to add your information on topics like linear diagram. You can also showcase facts, figures, and other relevant content using this PPT layout. Grab it now.
Exercise And Workout Equipment Cycle Diagram Ppt PowerPoint Presentation Icon Deck PDF
This is a Exercise And Workout Equipment Cycle Diagram Ppt PowerPoint Presentation Icon Deck PDF template with various stages. Focus and dispense information on four stages using this creative set, that comes with editable features. It contains large content boxes to add your information on topics like Cycle Diagram. You can also showcase facts, figures, and other relevant content using this PPT layout. Grab it now.

Designing Great Client Experience Action Plan Linear Diagram Ppt PowerPoint Presentation File Graphic Images PDF
Presenting designing great client experience action plan linear diagram ppt powerpoint presentation file graphic images pdf to provide visual cues and insights. Share and navigate important information on five stages that need your due attention. This template can be used to pitch topics like linear diagram. In addition, this PPT design contains high-resolution images, graphics, etc, that are easily editable and available for immediate download.

3 Steps Circle Diagram Initiatives To Improve Employee Engagement Structure PDF
Persuade your audience using this 3 steps circle diagram initiatives to improve employee engagement structure pdf. This PPT design covers three stages, thus making it a great tool to use. It also caters to a variety of topics including 3 steps circle diagram initiatives to improve employee engagement. Download this PPT design now to present a convincing pitch that not only emphasizes the topic but also showcases your presentation skills.

3 Steps Circle Diagram Stages Encouraging Engagement At Work To Improve Retention Background PDF
Persuade your audience using this 3 steps circle diagram stages encouraging engagement at work to improve retention background pdf. This PPT design covers three stages, thus making it a great tool to use. It also caters to a variety of topics including 3 steps circle diagram stages encouraging engagement at work to improve retention. Download this PPT design now to present a convincing pitch that not only emphasizes the topic but also showcases your presentation skills.

3 Steps Circle Diagram Visual Average Revenue Per Customer Formats PDF
Persuade your audience using this 3 steps circle diagram visual average revenue per customer formats pdf. This PPT design covers three stages, thus making it a great tool to use. It also caters to a variety of topics including 3 steps circle diagram visual average revenue per customer. Download this PPT design now to present a convincing pitch that not only emphasizes the topic but also showcases your presentation skills.

Three Column Layout Diagram For Faster Payment Not Received Ppt Show Background Images PDF
Persuade your audience using this three column layout diagram for faster payment not received ppt show background images pdf. This PPT design covers three stages, thus making it a great tool to use. It also caters to a variety of topics including three column layout diagram for faster payment not received. Download this PPT design now to present a convincing pitch that not only emphasizes the topic but also showcases your presentation skills.
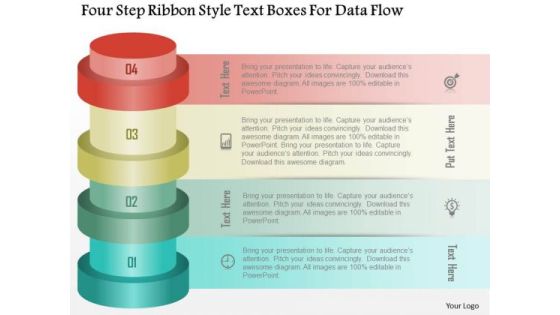
Business Diagram Four Step Ribbon Style Text Boxes For Data Flow PowerPoint Template
Four step ribbon style text boxes are used to craft this power point template. This PPT contains the concept of data flow and representation. Use this PPT diagram for your business and marketing related presentations.
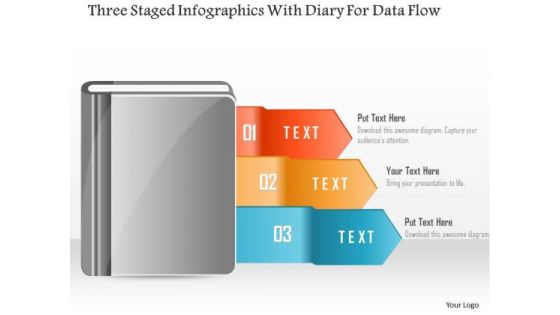
Business Diagram Three Staged Infographics With Diary For Data Flow PowerPoint Template
Three staged info graphic with diary has been used to design this power point template. This PPT contains the concept of data flow. Use this PPT diagram to represent the marketing and business data in any presentation.

Business Diagram Laptop With Multiple Apps For Business Technology Presentation Template
This power point template diagram has been designed with graphic of laptop and multiple apps. This PPT can be used for technology and communication. Use this PPT for business and technology related presentations.

Business Diagram Linear Bar Graph With Apps Made With Pencils Presentation Template
This power point template has been crafted with graphic of linear bar graph and apps made with pencils. This PPT diagram can be used for business growth analysis and result analysis. Use this PPT for business and marketing related presentations.
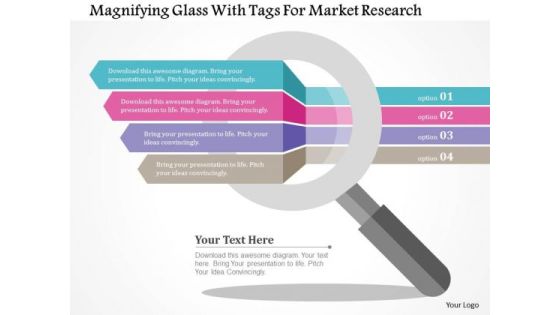
Business Diagram Magnifying Glass With Tags For Market Research Presentation Template
Our above business slide displays magnifying glass over tags. You may use this diagram for presentations on market research. Grab the attention of your listeners with this professional slide.

Concentric Sphere Chart Diagram For Seven Elements Of A Marketing Plan Ppt Styles Display PDF
Persuade your audience using this concentric sphere chart diagram for seven elements of a marketing plan ppt styles display pdf. This PPT design covers seven stages, thus making it a great tool to use. It also caters to a variety of topics including concentric sphere chart diagram for seven elements of a marketing plan. Download this PPT design now to present a convincing pitch that not only emphasizes the topic but also showcases your presentation skills.
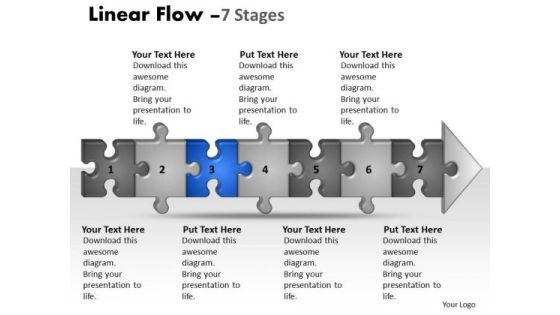
Usa Ppt Linear Flow 7 State Diagram Style1 Business Strategy PowerPoint 4 Design
USA PPT Linear flow 7 state diagram style1 business strategy powerpoint 4 design-The template offers an excellent background to build up the various stages of your business process. Use this template to accomplish every step each stage along the way. Give an overview of your capability and insight into the minute details of the overall picture highlighting the interdependence at every operational level.-USA PPT Linear flow 7 state diagram style1 business strategy powerpoint 4 design-Arrow, Attached, Background, Business, Chain, Chart, Competition, Concepts, Connection, Diagram, Finance, Future, Graph, Growth, Ideas, Improvement, Investment, Isolated, Jigsaw, Making, Market, Money, Order, Partnership, Piece, Planning, Puzzle, Shape

Usa Ppt Template Linear Flow 8 State Diagram Style1 Business Management PowerPoint 5 Image
USA PPT template Linear flow 8 state diagram style1 business management powerpoint 5 Image-This PowerPoint slide can be used to illustrate the logical path or system. A steady and stable organizational structure is what you desire. Explain this step by step process to achieve the aim. Use our creative template to lay down your views.-USA PPT template Linear flow 8 state diagram style1 business management powerpoint 5 Image-Arrow, Attached, Background, Business, Chain, Chart, Competition, Concepts, Connection, Diagram, Finance, Future, Graph, Growth, Ideas, Improvement, Investment, Isolated, Jigsaw, Making, Market, Money, Order, Partnership, Piece, Planning, Puzzle, Shape

Quality Control Plan Sipoc Diagram Along With Constraints Measures Formats PDF
This slide illustrates supplier input process output customer diagram. It also covers information about constraints measures. This Quality Control Plan Sipoc Diagram Along With Constraints Measures Formats PDF is perfect for any presentation, be it in front of clients or colleagues. It is a versatile and stylish solution for organizing your meetings. The Quality Control Plan Sipoc Diagram Along With Constraints Measures Formats PDF features a modern design for your presentation meetings. The adjustable and customizable slides provide unlimited possibilities for acing up your presentation. Slidegeeks has done all the homework before launching the product for you. So, dont wait, grab the presentation templates today.

Risk Based Methodology Cause Effect Diagram Risk Management Tool Brochure PDF
This slide covers quality risk management tool such as Cause or effect diagram. Do you have an important presentation coming up Are you looking for something that will make your presentation stand out from the rest Look no further than Risk Based Methodology Cause Effect Diagram Risk Management Tool Brochure PDF. With our professional designs, you can trust that your presentation will pop and make delivering it a smooth process. And with Slidegeeks, you can trust that your presentation will be unique and memorable. So why wait Grab Risk Based Methodology Cause Effect Diagram Risk Management Tool Brochure PDF today and make your presentation stand out from the rest

Ppt Correlated Circular Arrows In Straight Line 7 State Diagram Cyan PowerPoint Templates
PPT correlated circular arrows in straight line 7 state diagram cyan PowerPoint Templates-You can insert this circular arrow into flow charts or presentations to help clarify information. Horizontal line helps to shows the relationship -PPT correlated circular arrows in straight line 7 state diagram cyan PowerPoint Templates-Communication, Connection, Diversity, Gather, Generalize, Generalizing, Humanness, Information, Interconnected, International, Internet, Large, Linking, Multinational, Nation, Orbit, Orbital, Orientation, Out-Sized, Peddle, Planetary, Rotation, Satellite, Share

Big Data Life Cycle Impacts Circular Diagram Ppt PowerPoint Presentation Introduction
This is a big data life cycle impacts circular diagram ppt powerpoint presentation introduction. This is a six stage process. The stages in this process are sports predictions, easier commutes, smartphones, personalized advertising, presidential campaigns, advanced healthcare.
Four Steps Concentric Circular Diagram With Icons Ppt PowerPoint Presentation File Brochure PDF
Persuade your audience using this four steps concentric circular diagram with icons ppt powerpoint presentation file brochure pdf. This PPT design covers four stages, thus making it a great tool to use. It also caters to a variety of topics including four steps concentric circular diagram with icons. Download this PPT design now to present a convincing pitch that not only emphasizes the topic but also showcases your presentation skills.
Developing New Trade Name Idea Linear Diagram Ppt Icon Graphics Example PDF
This is a developing new trade name idea linear diagram ppt icon graphics example pdf template with various stages. Focus and dispense information on six stages using this creative set, that comes with editable features. It contains large content boxes to add your information on topics like linear diagram. You can also showcase facts, figures, and other relevant content using this PPT layout. Grab it now.

Ppt Linear Arrows Modifying Slide Layouts PowerPoint Three State Diagram Templates
PPT linear arrows modifying slide layouts powerpoint three state diagram Templates-Visually support your ideas and define your message with our above template. This image identifies the concept of stages in process. This attractive image makes your presentations professional and interactive. Deliver amazing presentations to mesmerize your audience.-PPT linear arrows modifying slide layouts powerpoint three state diagram Templates-Aim, Arrow, Arrowheads, Badge, Border, Click, Connection, Curve, Design, Direction, Download, Element, Fuchsia, Icon, Illustration, Indicator, Internet, Magenta, Mark, Object, Orientation, Pointer, Shadow, Shape, Sign
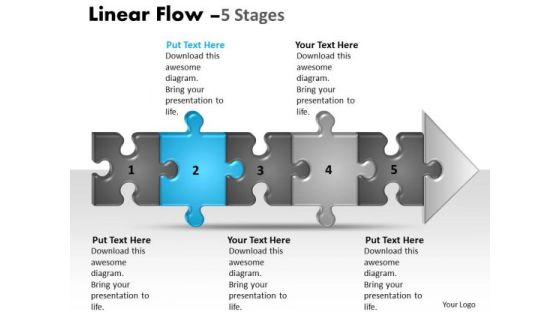
Sales Ppt Theme Linear Flow 5 State Diagram Style1 Business Management PowerPoint 3 Image
We present our sales PPT Theme linear flow 5 state diagram style1 business management Powerpoint 3 Image. Use our Arrows PowerPoint Templates because, Tachometer: - You have a good idea of the roadmap to your desired destination. Use our Business PowerPoint Templates because, Now use this slide to bullet point your views. Use our Puzzles or jigsaws PowerPoint Templates because, you have the right arrows in your quiver. Use our Technology PowerPoint Templates because, Saves your time a prized possession, an ideal aid to give an ideal presentation. Use our Process and flows PowerPoint Templates because, Gauranteed to focus the minds of your team. Use these PowerPoint slides for presentations relating to Algorithm, arrow, arrow chart, business, chart, color, connection, development, diagram, direction, flow chart, flow diagram, flowchart, kind of diagram, linear, linear diagram, management, motion, organization, plan, process, process arrows, process chart, process diagram, process flow, program, sign, solution, strategy, symbol, technology. The prominent colors used in the PowerPoint template are Blue, Gray, and Black

Sales Ppt Theme Linear Flow 7 State Diagram Style1 Time Management PowerPoint Image
We present our sales PPT Theme linear flow 7 state diagram style1 time management Powerpoint Image. Use our Arrows PowerPoint Templates because; Highlight the various ways in which we can maintain its efficiency. Use our Business PowerPoint Templates because, Tachometer: - You have a good idea of the roadmap to your desired destination. Use our Puzzles or jigsaws PowerPoint Templates because, Brilliant ideas popping up all over the place. Use our Technology PowerPoint Templates because, Business Template: - There is a vision, a need you can meet. Use our Process and flows PowerPoint Templates because, You now have the knowledge and resources to hit the target down to a Tues. these PowerPoint slides for presentations relating to Algorithm, arrow, arrow chart, business, chart, color, connection, development, diagram, direction, flow chart, flow diagram, flowchart, kind of diagram, linear, linear diagram, management, motion, organization, plan, process, process arrows, process chart, process diagram, process flow, program, sign, solution, strategy, symbol, technology. The prominent colors used in the PowerPoint template are Blue, Gray, and Black
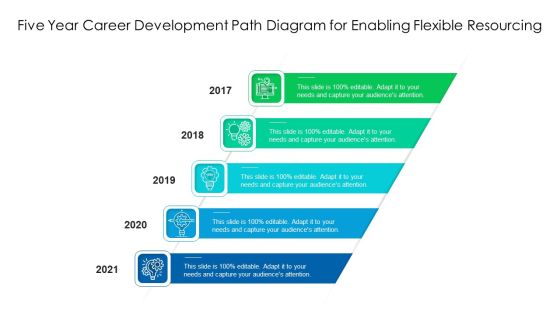
Five Year Career Development Path Diagram For Enabling Flexible Resourcing Ppt PowerPoint Presentation Slides Guidelines PDF
Presenting five year career development path diagram for enabling flexible resourcing ppt powerpoint presentation slides guidelines pdf to dispense important information. This template comprises five stages. It also presents valuable insights into the topics including five year career development path diagram for enabling flexible resourcing. This is a completely customizable PowerPoint theme that can be put to use immediately. So, download it and address the topic impactfully.
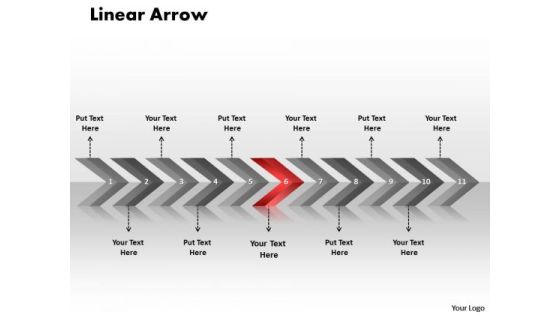
Editable Ppt Linear Arrows 11 State Diagram Time Management PowerPoint 7 Image
editable PPT linear arrows 11 state diagram time management powerpoint 7 Image-Original thinking is the need of the hour. We provide the means to project your views. Present your views using our innovative slides and are assured of leaving a lasting impression.-editable PPT linear arrows 11 state diagram time management powerpoint 7 Image-Aim, Angle, Arrow, Arrowheads, Badge, Banner, Connection, Curve, Design, Direction, Download, Element, Fuchsia, Icon, Illustration, Indicator, Internet, Label, Link, Magenta, Mark, Marker, Next, Object, Orange, Orientation, Pointer, Shadow, Shape, Signs Symbol

Ppt 3d Consecutive Explanation Using Arrow Of 4 State Diagram PowerPoint Templates
PPT 3d consecutive explanation using arrow of 4 state diagram PowerPoint Templates-This PPT is suitable to present a progression or sequential steps in a task, process, or workflow that move toward a common goal-PPT 3d consecutive explanation using arrow of 4 state diagram PowerPoint Templates-3d, Abstract, Arrows, Background, Ball, Business, Communication, Corporate, Decision, Determination, Follow, Illustration, Individuality, Leadership, Line, Many, Object, Path, Reflection, Row, Shine, Sphere, Success, Symbol

7 Stages Diverging Arrows Schematic Diagram Ppt Charts And Networks PowerPoint Slide
We present our 7 stages diverging arrows schematic diagram ppt Charts and Networks PowerPoint Slide.Use our Marketing PowerPoint Templates because you can Break it all down to Key Result Areas. Use our Shapes PowerPoint Templates because this diagram is designed to help your audience to develop their thoughts along the way. Use our Arrows PowerPoint Templates because this slide illuminates the spiritual brilliance of Jesus and showers the love for mankind he showed even while being crucified. Use our Business PowerPoint Templates because you can Lead your flock steadily to greater heights. Look around at the vast potential of achievement around you. Use our Process and Flows PowerPoint Templates because you can Highlight the key components of your entire manufacturing/ business process.Use these PowerPoint slides for presentations relating to Arrows, Business, Chart, Cyclic, Data, Diagram, Financial, Goal, Graph, Illustration, Info, Information, Marketing, Model, Option, Part, Pie, Presentation, Process, Result, Sphere, Statistics. The prominent colors used in the PowerPoint template are Blue, Gray, Black. The feedback we get is that our 7 stages diverging arrows schematic diagram ppt Charts and Networks PowerPoint Slide are Fashionable. People tell us our Data PowerPoint templates and PPT Slides are Perfect. Presenters tell us our 7 stages diverging arrows schematic diagram ppt Charts and Networks PowerPoint Slide will make the presenter successul in his career/life. Use our Goal PowerPoint templates and PPT Slides are Bold. Use our 7 stages diverging arrows schematic diagram ppt Charts and Networks PowerPoint Slide are Spiffy. Use our Financial PowerPoint templates and PPT Slides are Functional.

7 Stages Diverging Arrows Schematic Diagram Charts And Networks PowerPoint Slides
We present our 7 stages diverging arrows schematic diagram Charts and Networks PowerPoint Slides.Download and present our Marketing PowerPoint Templates because different personalities, different abilities but formidable together. Download and present our Shapes PowerPoint Templates because you have to coordinate and motivate your team. Download and present our Arrows PowerPoint Templates because our templates illustrates your ability. Download and present our Business PowerPoint Templates because everybody knows The world over it is a priority for many. Along with it there are so many oppurtunities waiting to be utilised. Use our Process and Flows PowerPoint Templates because they pinpoint the core values of your organisation.Use these PowerPoint slides for presentations relating to Arrows, Business, Chart, Cyclic, Data, Diagram, Financial, Goal, Graph, Illustration, Info, Information, Marketing, Model, Option, Part, Pie, Presentation, Process, Result, Sphere, Statistics. The prominent colors used in the PowerPoint template are White, Gray, Black. The feedback we get is that our 7 stages diverging arrows schematic diagram Charts and Networks PowerPoint Slides help you meet deadlines which are an element of today's workplace. Just browse and pick the slides that appeal to your intuitive senses. People tell us our Data PowerPoint templates and PPT Slides are Cheerful. Presenters tell us our 7 stages diverging arrows schematic diagram Charts and Networks PowerPoint Slides look good visually. Use our Data PowerPoint templates and PPT Slides are Wonderful. Use our 7 stages diverging arrows schematic diagram Charts and Networks PowerPoint Slides are Youthful. Use our Diagram PowerPoint templates and PPT Slides are Upbeat.
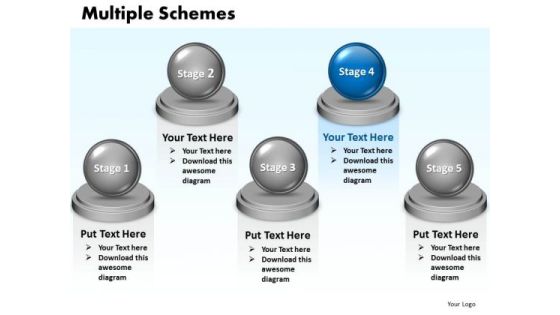
Ppt Multiple Schemes Diagram 5 Stages Presentation PowerPoint Tips 0812 Templates
PPT multiple schemes diagram 5 stages presentation powerpoint tips 0812 Templates-Use this circular implementation PPT slide to represent a series of interconnected ideas. Use this circular PPT abstraction to establish a link between your personal methodology and action research possibilities. -PPT multiple schemes diagram 5 stages presentation powerpoint tips 0812 Templates-3d, Abstract, Backgrounds, Ball, Business, Choice, Comparison, Concept, Descriptive, Equilibrium, Grow, Illustrations, Instrument, Measurement, Metallic, Part, Partnership, Pattern, Progress, Reflections, Scales, Several, Sphere, Strategy, Success
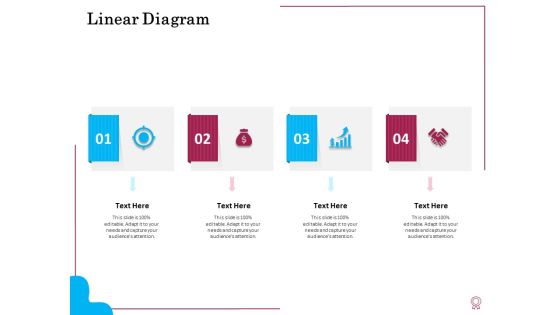
Factors Feasible Competitive Advancement Linear Diagram Ppt Slides Example File PDF
This is a factors feasible competitive advancement linear diagram ppt slides example file pdf template with various stages. Focus and dispense information on four stages using this creative set, that comes with editable features. It contains large content boxes to add your information on topics like linear diagram. You can also showcase facts, figures, and other relevant content using this PPT layout. Grab it now.
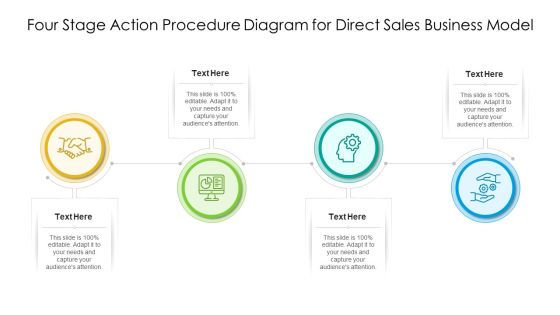
Four Stage Action Procedure Diagram For Direct Sales Business Model Slides PDF
Persuade your audience using this four stage action procedure diagram for direct sales business model slides pdf. This PPT design covers four stages, thus making it a great tool to use. It also caters to a variety of topics including four stage action procedure diagram for direct sales business model. Download this PPT design now to present a convincing pitch that not only emphasizes the topic but also showcases your presentation skills.

Four Goals Diagram Of Business Continuity Application Ppt PowerPoint Presentation Layouts Pictures PDF
Persuade your audience using this four goals diagram of business continuity application ppt powerpoint presentation layouts pictures pdf. This PPT design covers four stages, thus making it a great tool to use. It also caters to a variety of topics including four goals diagram of business continuity application. Download this PPT design now to present a convincing pitch that not only emphasizes the topic but also showcases your presentation skills.

5 Drivers Diagram For Strategic Organizational Planning Ppt PowerPoint Presentation Gallery Introduction PDF
Persuade your audience using this 5 drivers diagram for strategic organizational planning ppt powerpoint presentation gallery introduction pdf. This PPT design covers five stages, thus making it a great tool to use. It also caters to a variety of topics including 5 drivers diagram for strategic organizational planning. Download this PPT design now to present a convincing pitch that not only emphasizes the topic but also showcases your presentation skills.
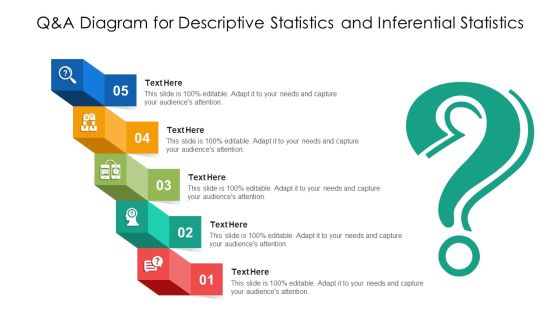
Q And A Diagram For Descriptive Statistics And Inferential Statistics Ppt PowerPoint Presentation File Format PDF
Persuade your audience using this q and a diagram for descriptive statistics and inferential statistics ppt powerpoint presentation file format pdf. This PPT design covers five stages, thus making it a great tool to use. It also caters to a variety of topics including q and a diagram for descriptive statistics and inferential statistics. Download this PPT design now to present a convincing pitch that not only emphasizes the topic but also showcases your presentation skills.

24 Hour Timeframe Diagram For Data Stewardship Model Ppt PowerPoint Presentation File Designs PDF
Persuade your audience using this 24 hour timeframe diagram for data stewardship model ppt powerpoint presentation file designs pdf. This PPT design covers four stages, thus making it a great tool to use. It also caters to a variety of topics including 24 hour timeframe diagram for data stewardship model. Download this PPT design now to present a convincing pitch that not only emphasizes the topic but also showcases your presentation skills.
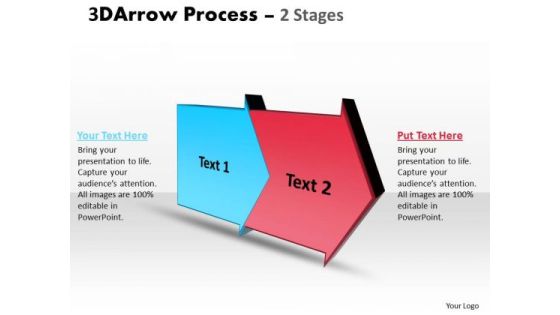
PowerPoint Template Two State Ppt Diagram Of Dealing Pre Procedure 1 Design
We present our PowerPoint template two state ppt diagram of dealing pre Procedure 1 design. Use our Business PowerPoint Templates because, Marketing Strategy Business Template: - Maximizing sales of your product is the intended destination. Use our Shapes PowerPoint Templates because; now imprint them on the minds of your audience via our slides. Use our Design PowerPoint Templates because; illustrate your chain of ideas focusing on that aspect or resource in order to enhance the quality of your product. Use our Signs PowerPoint Templates because, Spread the light of knowledge around you, clear the doubts and enlighten the questioning minds with your brilliance and ability. Use our Process and Flows PowerPoint Templates because, Sales & Marketing funnel:- You have the product you need. Use these PowerPoint slides for presentations relating to Arrow, Arrow, Chart, Block, Diagram, Business, Chart, Design, Development, Diagram, Direction, Element, Flow, Flow, Chart, Flow, Diagram, Flowchart, Graph, Linear, Linear, Diagram, Management, Organization, Process, Process, Arrows, Process, Chart, Process, Diagram, Process, Flow, Program, Section, Sign, Solution, Symbol. The prominent colors used in the PowerPoint template are Blue, Red, and Black

Horizontal Demonstration Of Curved Arrows 9 Stages Flow Diagram PowerPoint Templates
We present our horizontal demonstration of curved arrows 9 stages flow diagram PowerPoint templates.Use our Arrows PowerPoint Templates because,So that you can Lead the way to spread good cheer to one and all. Use our Shapes PowerPoint Templates because,Forward thinking is the way to go. Use our Signs PowerPoint Templates because,Our PowerPoint templates designed for your ideas to sell. Use our Business PowerPoint Templates because,Maximising sales of your product is the intended destination. Use our Process and Flows PowerPoint Templates because,you can see In any endeavour people matter most.Use these PowerPoint slides for presentations relating to Abstract, arrow, arrow, chart, arrows, business, chart, design, development, diagram, direction, element, flow, flow, chart, flow, diagram, flowchart, graph, linear, management, model, motion, organization, plan, process, program, section, segment, set, sign, solution, strategy, symbol, technology. The prominent colors used in the PowerPoint template are Green, Green dark , Black. People tell us our horizontal demonstration of curved arrows 9 stages flow diagram PowerPoint templates are Quaint. The feedback we get is that our business PowerPoint templates and PPT Slides are Charming. People tell us our horizontal demonstration of curved arrows 9 stages flow diagram PowerPoint templates are Enchanting. Presenters tell us our chart PowerPoint templates and PPT Slides are Versatile. The feedback we get is that our horizontal demonstration of curved arrows 9 stages flow diagram PowerPoint templates are visually appealing. Professionals tell us our chart PowerPoint templates and PPT Slides are Fancy.

6 Steps Converging Arrows To Center Point Cycle Diagram PowerPoint Template
We present our 6 steps converging arrows to center point Cycle Diagram PowerPoint template.Use our Leadership PowerPoint Templates because this diagram can be used to illustrate the logical path or system. Download our Business PowerPoint Templates because you are sure you have the right people for your plans. Download and present our Spheres PowerPoint Templates because chain reactions are the element of teamwork which add value to your efforts. Use our Process and Flows PowerPoint Templates because they will Amplify your plans to have dedicated sub groups working on related but distinct tasks. Use our Arrows PowerPoint Templates because you know Coincidentally it will always point to the top.Use these PowerPoint slides for presentations relating to Arrow, Blue, Business, Chart, Check, Circle, Concept, Control, Cycle, Design, Development, Diagram, Do, Engineering, Evaluate, Flow, Flowchart, Graphic, Idea, Iterative, Lifecycle, Management, Marble, Method, Model, Process, Quality, Red, Research, Schema, Software, Spiral, Step, Strategy, Success, System. The prominent colors used in the PowerPoint template are Green, White, Gray. The feedback we get is that our 6 steps converging arrows to center point Cycle Diagram PowerPoint template are Appealing. People tell us our Concept PowerPoint templates and PPT Slides are Striking. Presenters tell us our 6 steps converging arrows to center point Cycle Diagram PowerPoint template are Fun. Use our Concept PowerPoint templates and PPT Slides have awesome images to get your point across. Use our 6 steps converging arrows to center point Cycle Diagram PowerPoint template are Bold. Use our Cycle PowerPoint templates and PPT Slides are designed by professionals
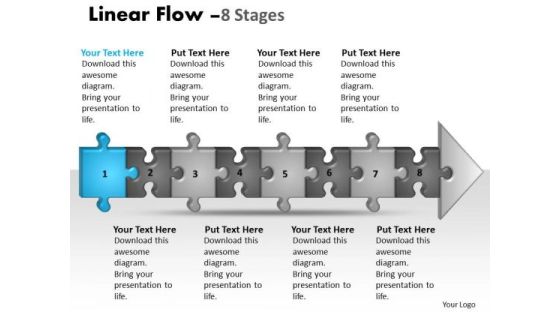
Usa PowerPoint Template Linear Flow 8 Phase Diagram Ppt Style1 2 Graphic
We present our USA PowerPoint template linear flow 8 phase diagram ppt style1 2 Graphic. Use our Puzzles or Jigsaws PowerPoint Templates because, transmit your thoughts via our slides and prod your team to action. Use our Game Pieces PowerPoint Templates because, you are the star of your enlightened team. Use our Finance PowerPoint Templates because, our template will help pinpoint their viability. Use our Shapes PowerPoint Templates because, you have made significant headway in this field. Use our Business PowerPoint Templates because, Marketing Strategy Business Template: - Maximizing sales of your product is the intended destination. Use these PowerPoint slides for presentations relating to abstract, algorithm, arrow, block diagram, business, chart, color, connection, design, development, diagram, direction, element, flow, graph, linear, linear diagram, management, organization, plan, process, section, segment, set, sign, solution, strategy, symbol, technology, vector. The prominent colors used in the PowerPoint template are Blue, Gray, and Black

Linear Flow Chart Of Channel Marketing Flow For Consumer Diagram Powerpoint Slides Design Templates
This is a linear flow chart of channel marketing flow for consumer diagram powerpoint slides design templates. This is a five stage process. The stages in this process are manufacture, distributor, wholesaler, retailer, consumer.

Six Gears Business Growth Factors Ppt PowerPoint Presentation Diagram Graph Charts
This is a six gears business growth factors ppt powerpoint presentation diagram graph charts. This is a seven stage process. The stages in this process are growth opportunity, growth drivers, market drivers.

Improve Sales Performance And Productivity Ppt PowerPoint Presentation Diagram Graph Charts
This is a improve sales performance and productivity ppt powerpoint presentation diagram graph charts. This is a four stage process. The stages in this process are marketing effort, branding initiative, marketing initiatives.

Smart Grid Architectural Framework Information And Communication Technology Ppt Powerpoint Presentation Diagram Graph Charts
This is a smart grid architectural framework information and communication technology ppt powerpoint presentation diagram graph charts. This is a three stage process. The stages in this process are functional architecture, functional planning, functional designing.
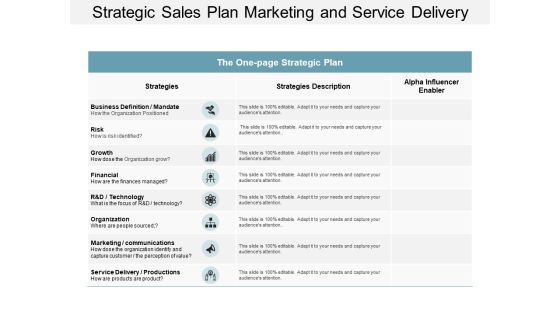
Strategic Sales Plan Marketing And Service Delivery Ppt Powerpoint Presentation Diagram Graph Charts
This is a strategic sales plan marketing and service delivery ppt powerpoint presentation diagram graph charts. This is a three stage process. The stages in this process are one page strategy, one page plan, one page approach.
