Website Analysis

Education Institute SEO Approach Regular Monitoring Training Ppt
This slide covers monitoring SEO for school as strategy for education industry. It also depicts that education businesses must monitor their website through KPI or metrics such as loading speed, your websites mobile-friendliness, etc.

Human Resources Planning Development Methods Ppt PowerPoint Presentation Complete Deck With Slides
This is a human resources planning development methods ppt powerpoint presentation complete deck with slides. This is a one stage process. The stages in this process are finance, data analysis, graph representation, planning, process.

Eight Stages Of Pie Chart Data Interpretation Detailed Business Plan PowerPoint Templates
We present our eight stages of pie chart data interpretation detailed business plan PowerPoint templates.Download and present our Competition PowerPoint Templates because You can Stir your ideas in the cauldron of our PowerPoint Templates and Slides. Cast a magic spell on your audience. Download and present our Marketing PowerPoint Templates because You should Kick up a storm with our PowerPoint Templates and Slides. The heads of your listeners will swirl with your ideas. Download and present our Arrows PowerPoint Templates because Your ideas provide food for thought. Our PowerPoint Templates and Slides will help you create a dish to tickle the most discerning palate. Present our Circle Charts PowerPoint Templates because You can Stir your ideas in the cauldron of our PowerPoint Templates and Slides. Cast a magic spell on your audience. Download our Business PowerPoint Templates because You can Score a slam dunk with our PowerPoint Templates and Slides. Watch your audience hang onto your every word.Use these PowerPoint slides for presentations relating to chart, graph, pie, 3d, diagram, graphic, icon, control, business, data, profit, market, sales, display, corporate, concept, render, success, presentation, finance, report, marketing, accounting, management, piece, strategy, money, growth, company, competition, progress, account, sheet, part, information, investment, improvement, banking, index, financial, reflect, results, performance, exchange. The prominent colors used in the PowerPoint template are Blue, Black, Gray.
Visual Representation Of Data Ppt PowerPoint Presentation Icon Sample
Presenting this set of slides with name visual representation of data ppt powerpoint presentation icon sample. This is a one stage process. The stages in this process are data visualization icon, research analysis, business focus. This is a completely editable PowerPoint presentation and is available for immediate download. Download now and impress your audience.

Data Representation Vector Icon Ppt PowerPoint Presentation Infographic Template Samples
Presenting this set of slides with name data representation vector icon ppt powerpoint presentation infographic template samples. This is a one stage process. The stages in this process are data visualization icon, research analysis, business focus. This is a completely editable PowerPoint presentation and is available for immediate download. Download now and impress your audience.

Personal Data Visualization On Computer Screen Ppt PowerPoint Presentation Show Layout Ideas
Presenting this set of slides with name personal data visualization on computer screen ppt powerpoint presentation show layout ideas. This is a one stage process. The stages in this process are data visualization icon, research analysis, business focus. This is a completely editable PowerPoint presentation and is available for immediate download. Download now and impress your audience.

Bar Chart Business Analytics Vector Icon Ppt PowerPoint Presentation Layouts Shapes
Presenting this set of slides with name bar chart business analytics vector icon ppt powerpoint presentation layouts shapes. This is a three stage process. The stages in this process are data visualization icon, research analysis, business focus. This is a completely editable PowerPoint presentation and is available for immediate download. Download now and impress your audience.

Business Performance Graph On Screen Icon Ppt PowerPoint Presentation Show Layouts
Presenting this set of slides with name business performance graph on screen icon ppt powerpoint presentation show layouts. This is a three stage process. The stages in this process are data visualization icon, research analysis, business focus. This is a completely editable PowerPoint presentation and is available for immediate download. Download now and impress your audience.

Business Performance Mapping Vector Icon Ppt PowerPoint Presentation Outline Show
Presenting this set of slides with name business performance mapping vector icon ppt powerpoint presentation outline show. This is a three stage process. The stages in this process are data visualization icon, research analysis, business focus. This is a completely editable PowerPoint presentation and is available for immediate download. Download now and impress your audience.

Computer Screen With Cloud Icon Ppt PowerPoint Presentation Outline Designs
Presenting this set of slides with name computer screen with cloud icon ppt powerpoint presentation outline designs. This is a three stage process. The stages in this process are data visualization icon, research analysis, business focus. This is a completely editable PowerPoint presentation and is available for immediate download. Download now and impress your audience.
Illustration Of Business Trends Icon Ppt PowerPoint Presentation Gallery Example
Presenting this set of slides with name illustration of business trends icon ppt powerpoint presentation gallery example. This is a two stage process. The stages in this process are data visualization icon, research analysis, business focus. This is a completely editable PowerPoint presentation and is available for immediate download. Download now and impress your audience.
Statistics Dashboard Vector Icon Ppt PowerPoint Presentation Pictures Visual Aids
Presenting this set of slides with name statistics dashboard vector icon ppt powerpoint presentation pictures visual aids. This is a one stage process. The stages in this process are data visualization icon, research analysis, business focus. This is a completely editable PowerPoint presentation and is available for immediate download. Download now and impress your audience.
Visual Analytics Vector Icon Ppt PowerPoint Presentation Visual Aids Show
Presenting this set of slides with name visual analytics vector icon ppt powerpoint presentation visual aids show. This is a three stage process. The stages in this process are data visualization icon, research analysis, business focus. This is a completely editable PowerPoint presentation and is available for immediate download. Download now and impress your audience.

Business Focus Vector Icon Ppt PowerPoint Presentation Portfolio Background Image
Presenting this set of slides with name business focus vector icon ppt powerpoint presentation portfolio background image. This is a one stage process. The stages in this process are data visualization icon, research analysis, business focus. This is a completely editable PowerPoint presentation and is available for immediate download. Download now and impress your audience.
Human Eye Observation And Monitoring Icon Ppt PowerPoint Presentation Layouts Graphics
Presenting this set of slides with name human eye observation and monitoring icon ppt powerpoint presentation layouts graphics. This is a three stage process. The stages in this process are data visualization icon, research analysis, business focus. This is a completely editable PowerPoint presentation and is available for immediate download. Download now and impress your audience.
Information Visualization Vector Icon Ppt PowerPoint Presentation Ideas Microsoft
Presenting this set of slides with name information visualization vector icon ppt powerpoint presentation ideas microsoft. This is a three stage process. The stages in this process are data visualization icon, research analysis, business focus. This is a completely editable PowerPoint presentation and is available for immediate download. Download now and impress your audience.
Upward Profit Growth Arrow Graph Vector Icon Ppt PowerPoint Presentation Styles Templates
Presenting this set of slides with name upward profit growth arrow graph vector icon ppt powerpoint presentation styles templates. This is a one stage process. The stages in this process are data visualization icon, research analysis, business focus. This is a completely editable PowerPoint presentation and is available for immediate download. Download now and impress your audience.

Business Framework Project Management Data PowerPoint Presentation
This diagram displays push pull communication framework. This diagram may used to displays push pull strategy. Use this diagram in business presentations. This diagram will enhance the quality of your presentations.

Plan And Frame Problem Collect The Data Ppt Sample
This is a plan and frame problem collect the data ppt sample. This is a four stage process. The stages in this process are business, marketing, success.

Consulting Slides Bar Chart For Data Interpretation Business Presentation
This pre-designed and appealing bar chart for PowerPoint offer an optimized possibility to illustrate your business strategy. You can use this diagram for data interpretation. This diagram is editable and can be easily adjusted.
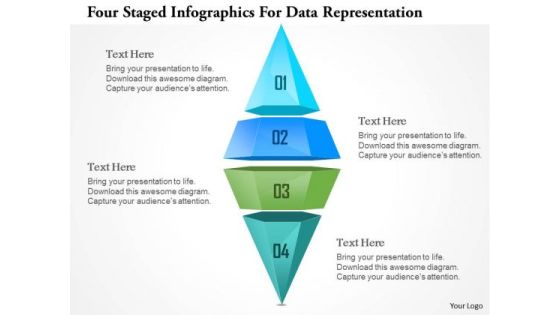
Busines Diagram Four Staged Ingographics For Data Representation Ppt Template
This business diagram has been designed with graphic of four staged info graphics. This info graphic can be used for data representation. Deliver amazing presentations to mesmerize your audience.
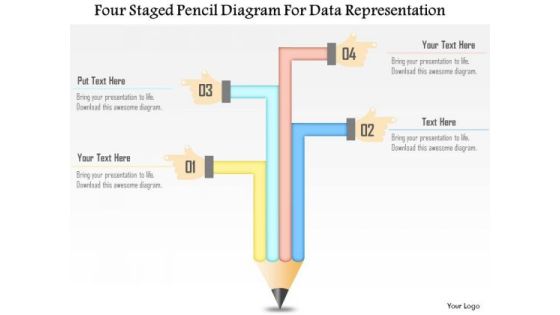
Business Diagram Four Staged Pencil Diagram For Data Representation Presentation Template
This business diagram has been designed with four staged pencil chart. This slide suitable for data representation. You can also use this slide to present four steps of any business process. Use this diagram to present your views in a wonderful manner.

Marketing And Customer Service Teams Ppt Example
This is a marketing and customer service teams ppt example. This is a ten stage process. The stages in this process are marketing director, marketing and customer service teams, website development team, manage customer communications, meet customer needs, after initial design, monthly survey of customers, market research debt, develop website specification, marketing actions success factors, marketing director.

Example Of Measuring Data Across Different Media Channels Ppt Slides
This is a example of measuring data across different media channels ppt slides. This is a five stage process. The stages in this process are tactics, keywords, topics, competitors, audiences, website search presence, social presence, press presence, industry presence, paid presence, owned, earned, paid, web presence website activity, actionable metrics.\n\n
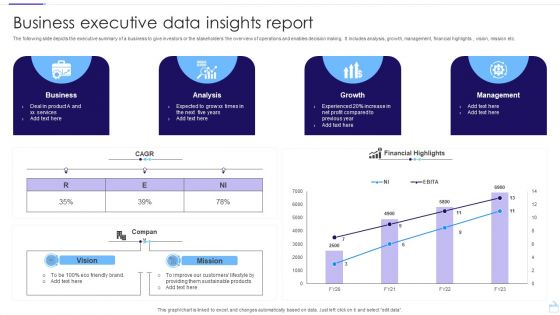
Business Executive Data Insights Report Pictures PDF
The following slide depicts the executive summary of a business to give investors or the stakeholders the overview of operations and enables decision making. It includes analysis, growth, management, financial highlights , vision, mission etc. Pitch your topic with ease and precision using this Business Executive Data Insights Report Pictures PDF. This layout presents information on Business, Analysis, Growth. It is also available for immediate download and adjustment. So, changes can be made in the color, design, graphics or any other component to create a unique layout.

Weekly Performance Assessment Of Project With Completion Status Ppt PowerPoint Presentation Show Templates PDF
Presenting this set of slides with name weekly performance assessment of project with completion status ppt powerpoint presentation show templates pdf. The topics discussed in these slides are updating database code of website, designing website design elements, transferring data to cloud, high, low, medium. This is a completely editable PowerPoint presentation and is available for immediate download. Download now and impress your audience.
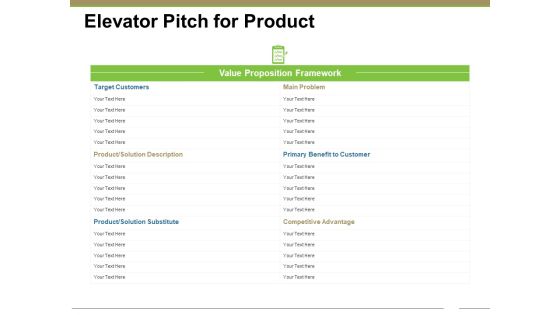
Elevator Pitch For Product Ppt PowerPoint Presentation Infographic Template Infographic Template
This is a elevator pitch for product ppt powerpoint presentation infographic template infographic template. This is a three stage process. The stages in this process are target customers, main problem, primary benefit to customer, competitive advantage, product solution description.

ROI Calculation Ppt PowerPoint Presentation Complete Deck With Slides
This is a roi calculation ppt powerpoint presentation complete deck with slides. This is a one stage process. The stages in this process are business, planning, strategy, marketing, management.
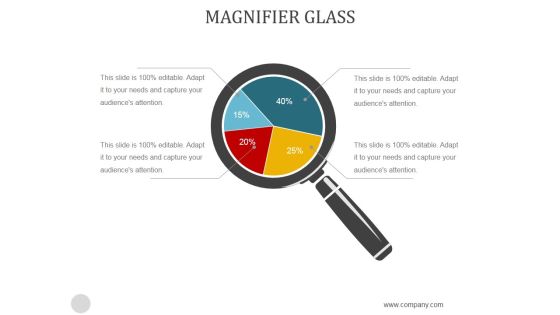
Magnifier Glass Ppt PowerPoint Presentation Example
This is a magnifier glass ppt powerpoint presentation example. This is a four stage process. The stages in this process are magnifier, searching, strategy, analysis, business.

Facebook Strategies Dashboard To Track Progress Structure PDF
This slides showcases dashboard to monitor the progress of Facebook page. It includes elements such as total likes, followers, likes by country, by age , engagement types and Facebook videos views. Pitch your topic with ease and precision using this Facebook Strategies Dashboard To Track Progress Structure PDF. This layout presents information on Followers, Engagement Type, Shares. It is also available for immediate download and adjustment. So, changes can be made in the color, design, graphics or any other component to create a unique layout.

Data Analytics Ppt PowerPoint Presentation Graphics
This is a data analytics ppt powerpoint presentation graphics. This is a five stage process. The stages in this process are data analysis, business, marketing, success, graph.

Feature Development Data Associated Activities Guidelines PDF
This slide exhibits survey of data scientists to understand feature engineering activities that helps to improve performance of machine learning business models. It includes activities such as data cleaning, organizing, collection, mining, refining algorithms etc. Pitch your topic with ease and precision using this Feature Development Data Associated Activities Guidelines PDF. This layout presents information on Programming, Developing Training Sets, Gathering Data Sets. It is also available for immediate download and adjustment. So, changes can be made in the color, design, graphics or any other component to create a unique layout.

Business Data Insights Report Icon Download PDF
Showcasing this set of slides titled Business Data Insights Report Icon Download PDF. The topics addressed in these templates are Business, Data Insights, Report. All the content presented in this PPT design is completely editable. Download it and make adjustments in color, background, font etc. as per your unique business setting.

Customer Satisfaction Data Insights Dashboard Ideas PDF
The following slide highlights the key metrics of the customer satisfaction survey conducted to measure and enhance the user experience. It includes satisfaction, recommendation rate, customers professional background and reviews. Showcasing this set of slides titled Customer Satisfaction Data Insights Dashboard Ideas PDF. The topics addressed in these templates are Recommendation Rate, Customer Satisfaction Rate, Customer Professional Background. All the content presented in this PPT design is completely editable. Download it and make adjustments in color, background, font etc. as per your unique business setting.

Cybersecurity Statistical Data Insights Sample PDF
The given below slide presents the number of organizations being victim of cyber attacks in the previous year. It also includes category wise attack data in the form of donut chart. Pitch your topic with ease and precision using this Cybersecurity Statistical Data Insights Sample PDF. This layout presents information on Social Media Attacks, Malware Attacks, Phishing Attacks. It is also available for immediate download and adjustment. So, changes can be made in the color, design, graphics or any other component to create a unique layout.

Quarterly Revenue Data Insights Report Template PDF
The following slide gives an insight of organizations quarter wise revenue to assess the most profitable and weak segment for strategy formulation. It also includes operating divisions, product segments, SEQ and YOY growth. Showcasing this set of slides titled Quarterly Revenue Data Insights Report Template PDF. The topics addressed in these templates are Operating, Divisions products, Insights Report. All the content presented in this PPT design is completely editable. Download it and make adjustments in color, background, font etc. as per your unique business setting.

Financial Ppt PowerPoint Presentation Outline Grid
This is a financial ppt powerpoint presentation outline grid. This is a three stage process. The stages in this process are business, strategy, marketing, analysis, finance, purchase, monthly.

Annual Financial Data Insights Dashboard Icon Introduction PDF
Showcasing this set of slides titled Annual Financial Data Insights Dashboard Icon Introduction PDF. The topics addressed in these templates are Annual Financial, Data Insights, Dashboard. All the content presented in this PPT design is completely editable. Download it and make adjustments in color, background, font etc. as per your unique business setting.
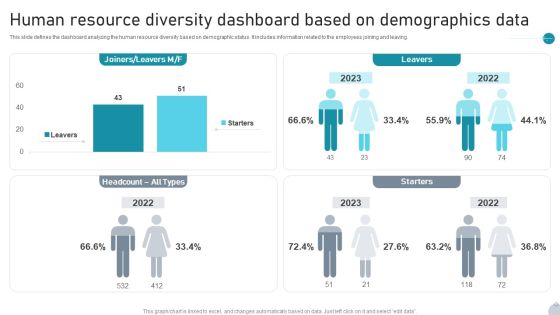
Human Resource Diversity Dashboard Based On Demographics Data Rules PDF
This slide defines the dashboard analyzing the human resource diversity based on demographic status. It includes information related to the employees joining and leaving. Pitch your topic with ease and precision using this Human Resource Diversity Dashboard Based On Demographics Data Rules PDF. This layout presents information on Starters, Leavers, Demographics Data It is also available for immediate download and adjustment. So, changes can be made in the color, design, graphics or any other component to create a unique layout.

Employee Demographics Data And Gender Distribution Dashboard Topics PDF
The purpose of this template is to explain the employee demographics and gender distribution dashboard. The slide provides information about distribution, hire and turnover based gender. Showcasing this set of slides titled Employee Demographics Data And Gender Distribution Dashboard Topics PDF. The topics addressed in these templates are Gender Distribution, Turnover By Gender, Hires By Gender All the content presented in this PPT design is completely editable. Download it and make adjustments in color, background, font etc. as per your unique business setting.
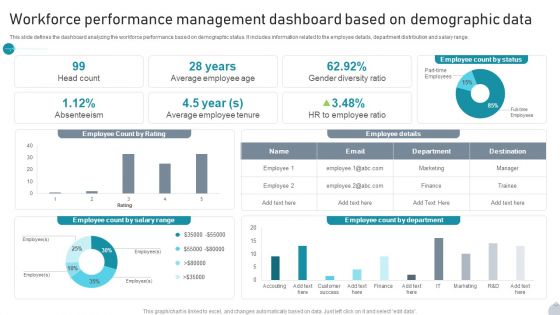
Workforce Performance Management Dashboard Based On Demographic Data Information PDF
This slide defines the dashboard analyzing the workforce performance based on demographic status. It includes information related to the employee details, department distribution and salary range. Showcasing this set of slides titled Workforce Performance Management Dashboard Based On Demographic Data Information PDF. The topics addressed in these templates are Employee Details, Department, Gender Diversity Ratio All the content presented in this PPT design is completely editable. Download it and make adjustments in color, background, font etc. as per your unique business setting.

Annual Financial Data With KPI Insights Dashboard Structure PDF
The following slides highlights the financial kpas in summarized form to evaluate companys annual operating performance. It includes metrics such as gross, operating and net profit margin, income statement, target versus actual EBIT etc. Pitch your topic with ease and precision using this Annual Financial Data With KPI Insights Dashboard Structure PDF. This layout presents information on Gross Profit Margin, Operating Profit Margin, Net Profit Margin. It is also available for immediate download and adjustment. So, changes can be made in the color, design, graphics or any other component to create a unique layout.
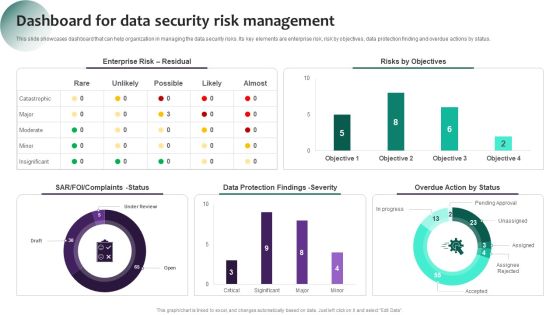
Information Systems Security And Risk Management Plan Dashboard For Data Security Risk Management Information PDF
This slide showcases dashboard that can help organization in managing the data security risks. Its key elements are enterprise risk, risk by objectives, data protection finding and overdue actions by status. If you are looking for a format to display your unique thoughts, then the professionally designed Information Systems Security And Risk Management Plan Dashboard For Data Security Risk Management Information PDF is the one for you. You can use it as a Google Slides template or a PowerPoint template. Incorporate impressive visuals, symbols, images, and other charts. Modify or reorganize the text boxes as you desire. Experiment with shade schemes and font pairings. Alter, share or cooperate with other people on your work. Download Information Systems Security And Risk Management Plan Dashboard For Data Security Risk Management Information PDF and find out how to give a successful presentation. Present a perfect display to your team and make your presentation unforgettable.

Information Systems Security And Risk Management Plan Information And Data Breach Impacting Customer Loyalty Brochure PDF
Make sure to capture your audiences attention in your business displays with our gratis customizable Information Systems Security And Risk Management Plan Information And Data Breach Impacting Customer Loyalty Brochure PDF. These are great for business strategies, office conferences, capital raising or task suggestions. If you desire to acquire more customers for your tech business and ensure they stay satisfied, create your own sales presentation with these plain slides.
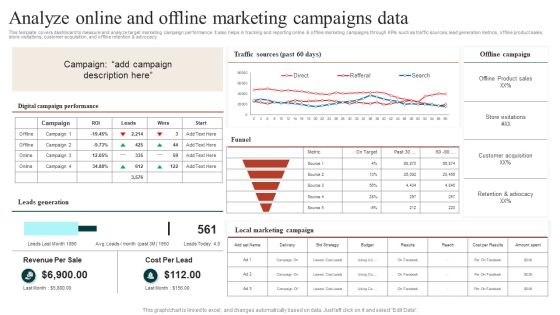
Target Marketing Techniques Analyze Online And Offline Marketing Campaigns Data Ideas PDF
This template covers dashboard to measure and analyze target marketing campaign performance. It also helps in tracking and reporting online and offline marketing campaigns through KPIs such as traffic sources, lead generation metrics, offline product sales, store visitations, customer acquisition, and offline retention and advocacy Find a pre designed and impeccable Target Marketing Techniques Evaluating Growth Rate For Target Marketing Slides PDF. The templates can ace your presentation without additional effort. You can download these easy to edit presentation templates to make your presentation stand out from others. So, what are you waiting for Download the template from Slidegeeks today and give a unique touch to your presentation.

Augmented Analytics Implementation IT Data Visualization With Augmented Analytics Microsoft PDF
This slide represents the data visualization with an augmented analytics dashboard covering sales, spending per customer, gross profit, unique customers, unique purchase, and gross profit. Deliver an awe inspiring pitch with this creative Augmented Analytics Implementation IT Data Visualization With Augmented Analytics Microsoft PDF bundle. Topics like Category Contribution, Category Year To Year Growth, Top Products, Sales, Gross Profit can be discussed with this completely editable template. It is available for immediate download depending on the needs and requirements of the user.

Financial Statistics Ppt Samples Download
This is a financial statistics ppt samples download. This is a six stage process. The stages in this process are business, finance, percentage, dollar, data.

Information Systems Security And Risk Management Plan Comparison Rules PDF
This graph chart is linked to excel, and changes automatically based on data. Just left click on it and select Edit Data. Find highly impressive Information Systems Security And Risk Management Plan Comparison Rules PDF on Slidegeeks to deliver a meaningful presentation. You can save an ample amount of time using these presentation templates. No need to worry to prepare everything from scratch because Slidegeeks experts have already done a huge research and work for you. You need to download Information Systems Security And Risk Management Plan Comparison Rules PDF for your upcoming presentation. All the presentation templates are 100 percent editable and you can change the color and personalize the content accordingly. Download now.
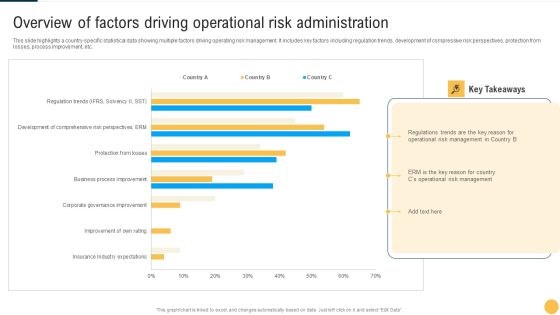
Overview Of Factors Driving Operational Risk Administration Summary PDF
This slide highlights a country specific statistical data showing multiple factors driving operating risk management. It includes key factors including regulation trends, development of compressive risk perspectives, protection from losses, process improvement, etc. Pitch your topic with ease and precision using this Overview Of Factors Driving Operational Risk Administration Summary PDF This layout presents information on Key Takeaways, Risk Management, Administration. It is also available for immediate download and adjustment. So, changes can be made in the color, design, graphics or any other component to create a unique layout.
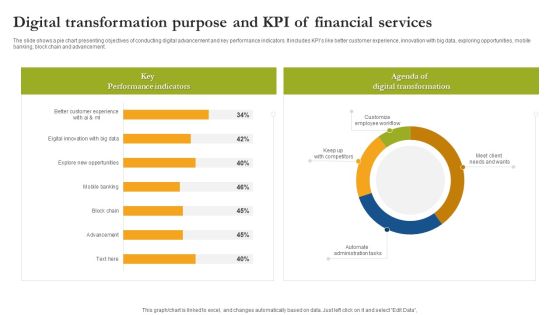
Digital Transformation Purpose And Kpi Of Financial Services Guidelines PDF
The slide shows a pie chart presenting objectives of conducting digital advancement and key performance indicators. It includes KPIs like better customer experience, innovation with big data, exploring opportunities, mobile banking, block chain and advancement. Showcasing this set of slides titled Digital Transformation Purpose And Kpi Of Financial Services Guidelines PDF. The topics addressed in these templates are Key Performance Indicators Digital Transformation, Customize Employee Workflow. All the content presented in this PPT design is completely editable. Download it and make adjustments in color, background, font etc. as per your unique business setting.
Integrated Digital Marketing Strategy Dashboard For Lead Conversion Icons PDF
Following slide illustrates integrated marketing campaign dashboard utilized by organizations to improve business agility and increase operational efficiency. This slide provides data regarding lead conversion by campaign and channel, amount spent per campaign, monthly lead generations, etc. Showcasing this set of slides titled Integrated Digital Marketing Strategy Dashboard For Lead Conversion Icons PDF. The topics addressed in these templates are Total Page Views, Average Session Duration, Conversion. All the content presented in this PPT design is completely editable. Download it and make adjustments in color, background, font etc. as per your unique business setting.

Call Center Metrics And Metrics Dashboard With Tickets Raised Graphics PDF
Mentioned slide outlines a KPI dashboard showcasing the call center performance. The metrics covered in the slide are total dropped calls, waiting calls, total calls, team performance, recurring calls, tickets raised. Showcasing this set of slides titled Call Center Metrics And Metrics Dashboard With Tickets Raised Graphics PDF. The topics addressed in these templates are Call Management Data, Monthly Statics, Performance Records. All the content presented in this PPT design is completely editable. Download it and make adjustments in color, background, font etc. as per your unique business setting.

Data Analytics Ppt PowerPoint Presentation Themes
This is a data analytics ppt powerpoint presentation themes. This is a five stage process. The stages in this process are business, marketing, presentation, data analyst, management.

Bar Graph For Financial Statements Ppt PowerPoint Presentation Example
This is a bar graph for financial statements ppt powerpoint presentation example. This is a four stage process. The stages in this process are product version, finance, year.

Acquisition Cost Per Customer Ppt PowerPoint Presentation Example 2015
This is a acquisition cost per customer ppt powerpoint presentation example 2015. This is a three stage process. The stages in this process are rising, steady, falling.
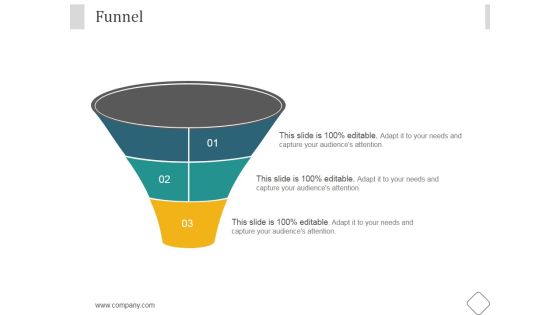
Funnel Ppt PowerPoint Presentation Backgrounds
This is a funnel ppt powerpoint presentation backgrounds. This is a three stage process. The stages in this process are business, marketing, management, funnel, planning.

How Much Money We Need Ppt PowerPoint Presentation Outline
This is a how much money we need ppt powerpoint presentation outline. This is a three stage process. The stages in this process are business, marketing, management, production, sales.

Campaign Report Ppt PowerPoint Presentation Professional
This is a campaign report ppt powerpoint presentation professional. This is a ten stage process. The stages in this process are email name, send date time, recipients, delivered, spam.

Deliverables From Marketing Ppt PowerPoint Presentation Tips
This is a deliverables from marketing ppt powerpoint presentation tips. This is a four stage process. The stages in this process are datasheet, product brief, white papers, case studies.

Financial Highlights Template Ppt PowerPoint Presentation Influencers
This is a financial highlights template ppt powerpoint presentation influencers. This is a three stage process. The stages in this process are business, marketing, management, finance, strategy.
 Home
Home