Waterfall Chart

Flow Chart Implementation Business Plans Ppt Sales Template PowerPoint Templates
We present our flow_chart_implementation_business_plans_ppt_sales_template_PowerPoint_templates.Present our Process and Flows PowerPoint Templates because Our PowerPoint Templates and Slides will let your ideas bloom. Create a bed of roses for your audience. Present our Circle Charts PowerPoint Templates because Timeline crunches are a fact of life. Meet all deadlines using our PowerPoint Templates and Slides. Present our Business PowerPoint Templates because Our PowerPoint Templates and Slides will Embellish your thoughts. They will help you illustrate the brilliance of your ideas. Use our Shapes PowerPoint Templates because Our PowerPoint Templates and Slides are created by a hardworking bunch of busybees. Always flitting around with solutions gauranteed to please. Use our Marketing PowerPoint Templates because You canTake a leap off the starting blocks with our PowerPoint Templates and Slides. They will put you ahead of the competition in quick

7 Arrows Diverging Representing Process Model Circular Chart PowerPoint Templates
We present our 7 arrows diverging representing process model Circular Chart PowerPoint templates.Use our Sale PowerPoint Templates because you can Highlight the key components of your entire manufacturing/ business process. Download our Arrows PowerPoint Templates because this template with an image of helps you chart the course of your presentation. Present our Process and Flows PowerPoint Templates because our creative template will lay down your views. Present our Business PowerPoint Templates because you too have got the framework of your companys growth in place. Download and present our Shapes PowerPoint Templates because your listeners do not have to put on their thinking caps.Use these PowerPoint slides for presentations relating to Abstract, Arrow, Art, Artistic, Background, Banner, Boost, Box, Business, Clip Art, Color, Colorful, Concept, Cover, Creative, Decide, Decision, Design, Direction, Finance, Futuristic, Graphic, Icon, Idea, Illustration, Increase, Info, Information, Journey, Label, Modern, Path, Pattern, Pop, Print, Process, Sale, Solution, Statistic, Sticker, Stylish, Template. The prominent colors used in the PowerPoint template are Blue, Gray, Black. PowerPoint presentation experts tell us our 7 arrows diverging representing process model Circular Chart PowerPoint templates are Radiant. People tell us our Background PowerPoint templates and PPT Slides are Upbeat. People tell us our 7 arrows diverging representing process model Circular Chart PowerPoint templates are Sparkling. Presenters tell us our Background PowerPoint templates and PPT Slides are Functional. Customers tell us our 7 arrows diverging representing process model Circular Chart PowerPoint templates are Delightful. The feedback we get is that our Boost PowerPoint templates and PPT Slides are Festive.
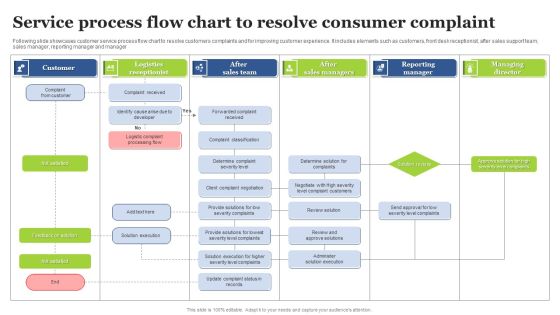
Service Process Flow Chart To Resolve Consumer Complaint Themes PDF
Following slide showcases customer service process flow chart to resolve customers complaints and for improving customer experience. It includes elements such as customers, front desk receptionist, after sales support team, sales manager, reporting manager and manager. Showcasing this set of slides titled Service Process Flow Chart To Resolve Consumer Complaint Themes PDF. The topics addressed in these templates are Service Process Flow Chart, Resolve Consumer Complaint. All the content presented in this PPT design is completely editable. Download it and make adjustments in color, background, font etc. as per your unique business setting.
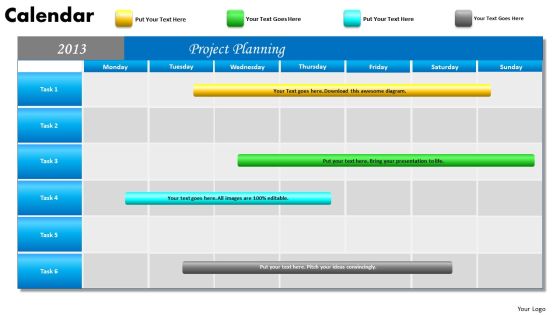
Project Planning Gantt Chart 2013 Calendar PowerPoint Slides Ppt Templates
We present our Project Planning Gantt Chart 2013 Calendar PowerPoint Slides PPT templates.Download and present our Calendars PowerPoint Templates because this slide depicts the occasion for gifting and giving. Present our New Year PowerPoint Templates because our templates emphasises your views. Use our Timelines PowerPoint Templates because this one depicts the popular chart. Use our Targets PowerPoint Templates because you can asked to strive to give true form to your great dream. Use our Time Planning PowerPoint Templates because you can Help your viewers automatically emphathise with your thoughts.Use these PowerPoint slides for presentations relating to 2013, Abstract, Agenda, Annual, April, Background, Book, Business, Calendar, Calendar, Content, Date, Day, Design, Desk, Diary, Document, Editable, Element, Eps10, Graphic, Green, Icon, Illustration, Layout, Monday, Month, Monthly, New, Note, Notepaper, Number, Old, Organizer, Paper, Plan, Planner. The prominent colors used in the PowerPoint template are Blue, Green, Yellow. PowerPoint presentation experts tell us our Project Planning Gantt Chart 2013 Calendar PowerPoint Slides PPT templates are Amazing. You can be sure our April PowerPoint templates and PPT Slides will make the presenter look like a pro even if they are not computer savvy. Presenters tell us our Project Planning Gantt Chart 2013 Calendar PowerPoint Slides PPT templates are Ritzy. We assure you our Calendar PowerPoint templates and PPT Slides are Tranquil. Professionals tell us our Project Planning Gantt Chart 2013 Calendar PowerPoint Slides PPT templates are Nice. The feedback we get is that our Business PowerPoint templates and PPT Slides are Tranquil.
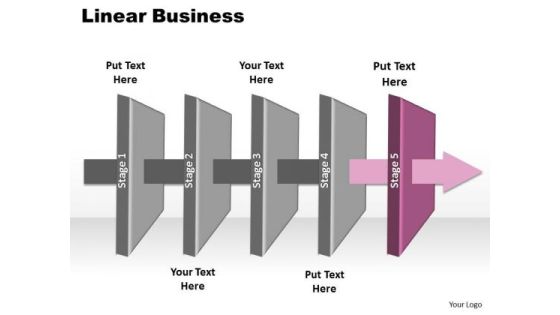
Ppt 5 Layers Internet Marketing PowerPoint Presentation Process Chart Templates
PPT 5 layers internet marketing powerpoint presentation process chart Templates-This PowerPoint Diagram shows you the 3d Horizontal Illustration to explain Internet Marketing. It consists of Five Layers explaining fifth here. It imitates advertise, barter, display, exchange, merchandise, offer for sale, retail, vend, wholesale etc.-PPT 5 layers internet marketing powerpoint presentation process chart Templates-3d, arrow, art, business, chart, chevron, clip, clipart, colorful, compliance, corporate, design, development, diagram, executive, flow, glossy, graph, graphic, green, hierarchy, icon, illustration, implement, infographic, levels, marketing, modern, orange, org, organization, organize, pink, plan, process, red, review, set, shadow, shape, shiny, square, stages, vector

Bar Chart Ppt PowerPoint Presentation Infographics Format Ideas
This is a bar chart ppt powerpoint presentation infographics format ideas. This is a two stage process. The stages in this process are bar graph, product, financial year, sales in percentage.

Bar Chart Ppt PowerPoint Presentation Pictures Background Image
This is a bar chart ppt powerpoint presentation pictures background image. This is a seven stage process. The stages in this process are financial years, sales in percentage, graph, business.

Combo Chart Ppt PowerPoint Presentation Ideas Visual Aids
This is a combo chart ppt powerpoint presentation ideas visual aids. This is a three stage process. The stages in this process are product, sales, bar graph, business, marketing.

Column Chart Ppt PowerPoint Presentation Model Graphics Download
This is a column chart ppt powerpoint presentation model graphics download. This is a two stage process. The stages in this process are product, financial year, sales in percentage, bar graph, success.

Column Chart Ppt PowerPoint Presentation Gallery Slide Portrait
This is a column chart ppt powerpoint presentation gallery slide portrait. This is a two stage process. The stages in this process are sales in percentage, financial year, product, bar graph, growth.
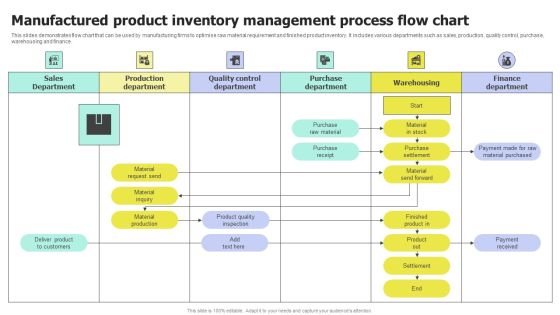
Manufactured Product Inventory Management Process Flow Chart Microsoft PDF
This slide demonstrates flow chart that can be used by manufacturing firms to optimise raw material requirement and finished product inventory. It includes various departments such as sales, production, quality control, purchase, warehousing and finance. Pitch your topic with ease and precision using this Manufactured Product Inventory Management Process Flow Chart Microsoft PDF. This layout presents information on Manufactured Product, Inventory Management, Process Flow Chart. It is also available for immediate download and adjustment. So, changes can be made in the color, design, graphics or any other component to create a unique layout.

Scatter Bubble Chart Ppt PowerPoint Presentation Diagram Ppt
This is a scatter bubble chart ppt powerpoint presentation diagram ppt. This is a two stage process. The stages in this process are product, in price, highest sale, percentage, business, marketing.

Hiring Plan Bar Chart Powerpoint Slide Background Image
This is a hiring plan bar chart powerpoint slide background image. This is a five stage process. The stages in this process are engineering, sales, marketing, product, support, finance.
Scatter Line Chart Ppt PowerPoint Presentation Icon Files
This is a scatter line chart ppt powerpoint presentation icon files. This is a one stage process. The stages in this process are dollar in millions, product, sales in percentage.

Competitive Analysis Matrix Chart Ppt PowerPoint Presentation Portfolio Format Ideas
This is a competitive analysis matrix chart ppt powerpoint presentation portfolio format ideas. This is a six stage process. The stages in this process are our business, product quality, product fidelity, after sales service, customer service.

Scatter Bubble Chart Ppt PowerPoint Presentation Inspiration Backgrounds
This is a scatter bubble chart ppt powerpoint presentation inspiration backgrounds. This is a five stage process. The stages in this process are highest sale, in price, business, marketing, success.

Area Chart Ppt PowerPoint Presentation Layouts Graphics Example
This is a area chart ppt powerpoint presentation layouts graphics example. This is a two stage process. The stages in this process are sales in percentage, financial year, business, marketing, presentation.
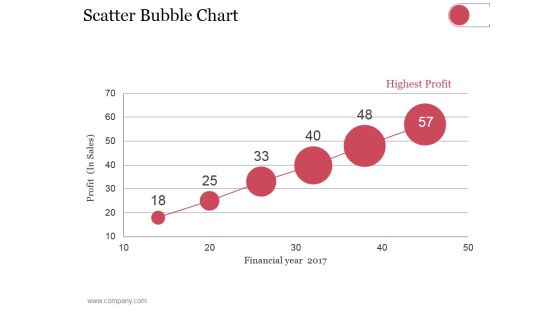
Scatter Bubble Chart Ppt PowerPoint Presentation Summary Pictures
This is a scatter bubble chart ppt powerpoint presentation summary pictures. This is a six stage process. The stages in this process are highest profit, financial year, profit in sales.

Organization Chart Ppt PowerPoint Presentation Model Graphic Images
This is a organization chart ppt powerpoint presentation model graphic images. This is a six stage process. The stages in this process are editor, sales marketing, assistant manager, manager, web designer.
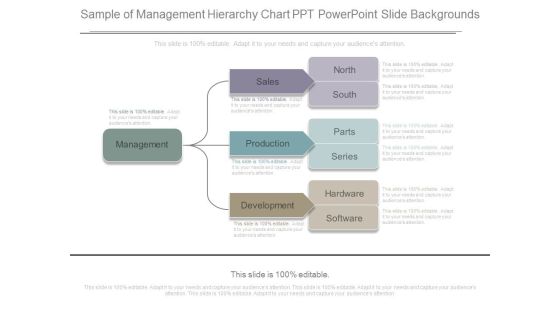
Sample Of Management Hierarchy Chart Ppt Powerpoint Slide Backgrounds
This is a sample of management hierarchy chart ppt powerpoint slide backgrounds. This is a one stage process. The stages in this process are management, sales, production, development, north, south, parts, series, hardware, software.
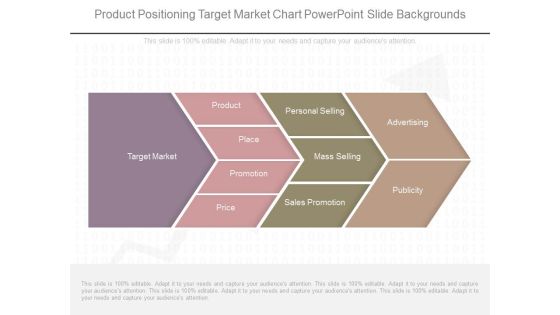
Product Positioning Target Market Chart Powerpoint Slide Backgrounds
This is a product positioning target market chart powerpoint slide backgrounds. This is a four stage process. The stages in this process are target market, product, place, promotion, price, personal selling, mass selling, sales promotion, advertising, publicity.

Customer Awareness Process Flow Chart Ppt Presentation Deck
This is a customer awareness process flow chart ppt presentation deck. This is a seven stage process. The stages in this process are loyalty, public relation, sales promotion, advertising, purchase, preference, awareness.

Tools To Measure Event Marketing Chart Powerpoint Slides Deck Template
This is a tools to measure event marketing chart powerpoint slides deck template. This is a six stage process. The stages in this process are cross functional, business intelligence, sales and promotion, going viral, driving roi, growing fans.

Small Business Structure Chart Example Powerpoint Slide Background Image
This is a small business structure chart example powerpoint slide background image. This is a six stage process. The stages in this process are financial manager, sales, distributions, finance, operations, general manager.

Closed Loop Life Cycle Chart Powerpoint Slide Backgrounds
This is a closed loop life cycle chart powerpoint slide backgrounds. This is a seven stage process. The stages in this process are consumption and use, results, manufacturing, materials sourcing, distribution logistics, sale and retail, underlying assumption.

Curve Chart For Product Life Cycle Presentation Outline
This is a curve chart for product life cycle presentation outline. This is a five stage process. The stages in this process are sales over time, product extension, introduction, growth, maturity, decline, time.

Competitive Analysis Template 8 Matrix Chart Ppt PowerPoint Presentation Templates
This is a competitive analysis template 8 matrix chart ppt powerpoint presentation templates. This is a six stage process. The stages in this process are our business, product quality, product fidelity, after sales service, customer service, price, shipping speed, competitor.

Competitive Analysis Matrix Chart Ppt PowerPoint Presentation Gallery
This is a competitive analysis matrix chart ppt powerpoint presentation gallery. This is a seven stage process. The stages in this process are our business, product quality, product fidelity, after sales service, customer service, price, shipping speed.

Competitive Analysis Matrix Chart Ppt PowerPoint Presentation Inspiration
This is a competitive analysis matrix chart ppt powerpoint presentation inspiration. This is a six stage process. The stages in this process are product quality, product fidelity, after sales service, customer service, price, shipping speed.

Bar Chart Ppt PowerPoint Presentation Infographic Template Skills
This is a bar chart ppt powerpoint presentation infographic template skills. This is a nine stage process. The stages in this process are sales in percentage, finance, business, marketing, strategy, success.

Scatter Bubble Chart Ppt PowerPoint Presentation Professional Model
This is a scatter bubble chart ppt powerpoint presentation professional model. This is a six stage process. The stages in this process are sales in profit, financial year, growth, business, marketing, strategy.

Line Chart Ppt PowerPoint Presentation Model Design Templates
This is a line chart ppt powerpoint presentation model design templates. This is a two stage process. The stages in this process are sales in percentage, financial years, product.

Scatter Bubble Chart Ppt PowerPoint Presentation Infographics Backgrounds
This is a scatter bubble chart ppt powerpoint presentation infographics backgrounds. This is a five stage process. The stages in this process are highest sale, in price, growth, success, business.

Line Bubble Chart Ppt PowerPoint Presentation Professional Infographic Template
This is a line bubble chart ppt powerpoint presentation professional infographic template. This is a five stage process. The stages in this process are product, in price, highest sale, business, finance.
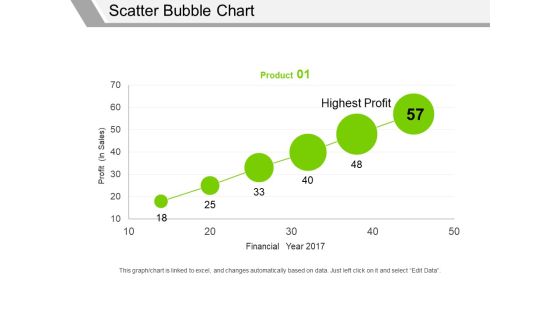
Scatter Bubble Chart Ppt PowerPoint Presentation Professional Graphics Pictures
This is a scatter bubble chart ppt powerpoint presentation professional graphics pictures. This is a one stage process. The stages in this process are profit in sales, financial year, highest profit, product.
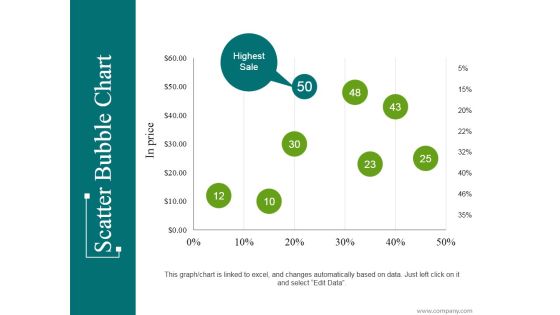
Scatter Bubble Chart Ppt PowerPoint Presentation Infographic Template Introduction
This is a scatter bubble chart ppt powerpoint presentation infographic template introduction. This is a eight stage process. The stages in this process are highest sale, business, marketing, percentage, finance.
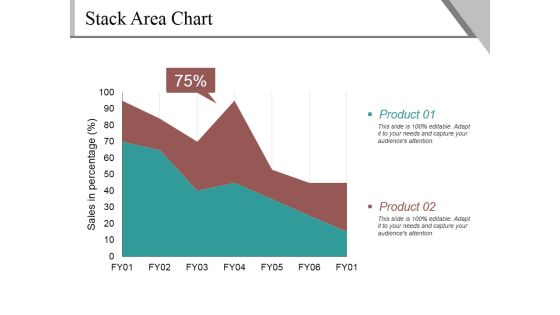
Stack Area Chart Ppt PowerPoint Presentation Gallery Guidelines
This is a stack area chart ppt powerpoint presentation gallery guidelines. This is a two stage process. The stages in this process are sales in percentage, product, percentage, business.

Stack Area Chart Ppt PowerPoint Presentation Example File
This is a stack area chart ppt powerpoint presentation example file. This is a two stage process. The stages in this process are product, sales in percentage, percentage, finance.

Scatter Bubble Chart Ppt PowerPoint Presentation Styles Objects
This is a scatter bubble chart ppt powerpoint presentation styles objects. This is a two stage process. The stages in this process are product, in price, highest sale, percentage, finance.
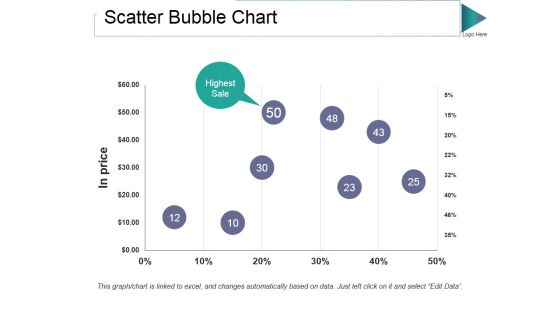
Scatter Bubble Chart Ppt PowerPoint Presentation Gallery Guidelines
This is a scatter bubble chart ppt powerpoint presentation gallery guidelines. This is a one stage process. The stages in this process are in price, highest sale, percentage, finance, business.
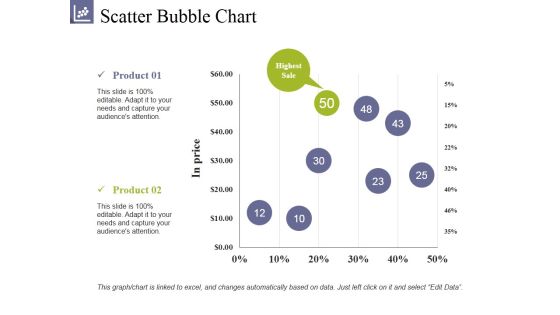
Scatter Bubble Chart Ppt PowerPoint Presentation Summary Clipart
This is a scatter bubble chart ppt powerpoint presentation summary clipart. This is a two stage process. The stages in this process are product, highest sale, in prices, growth, success.

Bar Chart Ppt PowerPoint Presentation Slides Example File
This is a bar chart ppt powerpoint presentation slides example file. This is a two stage process. The stages in this process are product, financial years, sales in percentage.

Successive Demonstration Using Hands Production Planning Flow Chart PowerPoint Templates
We present our successive demonstration using hands production planning flow chart PowerPoint templates. Use our Symbol PowerPoint Templates because; In any endeavor people matter most. Use our Business PowerPoint Templates because, Marketing Strategy Business Template:- Maximizing sales of your product is the intended destination. Use our Metaphor PowerPoint Templates because; educate your staff on the means to provide the required support for speedy recovery. Use our Abstract PowerPoint Templates because; Use our creative template to lay down your views. Use our Process and Flows PowerPoint Templates because, Our PowerPoint templates designed for your ideas to sell. Use these PowerPoint slides for presentations relating to Description using hands steps, Business, Collection, Connection, Cursor, Decoration, Design, Dimensional, Direction, Element, Icon, Illustration, Information, Modern, Motion, Paper, Perspective, Plastic, Pointer, Pointing, Process, Recycle, Recycling, Reflective, Set, Shape, Shiny, Sign, Symbol, Technology. The prominent colors used in the PowerPoint template are Blue, Gray, and Black

Successive Demonstration Using Hands Flow Chart Creator PowerPoint Templates
We present our successive demonstration using hands flow chart creator PowerPoint templates. Use our Symbol PowerPoint Templates because, are the tools that helped most of us evolve. Use our Business PowerPoint Templates because, Marketing Strategy Business Template:- Maximizing sales of your product is the intended destination. Use our Metaphor PowerPoint Templates because, Profit fairly earned is what you believe in. Use our Abstract PowerPoint Templates because, Forward thinking is the way to go. Use our Process and Flows PowerPoint Templates because, Original thinking is the need of the hour. Use these PowerPoint slides for presentations relating to Description using hands steps, Business, Collection, Connection, Cursor, Decoration, Design, Dimensional, Direction, Element, Icon, Illustration, Information, Modern, Motion, Paper, Perspective, Plastic, Pointer, Pointing, Process, Recycle, Recycling, Reflective, Set, Shape, Shiny, Sign, Symbol, Technology. The prominent colors used in the PowerPoint template are Green, Gray, and Black

Sales Incentive Compensation Programs Plan Chart Template PDF
This slide represents sales incentive compensation policy plan chart illustrating on target earning, mix pay, base salary, annual target incentive etc. for employees of the organization. Pitch your topic with ease and precision using this Sales Incentive Compensation Programs Plan Chart Template PDF. This layout presents information on Sale Commission Cap, Performance Time Frame, Annual Target Incentive. It is also available for immediate download and adjustment. So, changes can be made in the color, design, graphics or any other component to create a unique layout.
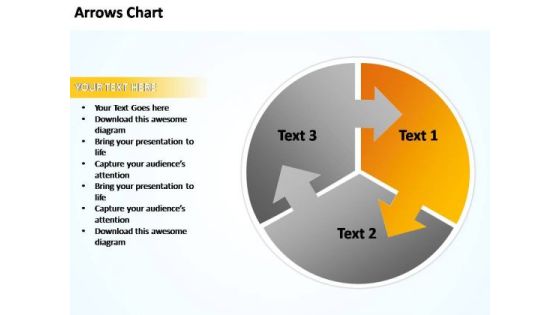
PowerPoint Templates Business Circular Plan With Arrows Chart Ppt Theme
PowerPoint Templates Business Circular Plan With Arrows Chart PPT Theme-Explore the various directions and layers existing in your in your plans and processes. Unravel the desired and essential elements of your overall strategy. Explain the relevance of the different layers and stages and directions in getting down to your core competence, ability and desired result.
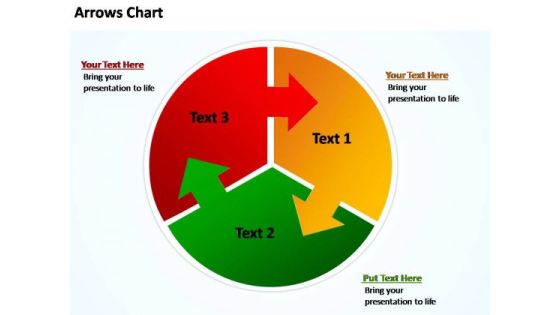
PowerPoint Templates Business Circular Plan With Arrows Chart Ppt Themes
PowerPoint Templates Business Circular Plan With Arrows Chart PPT Themes-Explore the various directions and layers existing in your in your plans and processes. Unravel the desired and essential elements of your overall strategy. Explain the relevance of the different layers and stages and directions in getting down to your core competence, ability and desired result.

Business Framework Pyramid Diagram Hierarchy Map Org Chart PowerPoint Presentation
This business diagram displays framework of pyramid diagram hierarchy map chart. It contains graphic of hierarchy map as a organizational chart. This slide displays concept of organizational and business hierarchy. Use this diagram for your business and management related presentations.

Sales Techniques Playbook Different Products Price Comparison Chart Graphics PDF
This slide provides information regarding product price comparison chart that captures information about price per unit, change over list price, reason for proposed price, volumes sold, forecasted growth. This is a sales techniques playbook different products price comparison chart graphics pdf template with various stages. Focus and dispense information on one stage using this creative set, that comes with editable features. It contains large content boxes to add your information on topics like ensuring effective communication among sales management team You can also showcase facts, figures, and other relevant content using this PPT layout. Grab it now.
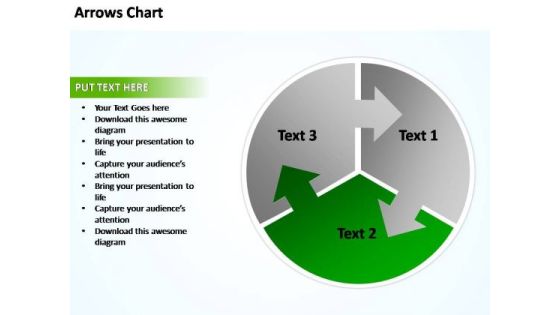
PowerPoint Templates Business Circular Plan With Arrows Chart Ppt Designs
PowerPoint Templates Business Circular Plan With Arrows Chart PPT Designs-Explore the various directions and layers existing in your in your plans and processes. Unravel the desired and essential elements of your overall strategy. Explain the relevance of the different layers and stages and directions in getting down to your core competence, ability and desired result.
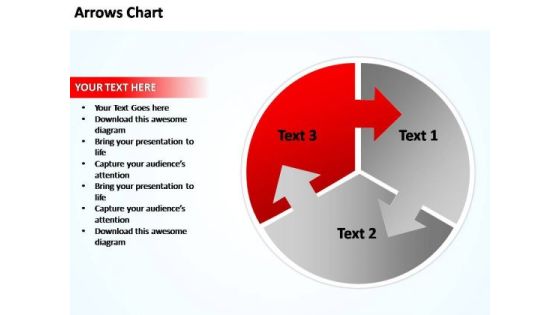
PowerPoint Templates Business Circular Plan With Arrows Chart Ppt Slides
PowerPoint Templates Business Circular Plan With Arrows Chart PPT Slides-Explore the various directions and layers existing in your in your plans and processes. Unravel the desired and essential elements of your overall strategy. Explain the relevance of the different layers and stages and directions in getting down to your core competence, ability and desired result.
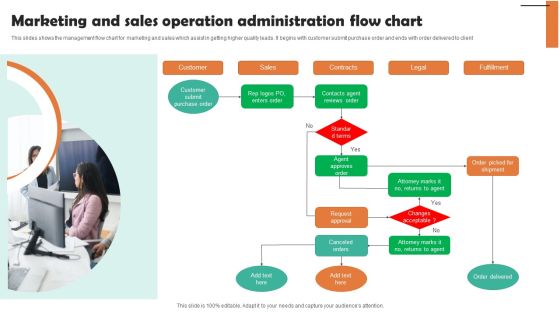
Marketing And Sales Operation Administration Flow Chart Ideas PDF
This slides shows the management flow chart for marketing and sales which assist in getting higher quality leads. It begins with customer submit purchase order and ends with order delivered to client. Presenting Marketing And Sales Operation Administration Flow Chart Ideas PDF to dispense important information. This template comprises one stages. It also presents valuable insights into the topics including Customer, Sales, Contracts. This is a completely customizable PowerPoint theme that can be put to use immediately. So, download it and address the topic impactfully.

Sales Techniques Playbook Different Products Price Comparison Chart Demonstration PDF
This slide provides information regarding product price comparison chart that captures information about price per unit, change over list price, reason for proposed price, volumes sold, forecasted growth. This is a sales techniques playbook different products price comparison chart demonstration pdf template with various stages. Focus and dispense information on two stages using this creative set, that comes with editable features. It contains large content boxes to add your information on topics like product, consumer, price, growth. You can also showcase facts, figures, and other relevant content using this PPT layout. Grab it now.
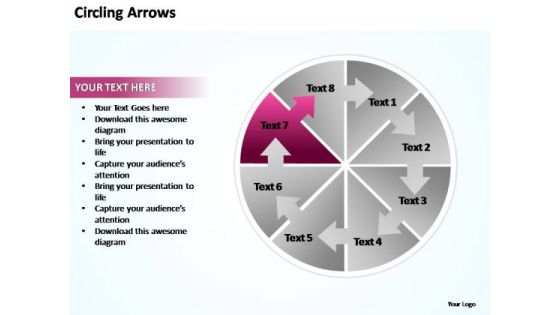
PowerPoint Templates Circling Arrows Flow Chart Ppt Backgrounds
PowerPoint Templates Circling Arrows Flow Chart PPT Backgrounds-Explore the various directions and layers existing in your in your plans and processes. Unravel the desired and essential elements of your overall strategy. Explain the relevance of the different layers and stages and directions in getting down to your core competence, ability and desired result.
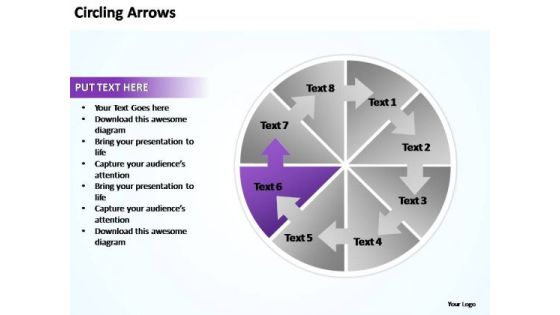
PowerPoint Templates Circling Arrows Flow Chart Ppt Design Slides
PowerPoint Templates Circling Arrows Flow Chart PPT Design Slides-Explore the various directions and layers existing in your in your plans and processes. Unravel the desired and essential elements of your overall strategy. Explain the relevance of the different layers and stages and directions in getting down to your core competence, ability and desired result.
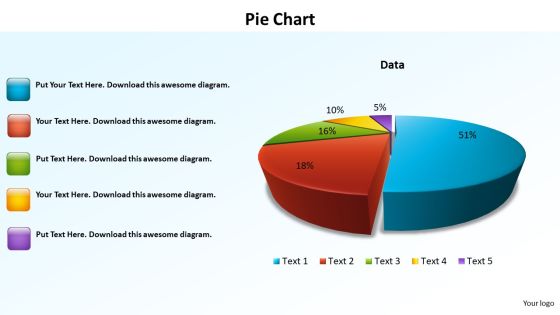
PowerPoint Templates Data Driven Pie Chart Ppt Themes
PowerPoint Templates Data Driven Pie Chart PPT Themes-The Circle of Life - a concept emmbedded in our minds and hence easy to comprehend. Life and Business is made up of processes comprising stages that flow from one to another. An excellent graphic to attract the attention of and understanding by your audience to improve earnings.

PowerPoint Slide Designs Sales Circular Chart Ppt Slide Designs
PowerPoint_Slide_Designs_Sales_circular_chart_PPT_Slide_DesignsBusiness Power Points-The Circle of Life - a concept emmbedded in our minds and hence easy to comprehend. Life and Business is made up of processes comprising stages that flow from one to another. An excellent graphic to attract the attention of and understanding by your audience to improve earnings.-

PowerPoint Design Chart Five New Concepts Ppt Slide
PowerPoint Design Chart Five New Concepts PPT Slide-Explore the various directions and layers existing in your in your plans and processes. Unravel the desired and essential elements of your overall strategy. Explain the relevance of the different layers and stages and directions in getting down to your core competence, ability and desired result.

Company Product Sales Forecast Chart Ppt Inspiration Templates PDF
This slide shows the Product sales forecast table with Product names along with price per unit and total units sold for the current as well as the projected period till the year 2023. Deliver and pitch your topic in the best possible manner with this company product sales forecast chart ppt inspiration templates pdf. Use them to share invaluable insights on company product sales forecast chart and impress your audience. This template can be altered and modified as per your expectations. So, grab it now.

1 Year Planning Gantt Chart PowerPoint Slides Gantt Ppt Templates

 Home
Home