Waterfall Chart
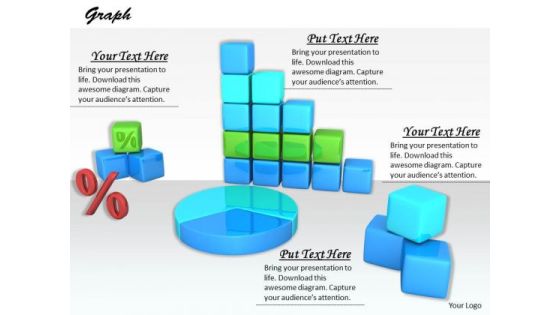
Stock Photo Design For Graphical Representations Of Data PowerPoint Slide
The above image contains a graphic of charts and graphs. Use this professional image in business or sales related presentations. It helps you to explain your plans in all earnest to your colleagues and raise the bar for all.

Bar Graph Ppt PowerPoint Presentation Infographics Templates
This is a bar graph ppt powerpoint presentation infographics templates. This is a two stage process. The stages in this process are product, financial years, sales in percentage.
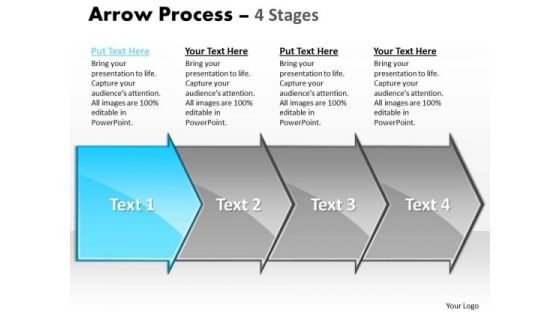
Process Ppt Theme Arrow 4 Stages Business Plan PowerPoint 2 Image
We present our process PPT Theme arrow 4 stages business plan PowerPoint 2 Image. Use our Arrows PowerPoint Templates because, you have played a stellar role and have a few ideas. Use our Symbol PowerPoint Templates because, you are the star of your enlightened team. Use our Business PowerPoint Templates because, Marketing Strategy Business Template: - Maximizing sales of your product is the intended destination. Use our Process and flows PowerPoint Templates because, the structure of our templates allows you to effectively highlight the key issues concerning the growth of your business. Use our Abstract PowerPoint Templates because; now imprint them on the minds of your audience via our slides. Use these PowerPoint slides for presentations relating to Arrow, Background, Business, Chart, Diagram, Financial, Graphic, Gray, Icon, Illustration, Management, Orange, Perspective, Planning, Process, Stages, Steps, Text. The prominent colors used in the PowerPoint template are Blue, Gray, and White

Bar Graph Ppt PowerPoint Presentation Ideas Display
This is a bar graph ppt powerpoint presentation ideas display. This is a two stage process. The stages in this process are product, sales in percentage, bar graph.

Bar Graph Ppt PowerPoint Presentation Inspiration Slides
This is a bar graph ppt powerpoint presentation inspiration slides. This is a six stage process. The stages in this process are sales in percentage, financial year, product.

Internet Marketing Objectives Ppt PowerPoint Presentation Layouts Smartart
This is a internet marketing objectives ppt powerpoint presentation layouts smartart. This is a six stage process. The stages in this process are sales leads, product types, sales revenue, profit margins, repeat sales, web visitors.

Competitor Analysis Ppt PowerPoint Presentation Layouts Slides
This is a competitor analysis ppt powerpoint presentation layouts slides. This is a four stage process. The stages in this process are sales development, performance indicators, sales development of industry, revenue sales.

Competitor Analysis Ppt PowerPoint Presentation Model Show
This is a competitor analysis ppt powerpoint presentation model show. This is a four stage process. The stages in this process are performance indicators, sales development of industry, sales development, revenue, sales.

Competitor Analysis Ppt PowerPoint Presentation Samples
This is a competitor analysis ppt powerpoint presentation samples. This is a four stage process. The stages in this process are sales development of industry, performance indicators, sales development, sales.

Competitor Analysis Ppt PowerPoint Presentation Layouts Slideshow
This is a competitor analysis ppt powerpoint presentation layouts slideshow. This is a four stage process. The stages in this process are sales development of industry, performance indicators, sales development, revenue, sales.

Competitor Analysis Ppt PowerPoint Presentation Visual Aids Model
This is a competitor analysis ppt powerpoint presentation visual aids model. This is a four stage process. The stages in this process are sales development of industry, performance indicators, sales development, revenue sales, business.
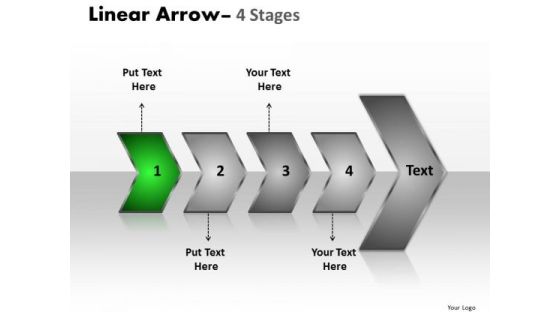
Process Ppt Theme Following Media Representation Theory PowerPoint Of 4 Arrows Design
We present our process PPT Theme following media representation theory PowerPoint of 4 arrows design. Use our Arrows PowerPoint Templates because, Tachometer: - You have a good idea of the roadmap to your desired destination. Use our Symbol PowerPoint Templates because, Start the gears of youthful minds and set them in motion. Use our Business PowerPoint Templates because, Marketing Strategy Business Template: - Maximizing sales of your product is the intended destination. Use our Process and flows PowerPoint Templates because, to achieve sure shot success they need to come together at the right time, place and manner. Use our Abstract PowerPoint Templates because, Support groups are an essential element of the ongoing struggle against cancer. Use these PowerPoint slides for presentations relating to Arrow, Background, Business, Chart, Diagram, Financial, Flow, Graphic, Gray, Icon, Illustration, Linear, Management, Orange, Perspective, Process, Reflection, Spheres, Stage, Text. The prominent colors used in the PowerPoint template are Green, Gray, and Black
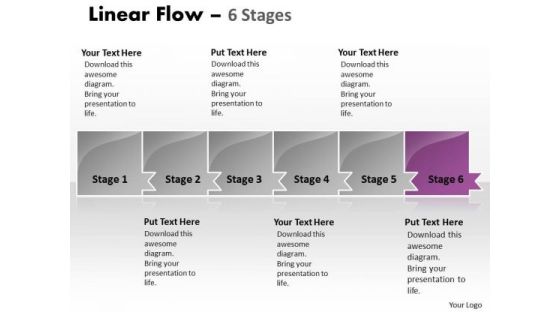
Marketing Ppt Theme Uniform Demonstration Of 6 Stages Business Management PowerPoint 7 Design
We present our marketing PPT Theme Uniform demonstration of 6 stages business management power point 7 designs. Use our Symbol PowerPoint Templates because, The Venn graphic comprising interlinking circles geometrically demonstrate how various functions operating independently, to a large extent, are essentially interdependent. Use our Abstract PowerPoint Templates because; educate your listeners on the means to keep it ticking over. Use our Process and Flows PowerPoint Templates because, you have the process in your head, our template design showing will illuminate your thoughts. Use our Arrows PowerPoint Templates because, Clarity of thought has been the key to your growth. Use our Business PowerPoint Templates because, Marketing Strategy Business Template:- maximizing sales of your product is the intended destination. Use these PowerPoint slides for presentations relating to Arrow, Background, Business, Chart, Diagram, Financial, Flow, Graphic, Gray, Icon, Illustration, Linear, Management, Orange, Perspective, Process, Reflection, Spheres, Stage, Text. The prominent colors used in the PowerPoint template are Purple, Gray, and Black

3d Regular Implementation 7 Steps PowerPoint Transformer Templates
We present our 3d regular implementation 7 steps PowerPoint transformer templates. Use our Business PowerPoint Templates because, they highlight the depth of your thought process. Use our Arrows PowerPoint Templates because, Spread the light of knowledge around you, clear the doubts and enlighten the questioning minds with your brilliance and ability. Use our Shapes PowerPoint Templates because, Use our to enthuse your colleagues. Use our Abstract PowerPoint Templates because, The pyramid is a symbol of the desire to reach the top in a steady manner. Use our Process and Flows PowerPoint Templates because, the foundation stones of many a life. Use these PowerPoint slides for presentations relating to analysis, art, blank, blue, business, categories, chart, chief, circle, clip, clipart, corporate, design, diagram, directors, element, executive, financial, graph, icon, illustration, implementation, isolated, managers, media, network, relations, role, sales, segments, set. The prominent colors used in the PowerPoint template are Red, Gray, and Black

3d Regular Implementation 7 Steps Flow Diagram PowerPoint Slides
We present our 3d regular implementation 7 steps flow diagram PowerPoint Slides. Use our Business PowerPoint Templates because, unravel the process layer by layer and expose their relevance to the core issue. Use our Arrows PowerPoint Templates because, you have some excellent plans to spread some more of it across your community. Use our Shapes PowerPoint Templates because, and keep you group steady in the top bracket. Use our Abstract PowerPoint Templates because; Help them align their arrows to consistently be accurate. Use our Process and Flows PowerPoint Templates because, they pinpoint the core values of your organization. Use these PowerPoint slides for presentations relating to analysis, art, blank, blue, business, categories, chart, chief, circle, clip, clipart, corporate, design, diagram, directors, element, executive, financial, graph, icon, illustration, implementation, isolated, managers, media, network, relations, role, sales, segments, set. The prominent colors used in the PowerPoint template are Pink, Gray, and Black

Loyalty Program Performance Dashboard Ppt PowerPoint Presentation Summary Grid
This is a loyalty program performance dashboard ppt powerpoint presentation summary grid. This is a six stage process. The stages in this process are average sale by loyalty member type, average award by customer, all orders by promotions, average sale by loyalty segment, sales by channel.
Process Ppt Template Seriate Representation Of 12 Shapes Arrows PowerPoint 3 Design
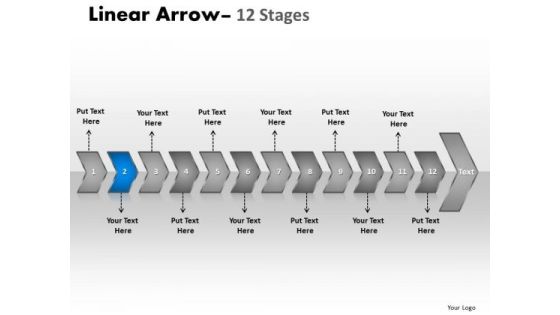
We present our process PPT template seriate representation of 12 shapes arrows PowerPoint 3 design. Use our Arrows PowerPoint Templates because, Shine the light on these thoughts and motivate your team to improve the quality of celebration for all around you. Use our Symbol PowerPoint Templates because, you have it all down to a T. Use our Business PowerPoint Templates because, Marketing Strategy Business Template: - Maximizing sales of your product is the intended destination. Use our Process and flows PowerPoint Templates because, and keep you group steady in the top bracket. Use our Abstract PowerPoint Templates because; transmit your passion via our creative templates. Use these PowerPoint slides for presentations relating to Arrow, Background, Business, Chart, Diagram, Financial, Flow, Graphic, Gray, Icon, Illustration, Linear, Management, Perspective, Process, Reflection, Spheres, Stage, Text. The prominent colors used in the PowerPoint template are Blue, Gray, and White

Process Ppt Template Seriate Representation Of 12 Shapes Arrows PowerPoint 4 Design
We present our process PPT template seriate representation of 12 shapes arrows PowerPoint 4 design. Use our Arrows PowerPoint Templates because; transmit this concern to your staff using our helpful slides. Use our Symbol PowerPoint Templates because, Activities which in themselves have many inherent business opportunities. Use our Business PowerPoint Templates because, Marketing Strategy Business Template: - Maximizing sales of your product is the intended destination. Use our Process and flows PowerPoint Templates because, Brainstorming Light Bulbs: - The atmosphere in the workplace is electric. Use our Abstract PowerPoint Templates because, Corporate Ladder: - The graphic is a symbol of growth and sucess.Use these PowerPoint slides for presentations relating to Arrow, Background, Business, Chart, Diagram, Financial, Flow, Graphic, Gray, Icon, Illustration, Linear, Management, Perspective, Process, Reflection, Spheres, Stage, Text. The prominent colors used in the PowerPoint template are Blue, Gray, and White

Process Ppt Template Unvarying Description Of 5 Practice The PowerPoint Macro Steps 3 Image
We present our process PPT template unvarying description of 5 practice the PowerPoint macro steps 3 Image. Use our Arrows PowerPoint Templates because, the lessons have been analyzed, studied and conclusions drawn. Use our Symbol PowerPoint Templates because; transmit your passion via our creative templates. Use our Business PowerPoint Templates because, Marketing Strategy Business Template: - Maximizing sales of your product is the intended destination. Use our Process and flows PowerPoint Templates because, are the seeds of many of our successes. Use our Abstract PowerPoint Templates because; Use this template to explain the value of its wellness to human life. Use these PowerPoint slides for presentations relating to Arrow, Background, Business, Chart, Diagram, Financial, Flow, Graphic, Gray, Icon, Illustration, Linear, Management, Orange, Perspective, Process, Reflection, Spheres, Stage, Text. The prominent colors used in the PowerPoint template are Purple, Gray, and White
Process Ppt Template Unvarying Description Of 5 Practice The PowerPoint Macro Steps 4 Image
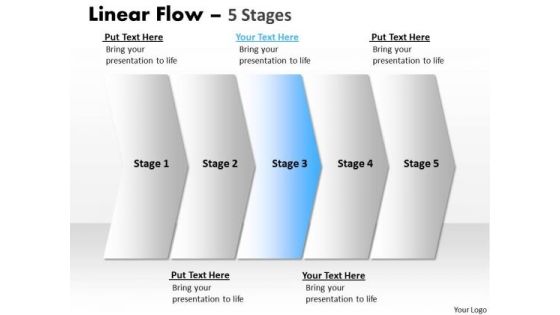
We present our process PPT template unvarying description of 5 practice the PowerPoint macro steps 4 Image. Use our Arrows PowerPoint Templates because, getting it done in time is the key to success. Use our Symbol PowerPoint Templates because; emphasize the process of your business/corporate growth. Use our Business PowerPoint Templates because, Marketing Strategy Business Template: - Maximizing sales of your product is the intended destination. Use our Process and flows PowerPoint Templates because, A healthy is the essence of a sense of happiness. Use our Abstract PowerPoint Templates because; now funnel your marketing strategies down the cone, stage by stage, refining as you go along. Use these PowerPoint slides for presentations relating to Arrow, Background, Business, Chart, Diagram, Financial, Flow, Graphic, Gray, Icon, Illustration, Linear, Management, Orange, Perspective, Process, Reflection, Spheres, Stage, Text. The prominent colors used in the PowerPoint template are Blue, Gray, and White

Process PowerPoint Template Steady Demonstration Of 6 Stages 4 Graphic
We present our process PowerPoint template steady demonstration of 6 stages 4 Graphic. Use our Symbol PowerPoint Templates because; educate your team and the attention you have paid. Use our Abstract PowerPoint Templates because; Use them to help you organize the logic of your views. Use our Process and Flows PowerPoint Templates because, Build on your foundation or prepare for change ahead to enhance the future. Use our Business PowerPoint Templates because, Marketing Strategy Business Template:- maximizing sales of your product is the intended destination. Use our Arrows PowerPoint Templates because, Targets: - You have a handle on all the targets, a master of the game, the experienced and consummate juggler. Use these PowerPoint slides for presentations relating to Arrow, Background, Business, Chart, Diagram, Financial, Flow, Graphic, Gray, Icon, Illustration, Linear, Management, Orange, Perspective, Process, Reflection, Spheres, Stage, Text. The prominent colors used in the PowerPoint template are Green, Gray, and Black
Profitability Ratios Template 1 Ppt PowerPoint Presentation Slides Inspiration
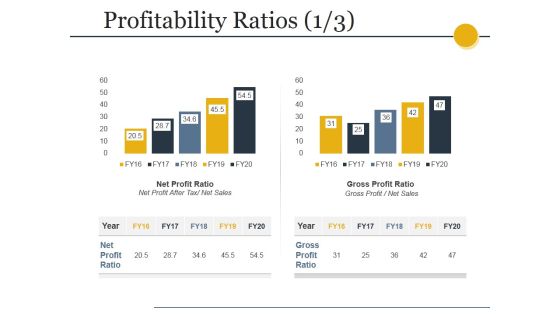
This is a profitability ratios template 1 ppt powerpoint presentation slides inspiration. This is a two stage process. The stages in this process are net profit ratio, net profit after tax net sales, gross profit ratio, gross profit net sales.

Profitability Ratios Template Ppt PowerPoint Presentation Styles Slide
This is a profitability ratios template ppt powerpoint presentation styles slide. This is a two stage process. The stages in this process are net profit ratio, net profit after tax net sales, gross profit ratio, gross profit net sales.

3d Puzzle Linear Flow Process 2 Stages Ppt Business To Strategies PowerPoint Slides
We present our 3d puzzle linear flow process 2 stages ppt business to strategies PowerPoint Slides. Use our Business PowerPoint Templates because, Marketing Strategy Business Template:- Maximizing sales of your product is the intended destination. Use our Puzzles or Jigsaws PowerPoint Templates because, you know your business and have a vision for it. Use our Shapes PowerPoint Templates because, Clear thinking is your strength, transmit your thoughts to your eager team. Use our Abstract PowerPoint Templates because, Now use this slide to bullet point your views. Use our Process and Flows PowerPoint Templates because, Forward thinking is the way to go. Use these PowerPoint slides for presentations relating to abstract, action, attach, box, business, center, chain, chart, color, communication, concept, connection, cube, cycle, data, diagram, flow, globe, horizontal, idea, illustration, information, interaction, jigsaw, join, link, pieces, process, puzzle, relation, relationship, shape, success. The prominent colors used in the PowerPoint template are Blue, Gray, and Black

Bar Graph Ppt PowerPoint Presentation File Slides
This is a bar graph ppt powerpoint presentation file slides. This is a three stage process. The stages in this process are product, sales in percentage, bar graph, growth, success.

Bar Graph Ppt PowerPoint Presentation Layouts Influencers
This is a bar graph ppt powerpoint presentation layouts influencers. This is a two stage process. The stages in this process are business, marketing, in bar graph, sales in percentage, finance.

Bar Graph Ppt PowerPoint Presentation Introduction
This is a bar graph ppt powerpoint presentation introduction. This is a eleven stage process. The stages in this process are management, marketing, business, fy, graph, sales in percentage.

Bar Graph Ppt PowerPoint Presentation Portfolio Example
This is a bar graph ppt powerpoint presentation portfolio example. This is a three stage process. The stages in this process are sales in percentage, year, business, product, business, graph.

Bar Graph Ppt PowerPoint Presentation Portfolio Slide Portrait
This is a bar graph ppt powerpoint presentation portfolio slide portrait. This is a three stage process. The stages in this process are product, sales in percentage, bar graph, growth, success.

Bar Diagram Ppt PowerPoint Presentation Gallery Structure
This is a bar diagram ppt powerpoint presentation gallery structure. This is a three stage process. The stages in this process are financial in years, sales in percentage, bar graph, growth, success.

Bar Diagram Ppt PowerPoint Presentation Pictures Background Image
This is a bar diagram ppt powerpoint presentation pictures background image. This is a three stage process. The stages in this process are financial in years, sales in percentage, bar graph, growth, success.

Competitor Analysis Ppt PowerPoint Presentation Model Visual Aids
This is a competitor analysis ppt powerpoint presentation model visual aids. This is a four stage process. The stages in this process are competitor analysis, revenue, sales, sales development, performance indicators.

Competitor Analysis Ppt PowerPoint Presentation Outline Ideas
This is a competitor analysis ppt powerpoint presentation outline ideas. This is a four stage process. The stages in this process are sales development of industry, revenue, sales, performance indicators.

Competitor Analysis Ppt PowerPoint Presentation File Mockup
This is a competitor analysis ppt powerpoint presentation file mockup. This is a four stage process. The stages in this process are sales development of industry, revenue, performance indicators, sales development.

Competitor Analysis Ppt PowerPoint Presentation Infographic Template Elements
This is a competitor analysis ppt powerpoint presentation infographic template elements. This is a four stage process. The stages in this process are revenue, sales, business, marketing, finance.

Department Wise Recruitment Plan Data Ppt Infographics
This is a department wise recruitment plan data ppt infographics. This is a five stage process. The stages in this process are finance, support, product, marketing, sales, engineering.

Hiring Plan Ppt PowerPoint Presentation Graphics
This is a hiring plan ppt powerpoint presentation graphics. This is a five stage process. The stages in this process are finance, support, product, marketing, sales, engineering .
Hiring Plan Ppt PowerPoint Presentation Tips
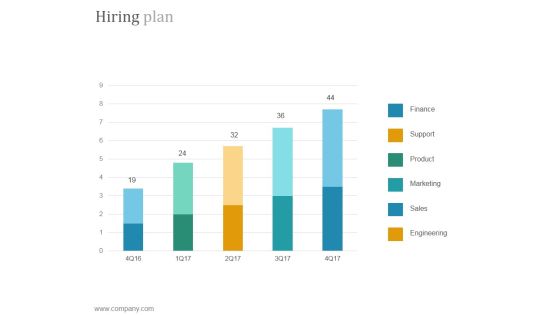
This is a hiring plan ppt powerpoint presentation tips. This is a five stage process. The stages in this process are finance, support, product, marketing, sales, engineering.
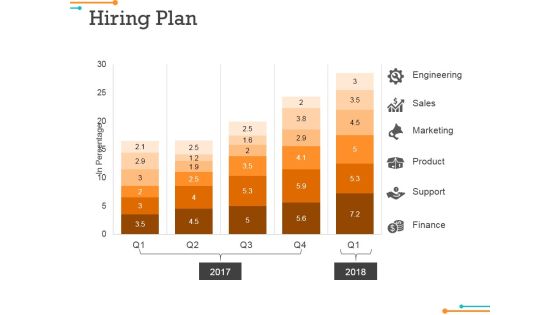
Hiring Plan Ppt Powerpoint Presentation Show Files
This is a hiring plan ppt powerpoint presentation show files. This is a five stage process. The stages in this process are engineering, sales, marketing, product.
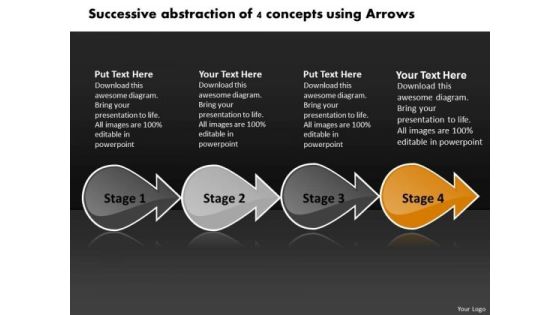
Successive Abstraction Of 4 Concepts Using Arrows Vision Office PowerPoint Slides
We present our successive abstraction of 4 concepts using arrows vision office PowerPoint Slides.Use our Business PowerPoint Templates because,Maximising sales of your product is the intended destination. Use our Arrows PowerPoint Templates because,you have the ability to judge Which out of late have been proving to be a hassle. Use our Shapes PowerPoint Templates because, With the help of our Slides you can Illustrate these thoughts with this slide. Use our Design PowerPoint Templates because,All elements of the venture are equally critical. Use our Abstract PowerPoint Templates because,you should take your team soaring to the pinnacle they crave.Use these PowerPoint slides for presentations relating to arrow, arrows, block, business, chart, design, development, diagram, direction, element, flow, flowchart, graph, linear, management, organization, process, program, section, sign, solution, symbol. The prominent colors used in the PowerPoint template are Orange, Black, White. People tell us our successive abstraction of 4 concepts using arrows vision office PowerPoint Slides are Beautiful. The feedback we get is that our block PowerPoint templates and PPT Slides are Fantastic. People tell us our successive abstraction of 4 concepts using arrows vision office PowerPoint Slides are Breathtaking. Presenters tell us our block PowerPoint templates and PPT Slides are Vintage. The feedback we get is that our successive abstraction of 4 concepts using arrows vision office PowerPoint Slides are Quaint. Professionals tell us our block PowerPoint templates and PPT Slides are Cheerful.
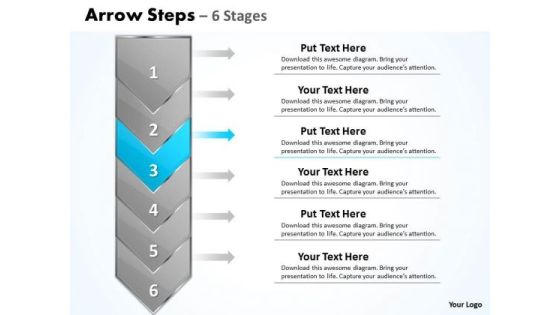
Strategy PowerPoint Template Vertical State Diagram Ppt Illustrated Through Arrow 4 Image
We present our strategy PowerPoint template vertical state diagram ppt illustrated through arrow 4 Image. Use our Abstract PowerPoint Templates because, There are so many different pieces to the puzzle. Use our Symbol PowerPoint Templates because, Business 3D Circular Puzzle: - Your business and plans for its growth consist of processes that are highly co-related. Use our Business PowerPoint Templates because, Marketing Strategy Business Template: - Maximizing sales of your product is the intended destination. Use our Arrows PowerPoint Templates because, Team Efforts Business Template:- The concept and strategy is your strength. Use our Process and Flows PowerPoint Templates because, you have some exciting plans to spread goodwill among the underprivileged, Expound on your ideas and show to your colleagues how they can help others and in the process increase your Brand value. Use these PowerPoint slides for presentations relating to Arrow, Background, Business, Chart, Diagram, Financial, Graphic, Gray, Icon, Illustration, Management, Orange, Perspective, Planning, Process, Process, Stages, Steps, Text. The prominent colors used in the PowerPoint template are Blue, Gray, and Black
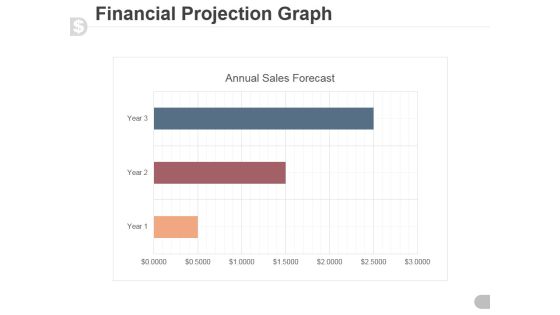
Financial Projection Graph Template 2 Ppt PowerPoint Presentation Samples
This is a financial projection graph template 2 ppt powerpoint presentation samples. This is a three stage process. The stages in this process are annual sales forecast, timeline, marketing, graph, management.
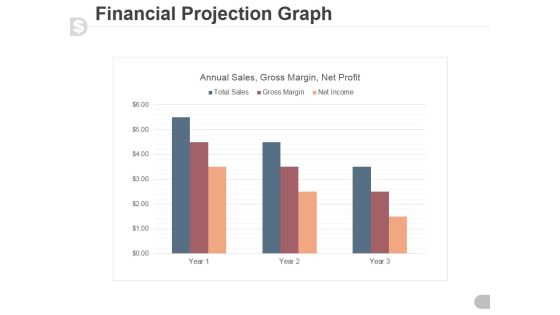
Financial Projection Graph Template 1 Ppt PowerPoint Presentation Guide
This is a financial projection graph template 1 ppt powerpoint presentation guide. This is a three stage process. The stages in this process are annual sales, gross margin, net profit.

Clustered Column Ppt PowerPoint Presentation Infographic Template Background Designs
This is a clustered column ppt powerpoint presentation infographic template background designs. This is a two stage process. The stages in this process are sales in percentage, bar, business, marketing, planning.

Activity Ratios Ppt PowerPoint Presentation Icon Themes
This is a activity ratios ppt powerpoint presentation icon themes. This is a two stage process. The stages in this process are inventory turnover, cogs, average inventory, receivable turnover, net credit sales, average accounts receivable .

Clustered Column Ppt PowerPoint Presentation Slides Smartart
This is a clustered column ppt powerpoint presentation slides smartart. This is a two stage process. The stages in this process are product, sales in percentage, financial year, bar graph.
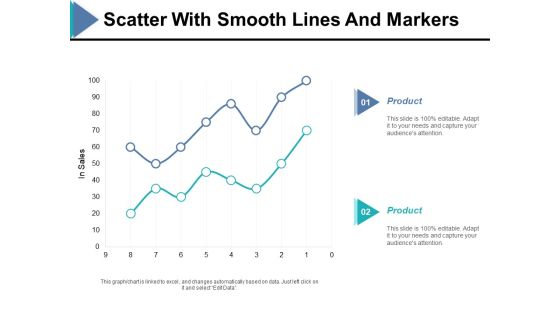
Scatter With Smooth Lines And Markers Ppt PowerPoint Presentation Ideas Example
This is a scatter with smooth lines and markers ppt powerpoint presentation ideas example. This is a two stage process. The stages in this process are in sales, finance, bar graph, product, business.
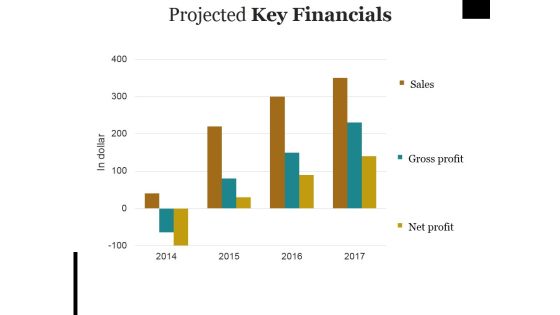
Projected Key Financials Ppt PowerPoint Presentation Pictures Objects
This is a projected key financials ppt powerpoint presentation pictures objects. This is a three stage process. The stages in this process are sales, gross profit, net profit.
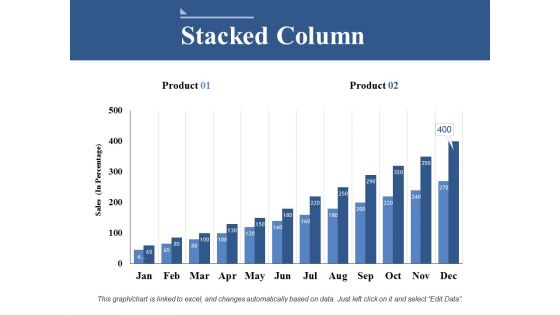
Stacked Column Ppt PowerPoint Presentation Model Information
This is a stacked column ppt powerpoint presentation model information. This is a two stage process. The stages in this process are business, sales, marketing, finance, strategy.

Area Graph Ppt PowerPoint Presentation Slides Ideas
This is a area graph ppt powerpoint presentation slides ideas. This is a two stage process. The stages in this process are sales in percentage, financial year, product.
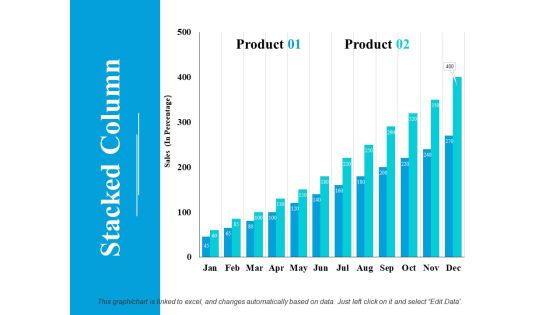
Stacked Column Ppt PowerPoint Presentation Model Inspiration
This is a stacked column ppt powerpoint presentation model inspiration. This is a two stage process. The stages in this process are product, sales, stacked column.
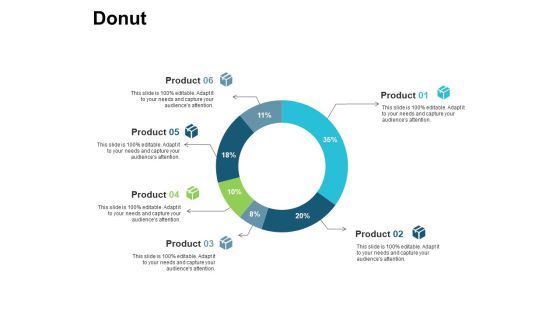
Donut Ppt PowerPoint Presentation Inspiration Files
This is a donut ppt powerpoint presentation inspiration files. This is a six stage process. The stages in this process are business, management, marketing, strategy, sales.

Projected Key Financials Template 1 Ppt PowerPoint Presentation Summary Professional
This is a projected key financials template 1 ppt powerpoint presentation summary professional. This is a three stage process. The stages in this process are in dollar, sales, gross profit, net profit, graph, year.

Area Stacked Ppt PowerPoint Presentation Diagram Images
This is a area stacked ppt powerpoint presentation diagram images. This is a two stage process. The stages in this process are sales in percentage, product, business, marketing, finance.
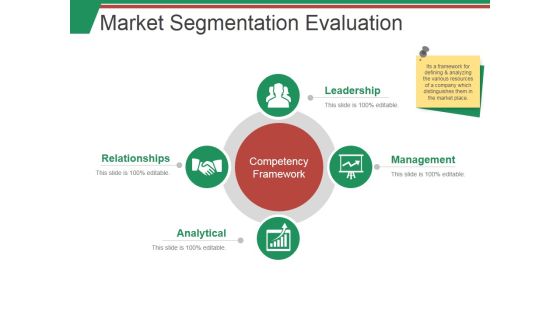
Market Segmentation Evaluation Template 1 Ppt PowerPoint Presentation Summary Smartart
This is a market segmentation evaluation template 1 ppt powerpoint presentation summary smartart. This is a two stage process. The stages in this process are market sales, net profit, beverages, milk product, nutrition.

Activity Ratios Template 3 Ppt PowerPoint Presentation Professional Example
This is a activity ratios template 3 ppt powerpoint presentation professional example. This is a two stage process. The stages in this process are total asset turnover, net sales, fixed assets turnover, fixed assets.

Activity Ratios Template Ppt PowerPoint Presentation Summary Slides
This is a activity ratios template ppt powerpoint presentation summary slides. This is a two stage process. The stages in this process are total asset turnover, net sales, fixed assets turnover, fixed assets.
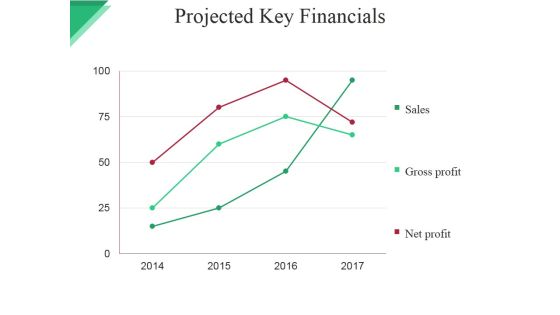
Projected Key Financials Template Ppt PowerPoint Presentation File Graphic Images
This is a projected key financials template ppt powerpoint presentation file graphic images. This is a four stage process. The stages in this process are sales, gross profit, net profit.
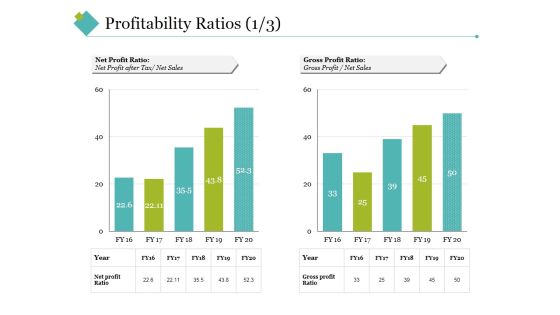
Profitability Ratios Template 2 Ppt PowerPoint Presentation Styles Example Topics
This is a profitability ratios template 2 ppt powerpoint presentation styles example topics. This is a two stage process. The stages in this process are net profit ratio, gross profit ratio, net sales, gross profit, year.
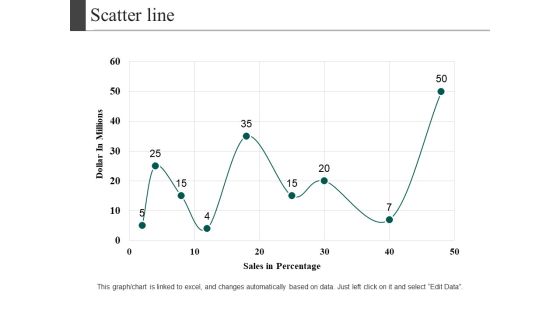
Scatter Line Ppt PowerPoint Presentation Visual Aids Diagrams
This is a scatter line ppt powerpoint presentation visual aids diagrams. This is a one stage process. The stages in this process are dollar in millions, sales in percentage, growth, business, marketing.

 Home
Home