Waterfall Chart
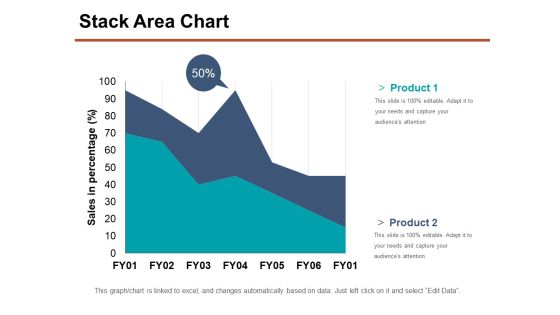
Stack Area Chart Ppt PowerPoint Presentation Show Samples
This is a stack area chart ppt powerpoint presentation show samples. This is a two stage process. The stages in this process are product, sales in percentage, business, marketing, percentage.

Line Chart Ppt PowerPoint Presentation Infographics Graphic Images
This is a line chart ppt powerpoint presentation infographics graphic images. This is a two stage process. The stages in this process are sales in percentage, financial years, growth, business, marketing.

Line Chart Ppt PowerPoint Presentation Professional Graphics Design
This is a line chart ppt powerpoint presentation professional graphics design. This is a two stage process. The stages in this process are financial years, sales in percentage, product, growth, success.

Clustered Column Chart Ppt PowerPoint Presentation Show Slideshow
This is a clustered column chart ppt powerpoint presentation show slideshow. This is a six stage process. The stages in this process are financial year in, sales in percentage, business, marketing, finance.
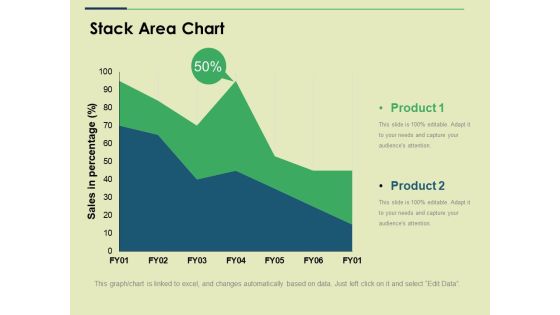
Stack Area Chart Ppt PowerPoint Presentation Show Slide
This is a stack area chart ppt powerpoint presentation show slide. This is a two stage process. The stages in this process are sales in percentage, business, marketing, strategy, graph.

Combo Chart Ppt PowerPoint Presentation Gallery Design Ideas
This is a combo chart ppt powerpoint presentation gallery design ideas. This is a three stage process. The stages in this process are business, financial years, sales in percentage, finance, graph.
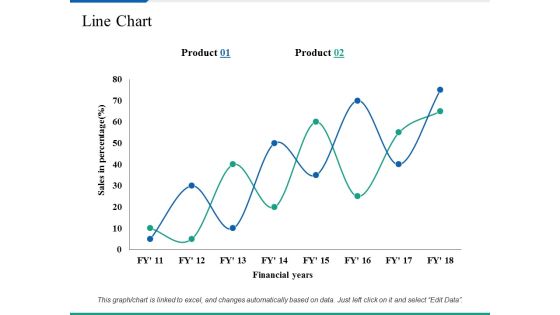
Line Chart Ppt PowerPoint Presentation Summary Clipart Images
This is a line chart ppt powerpoint presentation summary clipart images. This is a two stage process. The stages in this process are business, marketing, sales in percentage, financial years, strategy.

Clustered Column Chart Ppt PowerPoint Presentation Professional Ideas
This is a clustered column chart ppt powerpoint presentation professional ideas. This is a three stage process. The stages in this process are product, sales in percentage, column, years.
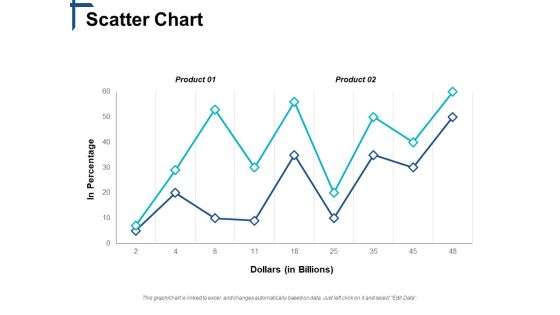
Scatter Chart Competitive Differentiation Ppt PowerPoint Presentation Show Slides
This is a scatter chart competitive differentiation ppt powerpoint presentation show slides. This is a two stage process. The stages in this process are business, management, marketing, strategy, sales.
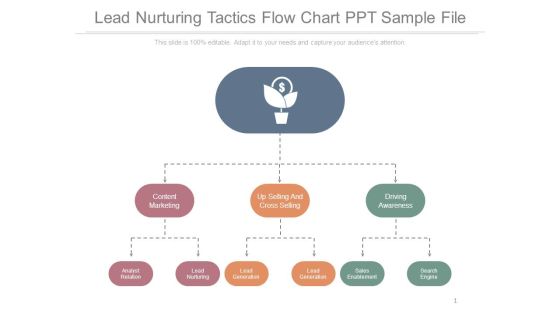
Lead Nurturing Tactics Flow Chart Ppt Sample File
This is a lead nurturing tactics flow chart ppt sample file. This is a three stage process. The stages in this process are content marketing, up selling and cross selling, driving awareness, search engine, sales enablement, lead generation, lead nurturing, analyst relation.

Departmental Organizational Structure Chart Ppt PowerPoint Presentation File Portfolio
Presenting this set of slides with name departmental organizational structure chart ppt powerpoint presentation file portfolio. This is a four stage process. The stages in this process are executive board, sales, hr, it, department. This is a completely editable PowerPoint presentation and is available for immediate download. Download now and impress your audience.

PowerPoint Presentation Designs Sales Circular Chart Ppt Template
PowerPoint Presentation Designs Sales circular chart PPT Template-The Circle of Life - a concept emmbedded in our minds and hence easy to comprehend. Life and Business is made up of processes comprising stages that flow from one to another. An excellent graphic to attract the attention of and understanding by your audience to improve earnings.-These amazing PowerPoint pre-designed slides and PowerPoint templates have been carefully created by our team of experts to help you impress your audience. Our stunning collection of Powerpoint slides are 100% editable and can easily fit in any PowerPoint presentations. By using these animations and graphics in PowerPoint and you can easily make professional presentations. Any text can be entered at any point in the PowerPoint template or slide. Just DOWNLOAD our awesome PowerPoint templates and you are ready to go.
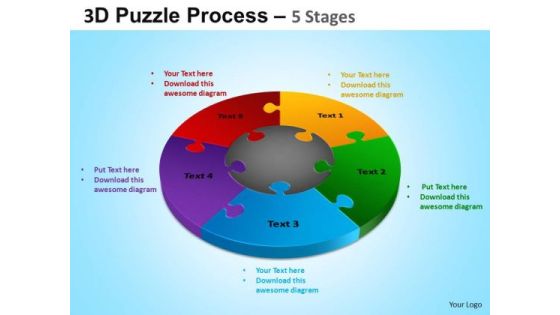
PowerPoint Template Sales Jigsaw Pie Chart Ppt Design
PowerPoint Template Sales Jigsaw Pie Chart PPT Design-These amazing PowerPoint pre-designed slides and PowerPoint templates have been carefully created by our team of experts to help you impress your audience. Our stunning collection of Powerpoint slides are 100% editable and can easily fit in any PowerPoint presentations. By using these animations and graphics in PowerPoint and you can easily make professional presentations. Any text can be entered at any point in the PowerPoint template or slide. Just DOWNLOAD our awesome PowerPoint templates and you are ready to go.
Target Vs Accomplishment Evaluation Chart Of Sales Representatives Icons PDF
This slide showcases sales targets and achievements of sales presentative which helps track employee efficiency. It provides information regarding set targets for sales representatives which strategies and success factors. Showcasing this set of slides titled Target Vs Accomplishment Evaluation Chart Of Sales Representatives Icons PDF. The topics addressed in these templates are Effective Communication, Manage Sales Targets, Set Activity Goals. All the content presented in this PPT design is completely editable. Download it and make adjustments in color, background, font etc. as per your unique business setting.

PowerPoint Process Sales Jigsaw Pie Chart Ppt Presentation
PowerPoint Process Sales Jigsaw Pie Chart PPT Presentation-These amazing PowerPoint pre-designed slides and PowerPoint templates have been carefully created by our team of experts to help you impress your audience. Our stunning collection of Powerpoint slides are 100% editable and can easily fit in any PowerPoint presentations. By using these animations and graphics in PowerPoint and you can easily make professional presentations. Any text can be entered at any point in the PowerPoint template or slide. Just DOWNLOAD our awesome PowerPoint templates and you are ready to go.

Bar Chart Ppt PowerPoint Presentation Icon Design Templates
This is a bar chart ppt powerpoint presentation icon design templates. This is a nine stage process. The stages in this process are sales in percentage, bar graph, business, marketing, growth.

Diverging Six Factors Sequential Flow Target Chart PowerPoint Slides
We present our diverging six factors sequential flow Target Chart PowerPoint Slides.Present our Advertising PowerPoint Templates because a lot of hard work has gone in and you are almost there. Present our Business PowerPoint Templates because like the famed William Tell, they put aside all emotions and concentrate on the target. Present our Arrows PowerPoint Templates because generation of sales is the core of any business. Download and present our Circle Charts PowerPoint Templates because you can Explore the various hues and layers existing in your in your plans and processes using this slide. Present our Shapes PowerPoint Templates because stable ideas are the building blocks of a sucessful structure.Use these PowerPoint slides for presentations relating to 3d, abstract, abstraction, arrow, background, black, blue, bottom, clip-art, collection color, computer, cool, curve, design, direct, direction, down, glass, graphic, green horizontal, icon, illustration, index, information, isolated, left, modern, navigation, next object, perspective, pink, pointer, pointing, red, right, round, set, show, sign, simple specify, style, symbol, turn, up, way. The prominent colors used in the PowerPoint template are Pink, Gray, White. Presenters tell us our diverging six factors sequential flow Target Chart PowerPoint Slides are Second to none. Presenters tell us our background PowerPoint templates and PPT Slides are Wonderful. PowerPoint presentation experts tell us our diverging six factors sequential flow Target Chart PowerPoint Slides are specially created by a professional team with vast experience. They diligently strive to come up with the right vehicle for your brilliant Ideas. We assure you our bottom PowerPoint templates and PPT Slides are Excellent. Customers tell us our diverging six factors sequential flow Target Chart PowerPoint Slides look good visually. People tell us our background PowerPoint templates and PPT Slides have awesome images to get your point across.

Line Chart Representing Outcomes Summary Of Product Sales Mockup PDF
This slide shows the graphical representation of sales volume of company products which includes product A , B and C which helps company to analyze the acceptability of products by potential customers.Pitch your topic with ease and precision using this Line Chart Representing Outcomes Summary Of Product Sales Mockup PDF This layout presents information on Company Generated, Maximum Revenues, Increasing For Product It is also available for immediate download and adjustment. So, changes can be made in the color, design, graphics or any other component to create a unique layout.
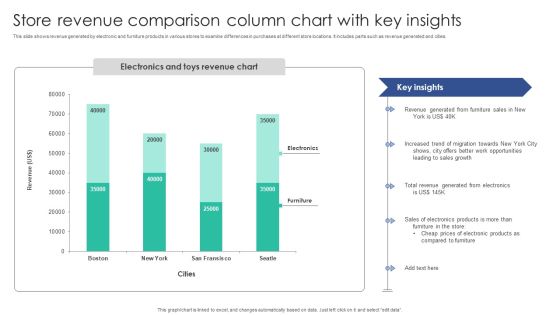
Store Revenue Comparison Column Chart With Key Insights Themes PDF
This slide shows revenue generated by electronic and furniture products in various stores to examine differences in purchases at different store locations. It includes parts such as revenue generated and cities. Showcasing this set of slides titled Store Revenue Comparison Column Chart With Key Insights Themes PDF. The topics addressed in these templates are Revenue Generated, Furniture Sales, Increased Trend. All the content presented in this PPT design is completely editable. Download it and make adjustments in color, background, font etc. as per your unique business setting.

Clustered Column Line Chart Ppt PowerPoint Presentation File Pictures
This is a clustered column line chart ppt powerpoint presentation file pictures. This is a four stage process. The stages in this process are clustered bar, product, planning, business, sales in percentage.
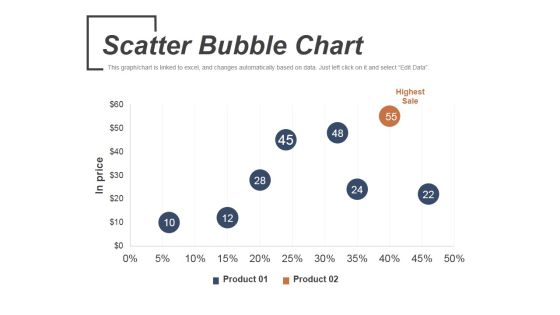
Scatter Bubble Chart Ppt PowerPoint Presentation Infographic Template Graphics
This is a scatter bubble chart ppt powerpoint presentation infographic template graphics. This is a two stage process. The stages in this process are highest sale, product, in price.
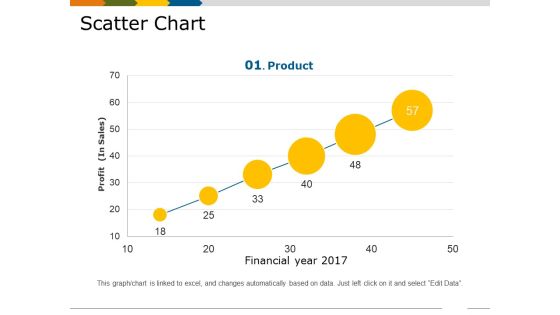
Scatter Chart Template 1 Ppt PowerPoint Presentation Show Slides
This is a scatter chart template 1 ppt powerpoint presentation show slides. This is a six stage process. The stages in this process are financial year, profit in sales, growth, business, marketing, product.
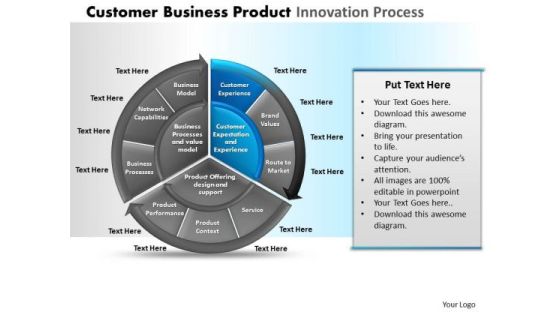
PowerPoint Layouts Sales Pie Chart Diagram Ppt Slide Designs
PowerPoint Layouts Sales Pie Chart Diagram PPT Slide Designs-These high quality powerpoint pre-designed slides and powerpoint templates have been carefully created by our professional team to help you impress your audience. All slides have been created and are 100% editable in powerpoint. Each and every property of any graphic - color, size, orientation, shading, outline etc. can be modified to help you build an effective powerpoint presentation. Any text can be entered at any point in the powerpoint template or slide. Simply DOWNLOAD, TYPE and PRESENT!
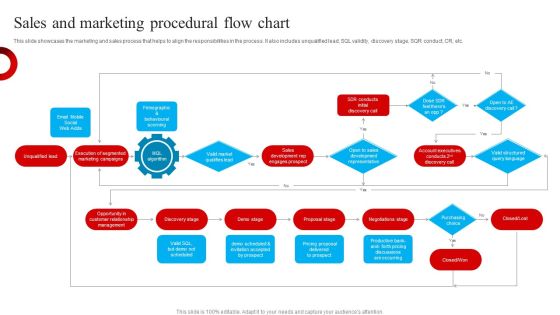
Sales And Marketing Procedural Flow Chart Themes PDF
This slide showcases the marketing and sales process that helps to align the responsibilities in the process. It also includes unqualified lead, SQL validity, discovery stage, SQR conduct, CR, etc. Presenting Sales And Marketing Procedural Flow Chart Themes PDF to dispense important information. This template comprises one stages. It also presents valuable insights into the topics including Discovery Stage, Demo Stage, Proposal Stage . This is a completely customizable PowerPoint theme that can be put to use immediately. So, download it and address the topic impactfully.
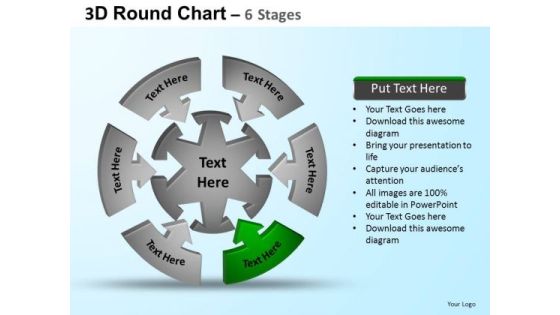
PowerPoint Backgrounds Sales Round Process Flow Chart Ppt Theme
PowerPoint Backgrounds Sales Round Process Flow Chart PPT Theme-These amazing PowerPoint pre-designed slides and PowerPoint templates have been carefully created by our team of experts to help you impress your audience. Our stunning collection of Powerpoint slides are 100% editable and can easily fit in any PowerPoint presentations. By using these animations and graphics in PowerPoint and you can easily make professional presentations. Any text can be entered at any point in the PowerPoint template or slide. Just DOWNLOAD our awesome PowerPoint templates and you are ready to go.

PowerPoint Process Sales Round Process Flow Chart Ppt Themes
PowerPoint Process Sales Round Process Flow Chart PPT Themes-These amazing PowerPoint pre-designed slides and PowerPoint templates have been carefully created by our team of experts to help you impress your audience. Our stunning collection of Powerpoint slides are 100% editable and can easily fit in any PowerPoint presentations. By using these animations and graphics in PowerPoint and you can easily make professional presentations. Any text can be entered at any point in the PowerPoint template or slide. Just DOWNLOAD our awesome PowerPoint templates and you are ready to go.

B2B SAAS Sales Procedural Flow Chart Sample PDF
This slide showcases B2B SaaS sales process to track down the path of a potential clients from the time they discover the brand till the purchase. It also includes prospection, discovery, removing of objections, scheduling, demo, etc. Presenting B2B SAAS Sales Procedural Flow Chart Sample PDF to dispense important information. This template comprises one stages. It also presents valuable insights into the topics including Prospecting Lead Qualification, Refer Elsewhere, Remove Objections. This is a completely customizable PowerPoint theme that can be put to use immediately. So, download it and address the topic impactfully.

Line Bubble Chart Ppt PowerPoint Presentation Portfolio Slide Portrait
This is a line bubble chart ppt powerpoint presentation portfolio slide portrait. This is a six stage process. The stages in this process are highest profit, financial year, profit in sales, growth, business.

Area Chart Financial Ppt PowerPoint Presentation Outline Professional
This is a area chart financial ppt powerpoint presentation outline professional. This is a four stage process. The stages in this process are product, sales in percentage, financial year.

PowerPoint Layouts Sales Pie Chart With Arrows Ppt Templates
PowerPoint Layouts Sales Pie Chart with Arrows PPT Templates-These amazing PowerPoint pre-designed slides and PowerPoint templates have been carefully created by our team of experts to help you impress your audience. Our stunning collection of Powerpoint slides are 100% editable and can easily fit in any PowerPoint presentations. By using these animations and graphics in PowerPoint and you can easily make professional presentations. Any text can be entered at any point in the PowerPoint template or slide. Just DOWNLOAD our awesome PowerPoint templates and you are ready to go.
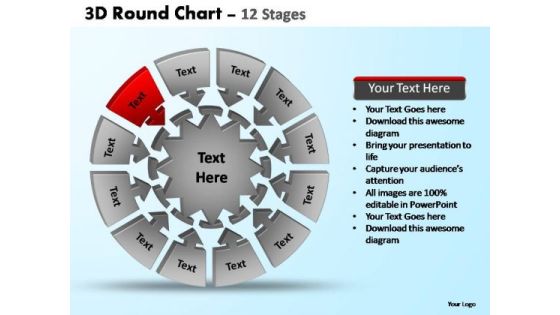
PowerPoint Presentation Sales Pie Chart With Arrows Ppt Templates
PowerPoint Presentation Sales Pie Chart with Arrows PPT Templates-These amazing PowerPoint pre-designed slides and PowerPoint templates have been carefully created by our team of experts to help you impress your audience. Our stunning collection of Powerpoint slides are 100% editable and can easily fit in any PowerPoint presentations. By using these animations and graphics in PowerPoint and you can easily make professional presentations. Any text can be entered at any point in the PowerPoint template or slide. Just DOWNLOAD our awesome PowerPoint templates and you are ready to go.

PowerPoint Slides Sales Round Process Flow Chart Ppt Template
PowerPoint Slides Sales Round Process Flow Chart PPT Template-These amazing PowerPoint pre-designed slides and PowerPoint templates have been carefully created by our team of experts to help you impress your audience. Our stunning collection of Powerpoint slides are 100% editable and can easily fit in any PowerPoint presentations. By using these animations and graphics in PowerPoint and you can easily make professional presentations. Any text can be entered at any point in the PowerPoint template or slide. Just DOWNLOAD our awesome PowerPoint templates and you are ready to go.
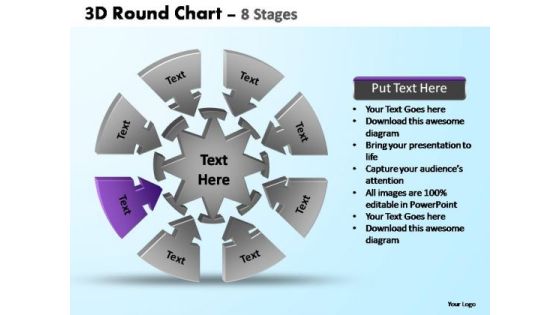
PowerPoint Presentation Sales Pie Chart With Arrows Ppt Backgrounds
PowerPoint Presentation Sales Pie Chart with Arrows PPT Backgrounds-These amazing PowerPoint pre-designed slides and PowerPoint templates have been carefully created by our team of experts to help you impress your audience. Our stunning collection of Powerpoint slides are 100% editable and can easily fit in any PowerPoint presentations. By using these animations and graphics in PowerPoint and you can easily make professional presentations. Any text can be entered at any point in the PowerPoint template or slide. Just DOWNLOAD our awesome PowerPoint templates and you are ready to go.
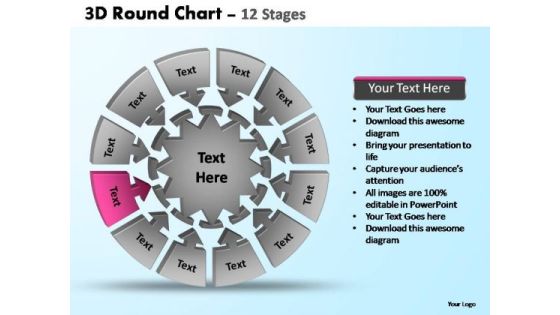
PowerPoint Slides Sales Pie Chart With Arrows Ppt Design Slides
PowerPoint Slides Sales Pie Chart with Arrows PPT Design Slides-These amazing PowerPoint pre-designed slides and PowerPoint templates have been carefully created by our team of experts to help you impress your audience. Our stunning collection of Powerpoint slides are 100% editable and can easily fit in any PowerPoint presentations. By using these animations and graphics in PowerPoint and you can easily make professional presentations. Any text can be entered at any point in the PowerPoint template or slide. Just DOWNLOAD our awesome PowerPoint templates and you are ready to go.
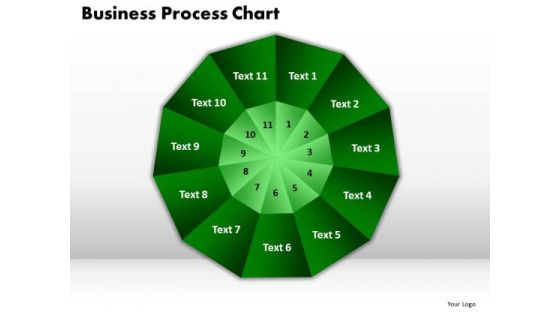
PowerPoint Templates Business Process Chart Success Ppt Themes
PowerPoint Templates Business Process Chart Success PPT Themes-This PowerPoint Diagram will let you express the views about capital and labor, commercialism, market, merchandising, production and distribution, racket, sales, selling, trading, traffic, transaction, undertaking.-PowerPoint Templates Business Process Chart Success PPT Themes
Scatter Bubble Chart Ppt PowerPoint Presentation Infographics Icons
This is a scatter bubble chart ppt powerpoint presentation infographics icons. This is a eight stage process. The stages in this process are highest sale, finance, business, management, marketing, chart.
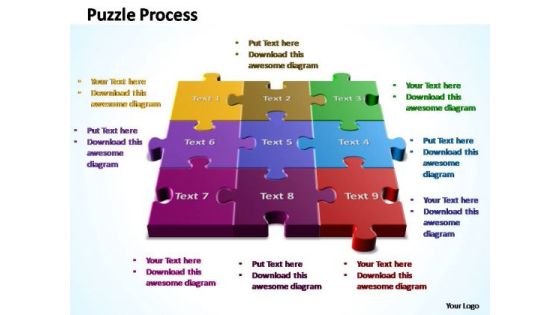
PowerPoint Templates Chart 3d Puzzle Process Ppt Slide
PowerPoint templates Chart 3D Puzzle Process PPT Slide-Puzzle diagram is a visual tool that allows you to create and visualize a sales process. -PowerPoint templates Chart 3D Puzzle Process PPT Slide
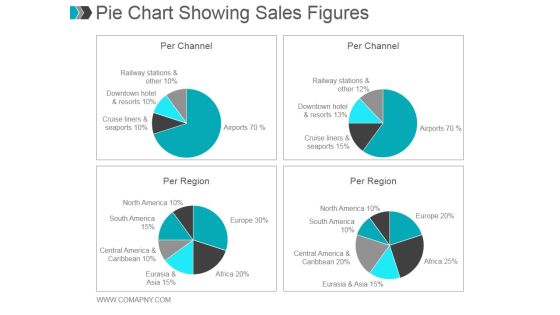
Pie Chart Showing Sales Figures Ppt PowerPoint Presentation Styles
This is a pie chart showing sales figures ppt powerpoint presentation styles. This is a four stage process. The stages in this process are per channel, railway stations, downtown hotel, cruise liners, per region, north america, south america, central america, eurasia and asia.

Area Chart Ppt PowerPoint Presentation Infographics File Formats
This is a area chart ppt powerpoint presentation infographics file formats. This is a two stage process. The stages in this process are area chart, product, sales in percentage, growth, success.
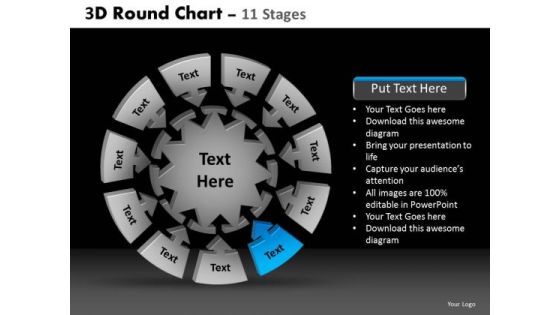
PowerPoint Design Slides Sales Round Chart Ppt Backgrounds
PowerPoint Design Slides Sales Round Chart PPT Backgrounds-These high quality, editable pre-designed powerpoint slides have been carefully created by our professional team to help you impress your audience. Each graphic in every slide is vector based and is 100% editable in powerpoint. Each and every property of any slide - color, size, shading etc can be modified to build an effective powerpoint presentation. Use these slides to convey complex business concepts in a simplified manner. Any text can be entered at any point in the powerpoint slide. Simply DOWNLOAD, TYPE and PRESENT!
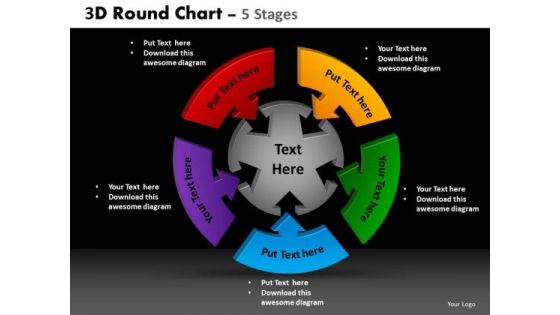
PowerPoint Design Slides Sales Round Chart Ppt Slide
PowerPoint Design Slides Sales Round Chart PPT Slide-These high quality, editable pre-designed powerpoint slides have been carefully created by our professional team to help you impress your audience. Each graphic in every slide is vector based and is 100% editable in powerpoint. Each and every property of any slide - color, size, shading etc can be modified to build an effective powerpoint presentation. Use these slides to convey complex business concepts in a simplified manner. Any text can be entered at any point in the powerpoint slide. Simply DOWNLOAD, TYPE and PRESENT!

Administrative Regulation Organization Chart Ppt PowerPoint Presentation Styles Themes PDF
This is a administrative regulation organization chart ppt powerpoint presentation styles themes pdf template with various stages. Focus and dispense information on five stages using this creative set, that comes with editable features. It contains large content boxes to add your information on topics like president, ceo, cust support, sales manager. You can also showcase facts, figures, and other relevant content using this PPT layout. Grab it now.
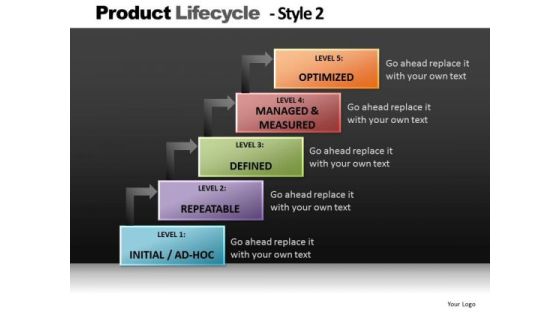
Step Diagram Chart Process PowerPoint Slides And Editable Ppt Templates
Step Diagram Chart Process PowerPoint Slides and Editable PPT templates-These high quality powerpoint pre-designed slides and powerpoint templates have been carefully created by our professional team to help you impress your audience. All slides have been created and are 100% editable in powerpoint. Each and every property of any graphic - color, size, orientation, shading, outline etc. can be modified to help you build an effective powerpoint presentation. Any text can be entered at any point in the powerpoint template or slide. Simply DOWNLOAD, TYPE and PRESENT!These PowerPoint designs and slide layouts can be used to in presentations relating to --Activities, business, clipart, commerce, concept, conceptual, customer, design, diagram, direction, distribution, guidelines, icon, illustration, integration, lifecycle, manage, management, manufacturing, marketing, mba, model, optimize, organization, performance, process, product, resentation, resource, sales, selling, steps, system, theoretical, theory, tool-Step Diagram Chart Process PowerPoint Slides and Editable PPT templates

Steps Process Chart Diagram PowerPoint Slides And Editable PowerPoint Templates
Steps Process Chart Diagram PowerPoint Slides and Editable PowerPoint templates-These high quality powerpoint pre-designed slides and powerpoint templates have been carefully created by our professional team to help you impress your audience. All slides have been created and are 100% editable in powerpoint. Each and every property of any graphic - color, size, orientation, shading, outline etc. can be modified to help you build an effective powerpoint presentation. Any text can be entered at any point in the powerpoint template or slide. Simply DOWNLOAD, TYPE and PRESENT!These PowerPoint designs and slide layouts can be used to in presentations relating to --Activities, business, clipart, commerce, concept, conceptual, customer, design, diagram, direction, distribution, guidelines, icon, illustration, integration, lifecycle, manage, management, manufacturing, marketing, mba, model, optimize, organization, performance, process, product, resentation, resource, sales, selling, steps, system, theoretical, theory, tool-Steps Process Chart Diagram PowerPoint Slides and Editable PowerPoint templates

Business Operations Assessment Organization Chart Ppt Model Graphics Design PDF
This is a business operations assessment organization chart ppt model graphics design pdf template with various stages. Focus and dispense information on five stages using this creative set, that comes with editable features. It contains large content boxes to add your information on topics like president, ceo, cust support, sales manager. You can also showcase facts, figures, and other relevant content using this PPT layout. Grab it now.
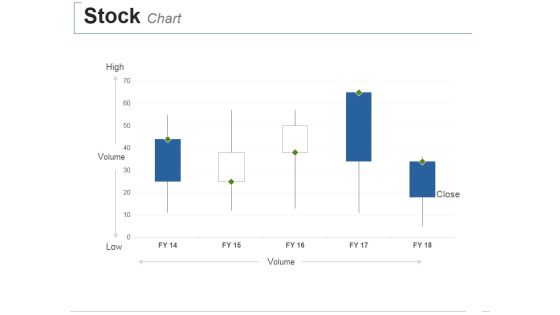
Stock Chart Ppt PowerPoint Presentation Styles Visual Aids
This is a stock chart ppt powerpoint presentation styles visual aids. This is a three stage process. The stages in this process are high, volume, low, close.

Scatter Chart Template 3 Ppt PowerPoint Presentation Styles Demonstration
This is a scatter chart template 3 ppt powerpoint presentation styles demonstration. This is a one stage process. The stages in this process are sales in percentage, finance, business, marketing, growth.
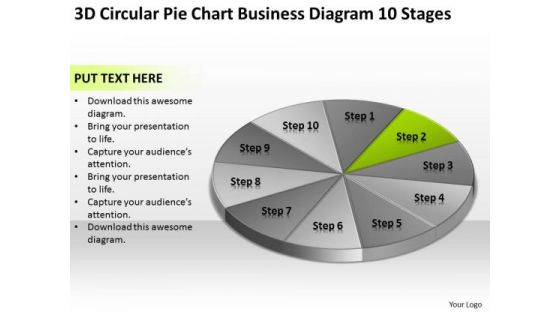
Circular Pie Chart Business Diagram 10 Stages Plan PowerPoint Slides
We present our circular pie chart business diagram 10 stages plan PowerPoint Slides.Present our Business PowerPoint Templates because Our PowerPoint Templates and Slides are conceived by a dedicated team. Use them and give form to your wondrous ideas. Present our Finance PowerPoint Templates because Our PowerPoint Templates and Slides are created with admirable insight. Use them and give your group a sense of your logical mind. Use our Circle Charts PowerPoint Templates because Our PowerPoint Templates and Slides come in all colours, shades and hues. They help highlight every nuance of your views. Download our Shapes PowerPoint Templates because Our PowerPoint Templates and Slides will let your team Walk through your plans. See their energy levels rise as you show them the way. Download and present our Process and Flows PowerPoint Templates because Timeline crunches are a fact of life. Meet all deadlines using our PowerPoint Templates and Slides.Use these PowerPoint slides for presentations relating to Chart, donut, market, isolated, diminishing, rate, downtrend, business, three-dimensional, success, presentation, diagram, circle, uptrend, percentage, graphic, finance, data, stock, holdings, report, marketing, analyzing, trading, graph, illustration, pie, sale, up, money, design, currency, growth, descriptive, representing, painting, moving, progress, part, increases, background, investment, index, financial, multi, counter. The prominent colors used in the PowerPoint template are Green, Gray, White.
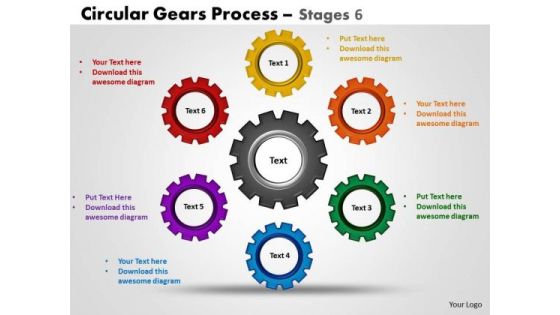
PowerPoint Backgrounds Chart Circular Gears Ppt Slide Designs
PowerPoint Backgrounds Chart Circular Gears PPT Slide Designs--These high quality powerpoint pre-designed slides and powerpoint templates have been carefully created by our professional team to help you impress your audience. All slides have been created and are 100% editable in powerpoint. Each and every property of any graphic - color, size, orientation, shading, outline etc. can be modified to help you build an effective powerpoint presentation. Any text can be entered at any point in the powerpoint template or slide. Simply DOWNLOAD, TYPE and PRESENT!
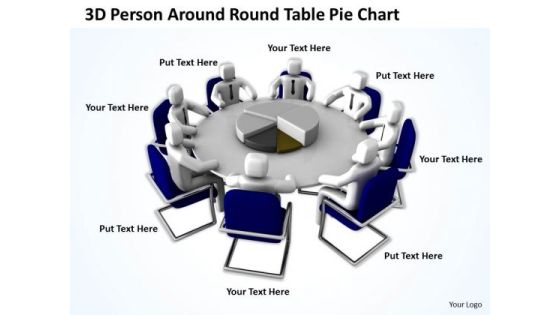
Business Persons 3d Around Table Pie Chart PowerPoint Templates
We present our business persons 3d around table pie chart PowerPoint templates.Download and present our Business PowerPoint Templates because Our PowerPoint Templates and Slides are focused like a searchlight beam. They highlight your ideas for your target audience. Download and present our Circle Charts PowerPoint Templates because Our PowerPoint Templates and Slides will let your words and thoughts hit bullseye everytime. Present our Teamwork PowerPoint Templates because Our PowerPoint Templates and Slides will Activate the energies of your audience. Get their creative juices flowing with your words. Download and present our Future PowerPoint Templates because You have gained great respect for your brilliant ideas. Use our PowerPoint Templates and Slides to strengthen and enhance your reputation. Use our Shapes PowerPoint Templates because You should Ascend the ladder of success with ease. Our PowerPoint Templates and Slides will provide strong and sturdy steps.Use these PowerPoint slides for presentations relating to 3d, arrow, boss, business, businessmen, cgi, chart, communication, company,concept, conference, cooperation, corporate, diagram, director, economy,executive, finance, financial, firm, graph, group, growth, illustration, improvement,increase, job, leader, manager, market, meeting, men, money, office, people,presentation, pie, project, render, report, rise, sales, success,successful, symbol, table, team, teamwork, up, work. The prominent colors used in the PowerPoint template are Blue, White, Gray.

Column Chart Ppt PowerPoint Presentation Layouts Design Inspiration
This is a column chart ppt powerpoint presentation layouts design inspiration. This is a two stage process. The stages in this process are sales in percentage, financial year in, graph, business, finance, marketing.
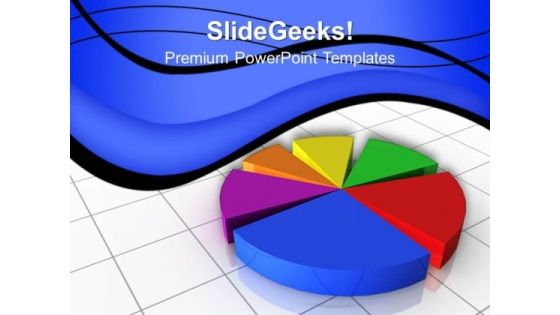
Pie Chart Marketing PowerPoint Templates And PowerPoint Themes 1012
Pie Chart Marketing PowerPoint Templates And PowerPoint Themes 1012-Use this Pie Chart Based PowerPoint Template to illustrate the main components required for the Growth of the Company. It shows seven major factors required. Now use this template to enlighten your team and colleagues on the critical factors involved. Use our PowerPoint templates to spread the good word, be assured by all you will be keenly heard.-Pie Chart Marketing PowerPoint Templates And PowerPoint Themes 1012-This PowerPoint template can be used for presentations relating to-Vector Pie Chart, Marketing, Business, Sales, Success, Competition
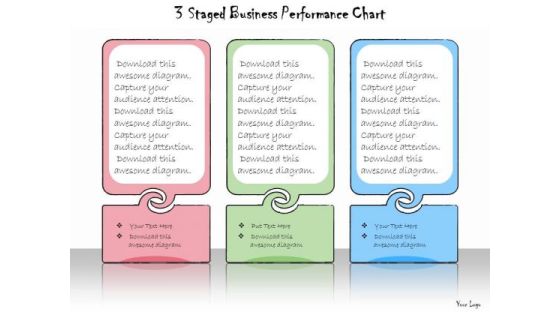
Ppt Slide 3 Staged Business Performance Chart Marketing Plan
Get Out Of The Dock With Our PPT Slide 3 staged business performance chart marketing plan Powerpoint Templates. Your Mind Will Be Set Free.

Ppt Slide 4 Stages Circular Flow Chart Marketing Plan
Deliver The Right Dose With Our PPT Slide 4 stages circular flow chart marketing plan Powerpoint Templates. Your Ideas Will Get The Correct Illumination.
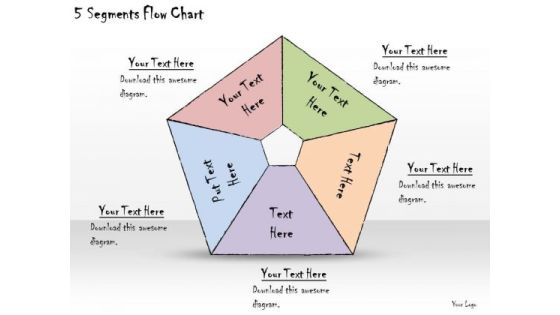
Ppt Slide 5 Segments Flow Chart Marketing Plan
Document Your Views On Our PPT Slide 5 Segments Flow Chart Marketing Plan Powerpoint Templates. They Will Create A Strong Impression.
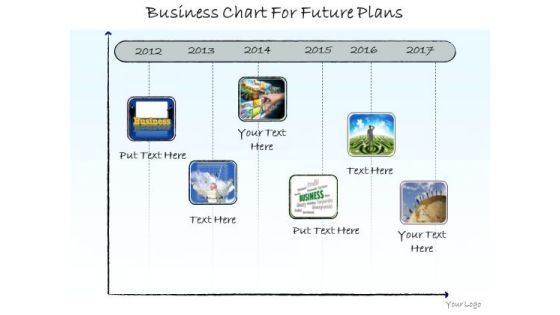
Ppt Slide Business Chart For Future Plans Consulting Firms
Be A Donor Of Great Ideas. Display Your Charity On Our PPT Slide Business Chart For Future Plans Consulting Firms Powerpoint Templates.
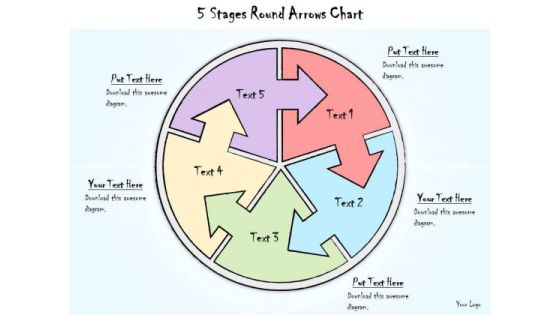
Ppt Slide 5 Stages Round Arrows Chart Business Diagrams
Be The Doer With Our PPT Slide 5 Stages Round Arrows Chart Business Diagrams Powerpoint Templates. Put Your Thoughts Into Practice.
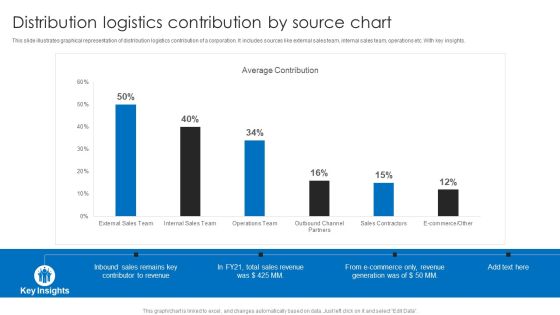
Distribution Logistics Contribution By Source Chart Ppt Model Guidelines PDF
This slide illustrates graphical representation of distribution logistics contribution of a corporation. It includes sources like external sales team, internal sales team, operations etc. With key insights. Showcasing this set of slides titled Distribution Logistics Contribution By Source Chart Ppt Model Guidelines PDF. The topics addressed in these templates are Average Contribution, Total Sales Revenue, E Commerce. All the content presented in this PPT design is completely editable. Download it and make adjustments in color, background, font etc. as per your unique business setting.

Bar Chart Representing Competitive Customer Relationship Benefits Demonstration PDF
This slide focuses on the graphical representation of benefits arises from customer relationship management which covers improving customer services, enhances sales, managing customer renewals, minimizes costs, generates new business, increase customer retention, etc. Showcasing this set of slides titled Bar Chart Representing Competitive Customer Relationship Benefits Demonstration PDF. The topics addressed in these templates are Management Software, Customer Relationship, Costs Since. All the content presented in this PPT design is completely editable. Download it and make adjustments in color, background, font etc. as per your unique business setting.
Six Months Business Valuation Chart Ppt Styles Icons PDF
This slide shows the 6 months graph to measure company valuation. It is representing that highest valuation of company was calculated in the month of June due to increase in sales. Pitch your topic with ease and precision using this Six Months Business Valuation Chart Ppt Styles Icons PDF. This layout presents information on Increase Sales, Company Valuation. It is also available for immediate download and adjustment. So, changes can be made in the color, design, graphics or any other component to create a unique layout.

 Home
Home