Waterfall Chart
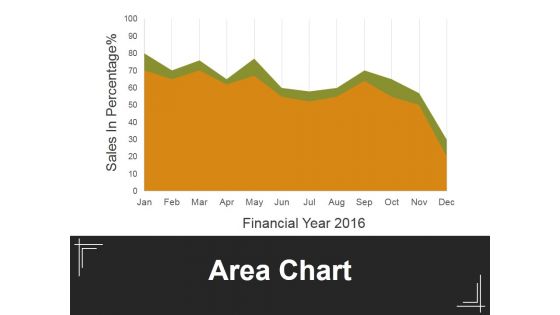
Area Chart Ppt PowerPoint Presentation Slides Deck
This is a area chart ppt powerpoint presentation slides deck. This is a two stage process. The stages in this process are financial, sales in percentage, business, marketing, management.
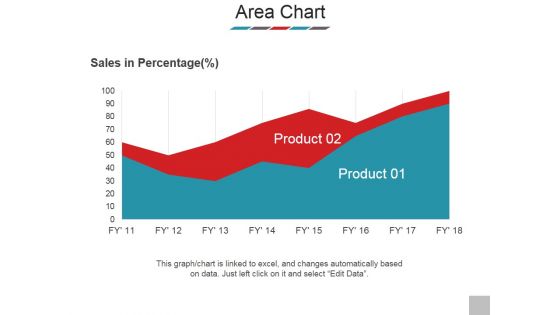
Area Chart Ppt PowerPoint Presentation Styles Images
This is a area chart ppt powerpoint presentation styles images. This is a two stage process. The stages in this process are sales in percentage, product, graph, business, marketing.

Sales Diagram Thermometer Measurement Chart Marketing Diagram
Your Grasp Of Economics Is Well Known. Help Your Audience Comprehend Issues With Our Sales Diagram Thermometer Measurement Chart Marketing Diagram Powerpoint Templates.

PowerPoint Slides Sales Arrows Chart Ppt Theme
PowerPoint Slides Sales Arrows Chart PPT Theme Business Power Points-Explore the various directions and layers existing in your in your plans and processes. Unravel the desired and essential elements of your overall strategy. Explain the relevance of the different layers and stages and directions in getting down to your core competence, ability and desired result.-These amazing PowerPoint pre-designed slides and PowerPoint templates have been carefully created by our team of experts to help you impress your audience. Our stunning collection of Powerpoint slides are 100% editable and can easily fit in any PowerPoint presentations. By using these animations and graphics in PowerPoint and you can easily make professional presentations. Any text can be entered at any point in the PowerPoint template or slide. Just DOWNLOAD our awesome PowerPoint templates and you are ready to go.

Ppt Slide Traffic Signals Chart Strategic Planning
Draw Out The Best In You With Our PPT Slide Traffic Signals Chart Strategic Planning Powerpoint Templates. Let Your Inner Brilliance Come To The Surface.
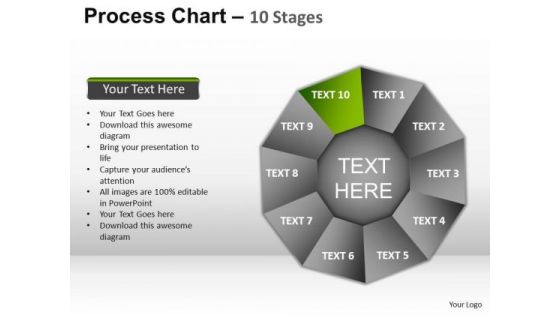
PowerPoint Templates Sales Process Chart Ppt Designs
PowerPoint Templates Sales process chart PPT Designs-The Circle of Life - a concept emmbedded in our minds and hence easy to comprehend. Life and Business is made up of processes comprising stages that flow from one to another. An excellent graphic to attract the attention of and understanding by your audience to improve earnings.-These amazing PowerPoint pre-designed slides and PowerPoint templates have been carefully created by our team of experts to help you impress your audience. Our stunning collection of Powerpoint slides are 100% editable and can easily fit in any PowerPoint presentations. By using these animations and graphics in PowerPoint and you can easily make professional presentations. Any text can be entered at any point in the PowerPoint template or slide. Just DOWNLOAD our awesome PowerPoint templates and you are ready to go.
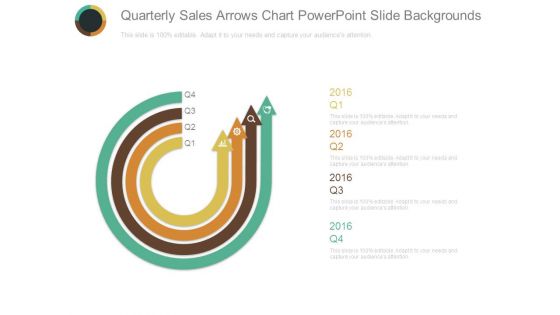
Quarterly Sales Arrows Chart Powerpoint Slide Backgrounds
This is a quarterly sales arrows chart powerpoint slide backgrounds. This is a four stage process. The stages in this process are arrows, business, management, marketing, icons.

Yearly Sales Circular Chart Powerpoint Shapes
This is a yearly sales circular chart powerpoint shapes. This is a six stage process. The stages in this process are year, planning, business, process, success.
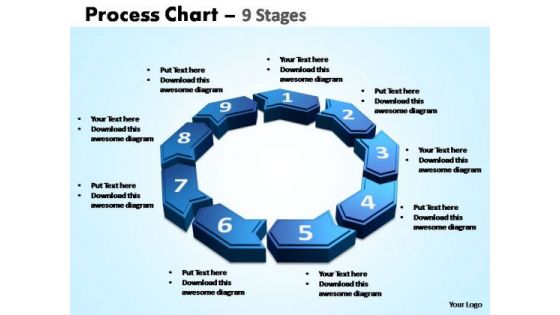
PowerPoint Slidelayout Sales Process Chart Ppt Designs
PowerPoint Slidelayout Sales process chart PPT Designs-The Circle of Life - a concept emmbedded in our minds and hence easy to comprehend. Life and Business is made up of processes comprising stages that flow from one to another. An excellent graphic to attract the attention of and understanding by your audience to improve earnings.-These amazing PowerPoint pre-designed slides and PowerPoint templates have been carefully created by our team of experts to help you impress your audience. Our stunning collection of Powerpoint slides are 100% editable and can easily fit in any PowerPoint presentations. By using these animations and graphics in PowerPoint and you can easily make professional presentations. Any text can be entered at any point in the PowerPoint template or slide. Just DOWNLOAD our awesome PowerPoint templates and you are ready to go.
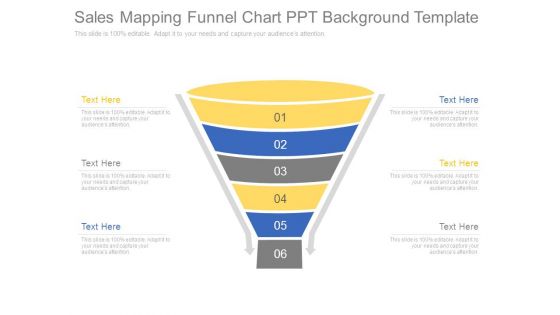
Sales Mapping Funnel Chart Ppt Background Template
This is a sales mapping funnel chart ppt background template. This is a six stage process. The stages in this process are funnel, process, marketing, strategy, sales.
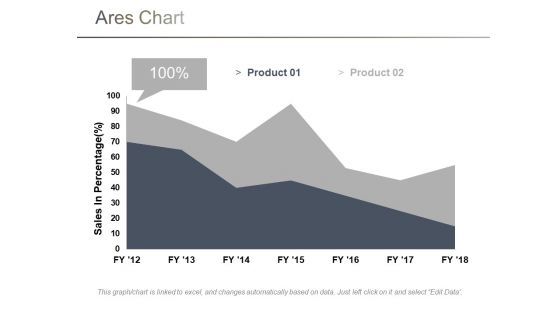
Area Chart Ppt PowerPoint Presentation Model Influencers
This is a area chart ppt powerpoint presentation model influencers. This is a two stage process. The stages in this process are sales in percentage, chart, business, marketing, finance.

Line Chart Ppt PowerPoint Presentation Infographics Infographics
This is a line chart ppt powerpoint presentation infographics infographics. This is a two stage process. The stages in this process are product, sales in percentage, financial year, line chart, finance.
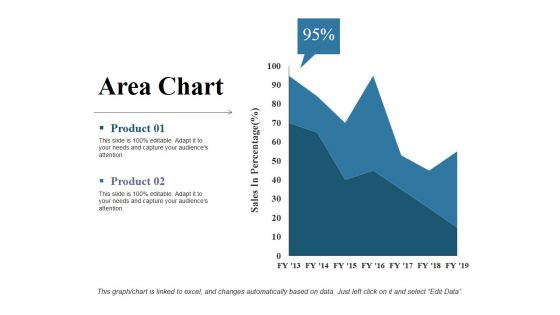
Area Chart Ppt PowerPoint Presentation Slides Example
This is a area chart ppt powerpoint presentation slides example. This is a two stage process. The stages in this process are sales in percentage, product, area chart, business, finance.

Line Chart Ppt PowerPoint Presentation Gallery Rules
This is a line chart ppt powerpoint presentation gallery rules. This is a two stage process. The stages in this process are financial years, product, sales in percentage, line chart, growth.
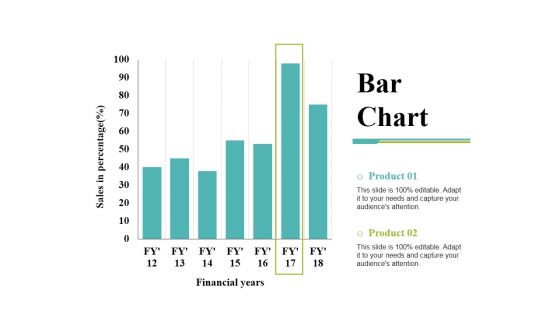
Bar Chart Ppt PowerPoint Presentation Inspiration Demonstration
This is a bar chart ppt powerpoint presentation inspiration demonstration. This is a two stage process. The stages in this process are bar chart, financial years, sales in percentage, product, finance.

Line Chart Ppt PowerPoint Presentation Gallery Templates
This is a line chart ppt powerpoint presentation gallery templates. This is a two stage process. The stages in this process are product, financial years, sales in percentage, line chart.

Bar Chart Ppt PowerPoint Presentation Model Picture
This is a bar chart ppt powerpoint presentation model picture. This is a two stage process. The stages in this process are product, sales in percentage, financial years, bar chart.
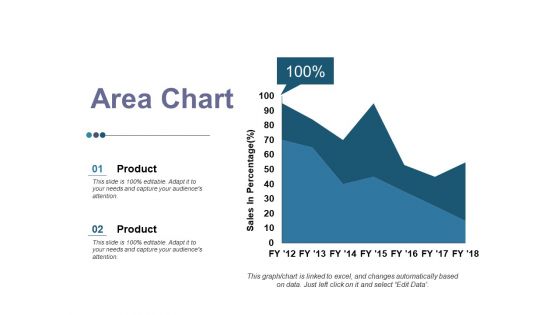
Area Chart Ppt PowerPoint Presentation Inspiration Graphics
This is a area chart ppt powerpoint presentation inspiration graphics. This is a two stage process. The stages in this process are product, area chart, business, growth, sales in percentage.

Column Chart Ppt PowerPoint Presentation Slides Show
This is a column chart ppt powerpoint presentation slides show. This is a two stage process. The stages in this process are column chart, product, sales in percentage, financial year, growth.
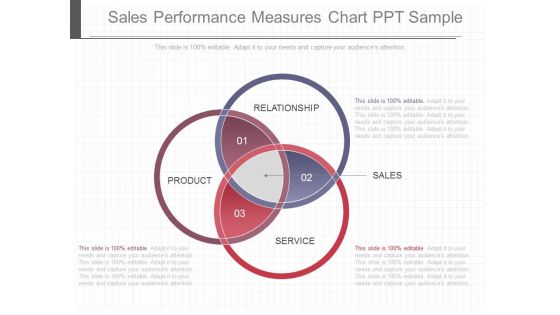
Sales Performance Measures Chart Ppt Sample
This is a sales performance measures chart ppt sample. This is a three stage process. The stages in this process are product, relationship, service, sales.

Sales Force Automation Template Chart Presentation Layouts
This is a sales force automation template chart presentation layouts. This is a seven stage process. The stages in this process are sales force automation, very unsatisfied.

Sales Conversion Process Chart Powerpoint Show
This is a sales conversion process chart powerpoint show. This is a six stage process. The stages in this process are invoicing, finance, sales, analysis, synthesis, knowledge.
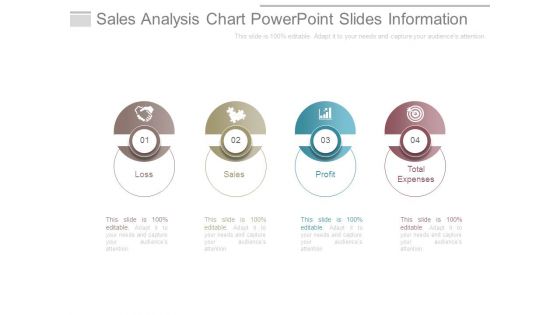
Sales Analysis Chart Powerpoint Slides Information
This is a sales analysis chart powerpoint slides information. This is a four stage process. The stages in this process are loss, sales, profit, total expenses.
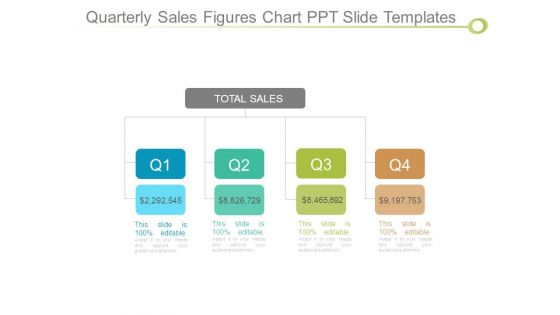
Quarterly Sales Figures Chart Ppt Slide Templates
This is a quarterly sales figures chart ppt slide templates. This is a four stage process. The stages in this process are total sales, business, management, marketing, success.
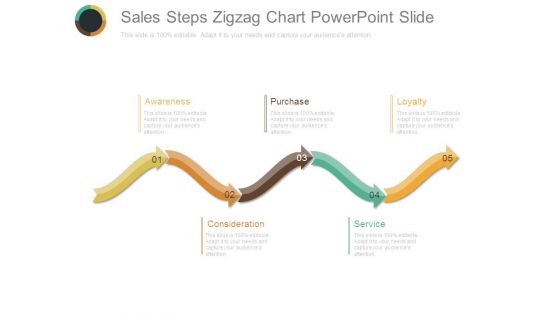
Sales Steps Zigzag Chart Powerpoint Slide
This is a sales steps zigzag chart powerpoint slide. This is a five stage process. The stages in this process are awareness, purchase, loyalty, consideration, service.
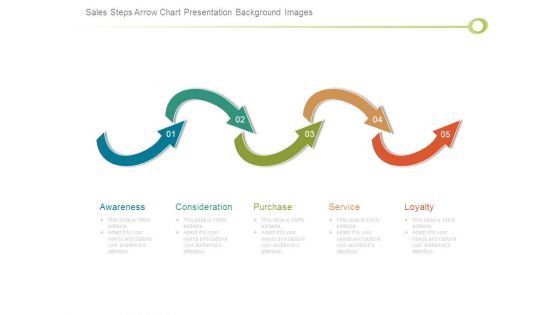
Sales Steps Arrow Chart Presentation Background Images
This is a sales steps arrow chart presentation background images. This is a five stage process. The stages in this process are awareness, consideration, purchase, service, loyalty.
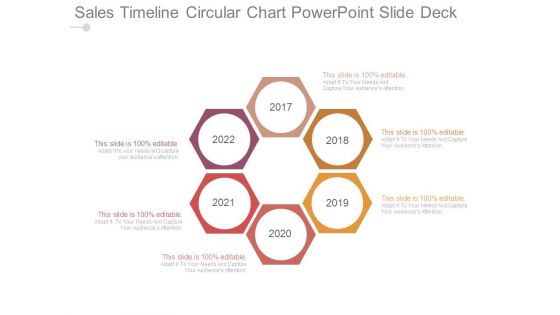
Sales Timeline Circular Chart Powerpoint Slide Deck
This is a sales timeline circular chart powerpoint slide deck. This is a six stage process. The stages in this process are process, analysis, management, marketing, business.

Bar Chart Business PowerPoint Template 0810
3D illustration of a colorful multi-segment bar chart over top of a light blue textured background with plenty of open space for your text
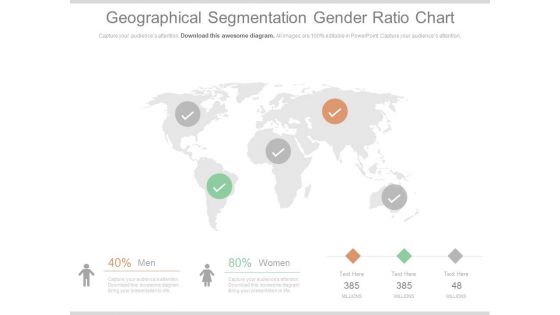
Geographical Segmentation Gender Ratio Chart Ppt Slides
This is a geographical segmentation gender ratio chart ppt slides. This is a one stage process. The stages in this process are global, geographical, business, success.

Column Chart Ppt PowerPoint Presentation Show Shapes
This is a column chart ppt powerpoint presentation show shapes. This is a two stage process. The stages in this process are sales, product, business, management, finance.

Sales Diagram Origanization Chart Business Framework Model
Discover Decisive Moments With Our sales diagram Origanization Chart Business Framework Model Powerpoint Templates. They Help Make That Crucial Difference. Our sales diagram Origanization Chart Business Framework Model Powerpoint Templates Will Help Make Your Dreams Come True. Your Thoughts Will Weave The Magic For You.

Business Framework PowerPoint Chart Variations PowerPoint Presentation
This image slide displays comparison chart template. This innovative image slide has been designed with pie charts to represent yearly progress. This image slide is 100% editable. You may change color, size and orientation of any icon to your liking. This image slide may be used in school, business and social presentations. Make your presentations interesting using this image slide.
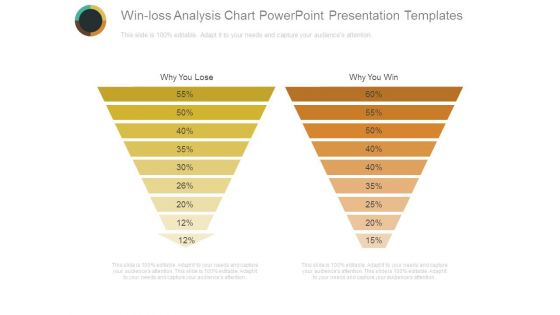
Win Loss Analysis Chart Powerpoint Presentation Templates
This is a win loss analysis chart powerpoint presentation templates. This is a two stage process. The stages in this process are business, management, marketing, sales, funnel.

Company Product Sales Forecast Chart Topics PDF
Deliver and pitch your topic in the best possible manner with this company product sales forecast chart topics pdf. Use them to share invaluable insights on company product sales forecast chart and impress your audience. This template can be altered and modified as per your expectations. So, grab it now.

Percentage Data Growth Chart Powerpoint Slides
This PowerPoint template has been designed with percentage data growth chart. Download this PPT chart to depict financial ratio analysis. This PowerPoint slide is of great help in the business sector to make realistic presentations and provides effective way of presenting your newer thoughts.
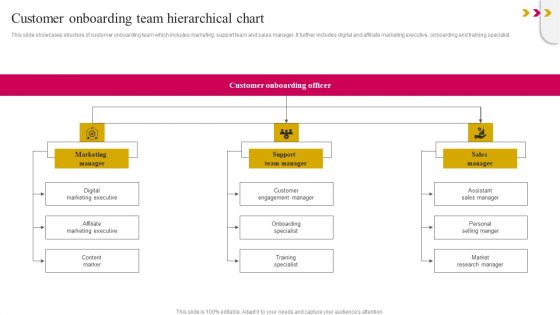
Customer Onboarding Team Hierarchical Chart Designs PDF
This slide showcases structure of customer onboarding team which includes marketing, support team and sales manager. It further includes digital and affiliate marketing executive, onboarding and training specialist. Make sure to capture your audiences attention in your business displays with our gratis customizable Customer Onboarding Team Hierarchical Chart Designs PDF. These are great for business strategies, office conferences, capital raising or task suggestions. If you desire to acquire more customers for your tech business and ensure they stay satisfied, create your own sales presentation with these plain slides.

Graph Chart Business PowerPoint Template 0810
illustration composed by charts word map and globe

Bus Chart Business PowerPoint Template 1010
Business strategy organizational charts and graphs for success
Area Chart Ppt PowerPoint Presentation Icon Brochure
This is a area chart ppt powerpoint presentation icon brochure. This is a two stage process. The stages in this process are product, sales in percentage, growth, success.
Combo Chart Ppt PowerPoint Presentation Icon Rules
This is a combo chart ppt powerpoint presentation icon rules. This is a ten stage process. The stages in this process are cumulative, value, sales, graph, business.
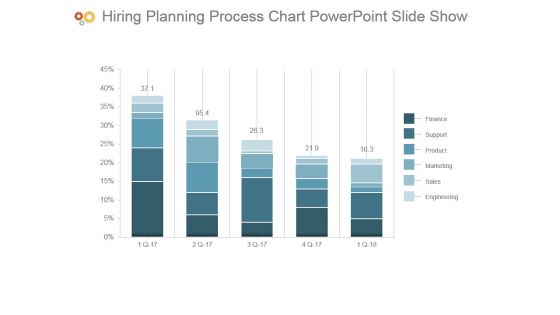
Hiring Planning Process Chart Powerpoint Slide Show
This is a hiring planning process chart powerpoint slide show. This is a five stage process. The stages in this process are finance, support, product, marketing, sales, engineering.
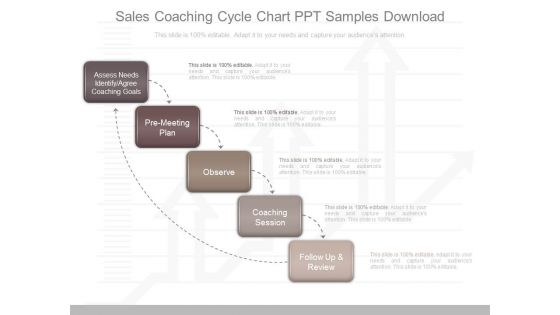
Sales Coaching Cycle Chart Ppt Samples Download
This is a sales coaching cycle chart ppt samples download. This is a five stage process. The stages in this process are assess needs identify agree coaching goals, pre meeting plan, observe, coaching session, follow up and review.
Company Product Sales Forecast Chart Icons PDF
This slide shows the Product sales forecast table with Product names along with price per unit and total units sold for the current as well as the projected period till the year 2023. Deliver an awe inspiring pitch with this creative company product sales forecast chart icons pdf bundle. Topics like company product sales forecast chart can be discussed with this completely editable template. It is available for immediate download depending on the needs and requirements of the user.

Online Sales Flow Chart Process Infographics PDF
This slide shows online sales process through flow chart diagram. It includes various stages such as order received, customer confirmation mail, stock distribution, etc. Showcasing this set of slides titled Online Sales Flow Chart Process Infographics PDF. The topics addressed in these templates are Customers, Product, Payment. All the content presented in this PPT design is completely editable. Download it and make adjustments in color, background, font etc. as per your unique business setting.
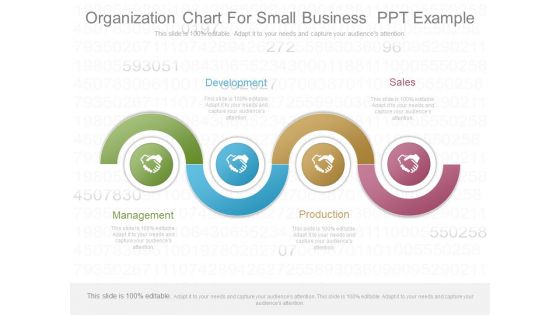
Organization Chart For Small Business Ppt Example

Business Organizational Chart Powerpoint Templates Download
This is a business organizational chart powerpoint templates download. This is a four stage process. The stages in this process are marketing, sales, production, finance.

Scatter Chart Ppt PowerPoint Presentation Slide Download
This is a scatter chart ppt powerpoint presentation slide download. This is a eight stage process. The stages in this process are dollars, sales in percentage, business, marketing.
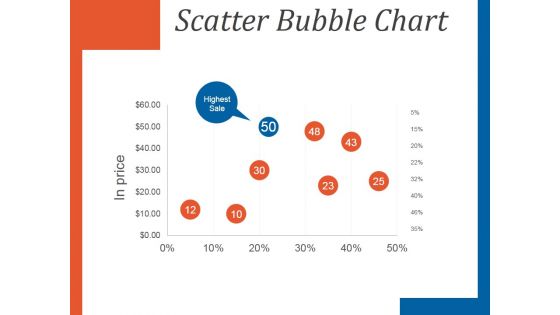
Scatter Bubble Chart Ppt PowerPoint Presentation Slides
This is a scatter bubble chart ppt powerpoint presentation slides. This is a eight stage process. The stages in this process are in price, highest sale, business, management.
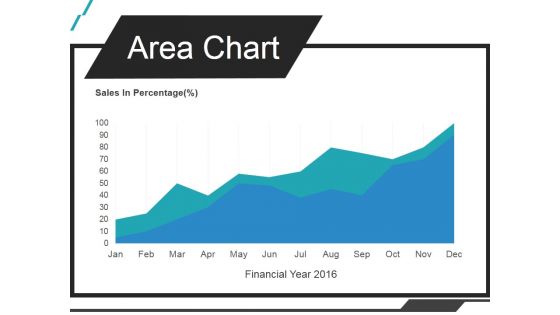
Area Chart Ppt PowerPoint Presentation Infographics
This is a area chart ppt powerpoint presentation infographics. This is a one stage process. The stages in this process are sales in percentage, jan, feb, mar, apr.
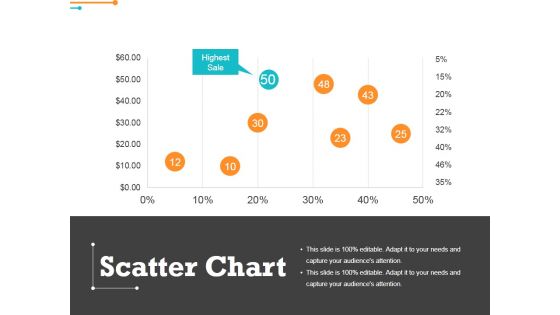
Scatter Chart Ppt PowerPoint Presentation Outline Graphics
This is a scatter chart ppt powerpoint presentation outline graphics. This is a eight stage process. The stages in this process are highest sale, percentage, finance, business.
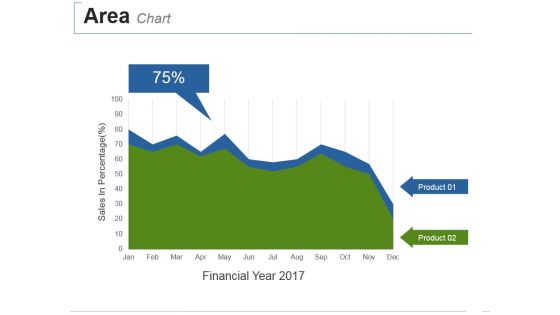
Area Chart Ppt PowerPoint Presentation Summary Deck
This is a area chart ppt powerpoint presentation summary deck. This is a two stage process. The stages in this process are sales in percentage, financial year.

Scatter Chart Ppt PowerPoint Presentation Summary Deck
This is a scatter chart ppt powerpoint presentation summary deck. This is a nine stage process. The stages in this process are product, sales in percentage, growth, success.

Area Chart Ppt PowerPoint Presentation Outline Objects
This is a area chart ppt powerpoint presentation outline objects. This is a two stage process. The stages in this process are product, sales in percentage, financial year.
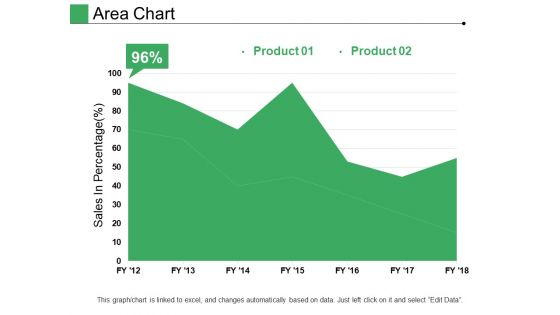
Area Chart Ppt PowerPoint Presentation Pictures Designs
This is a area chart ppt powerpoint presentation pictures designs. This is a two stage process. The stages in this process are product, sales in percentage, growth, success.

Line Chart Ppt PowerPoint Presentation Pictures Layout
This is a line chart ppt powerpoint presentation pictures layout. This is a two stage process. The stages in this process are product, financial years, sales in percentage.

Area Chart Ppt PowerPoint Presentation Professional Grid
This is a area chart ppt powerpoint presentation professional grid. This is a two stage process. The stages in this process are product, sales in percentage, business.
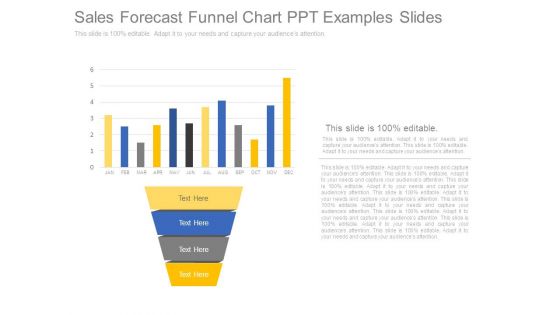
Sales Forecast Funnel Chart Ppt Examples Slides
This is a sales forecast funnel chart ppt examples slides. This is a four stage process. The stages in this process are jan, feb, mar, apr, may, jun, jul, aug, sep, oct, nov, dec.

Business Chart Globe PowerPoint Template 1010
illustration composed by charts word map and globe
Tracking Sales Performance Chart Ppt Example
This is a tracking sales performance chart ppt example. This is a eight stage process. The stages in this process are efficiency, effectiveness, profits, cost per sale, roi, profit sale, convert to sale, cost contact, conversion, contacts.
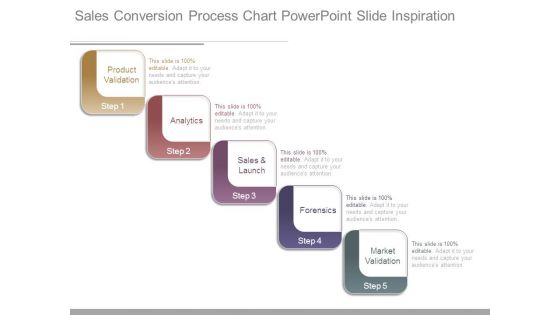
Sales Conversion Process Chart Powerpoint Slide Inspiration
This is a sales conversion process chart powerpoint slide inspiration. This is a five stage process. The stages in this process are product validation, analytics, sales and launch, forensics, market validation.
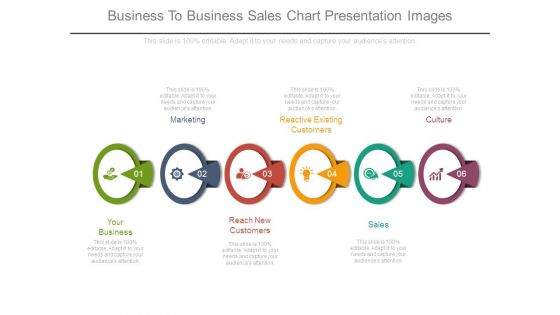
Business To Business Sales Chart Presentation Images
This is a business to business sales chart presentation images. This is a six stage process. The stages in this process are your business, marketing, reactive existing customers, culture, reach new customers, sales.
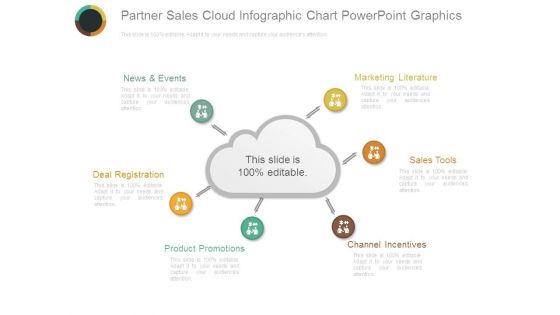
Partner Sales Cloud Infographic Chart Powerpoint Graphics
This is a partner sales cloud infographic chart powerpoint graphics. This is a six stage process. The stages in this process are news and events, marketing literature, sales tools, channel incentives, product promotions, deal registration.
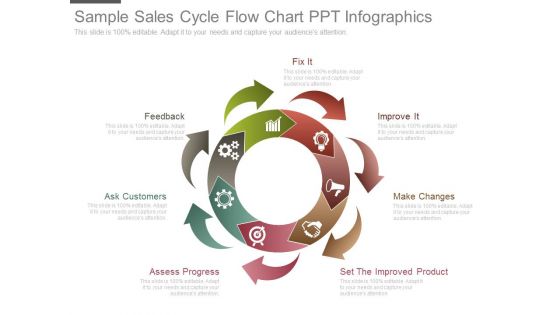
Sample Sales Cycle Flow Chart Ppt Infographics
This is a sample sales cycle flow chart ppt infographics. This is a seven stage process. The stages in this process are fix it, feedback, ask customers, assess progress, set the improved product, make changes, improve it.
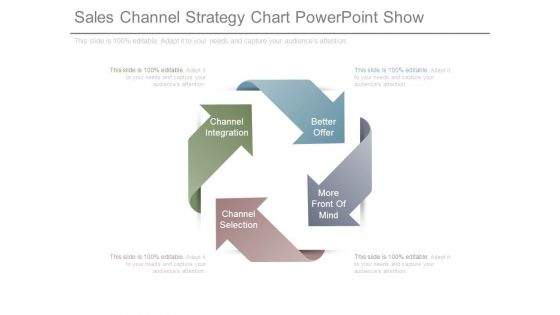
Sales Channel Strategy Chart Powerpoint Show
This is a sales channel strategy chart powerpoint show. This is a four stage process. The stages in this process are channel integration, better offer, channel selection, more front of mind.

Total Sales Improvement Strategies Chart Ppt Sample
This is a total sales improvement strategies chart ppt sample. This is a six stage process. The stages in this process are grow the market, stimulate demand, customers, compliance, systems, minimizing costs.

Sales Deal Steps Funnel Chart Ppt Templates
This is a sales deal steps funnel chart ppt templates. This is a eight stage process. The stages in this process are discovery, pre qualification, qualification, solution design, evaluation, decision, negotiation, closed.
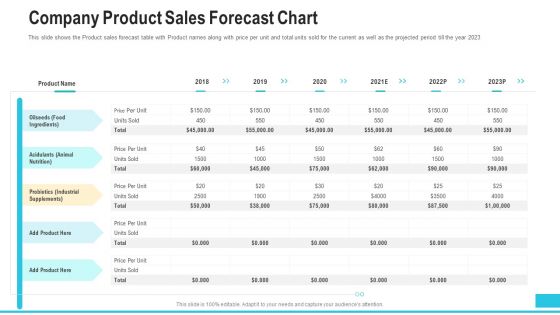
Company Product Sales Forecast Chart Download PDF
This slide shows the Product sales forecast table with Product names along with price per unit and total units sold for the current as well as the projected period till the year 2023. Deliver an awe inspiring pitch with this creative company product sales forecast chart download pdf bundle. Topics like company product sales forecast chart can be discussed with this completely editable template. It is available for immediate download depending on the needs and requirements of the user.
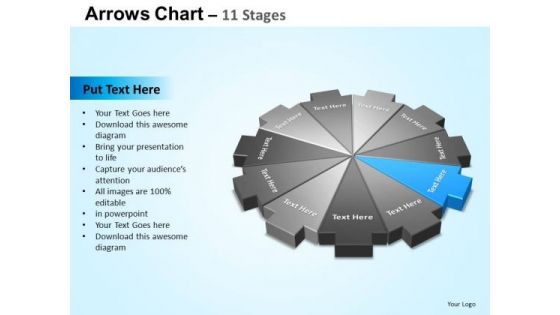
PowerPoint Templates Sales Arrows Chart Ppt Theme
PowerPoint_Templates_Sales_Arrows_Chart_PPT_Theme-Explore the various directions and layers existing in your in your plans and processes. Unravel the desired and essential elements of your overall strategy. Explain the relevance of the different layers and stages and directions in getting down to your core competence, ability and desired result.-These amazing PowerPoint pre-designed slides and PowerPoint templates have been carefully created by our team of experts to help you impress your audience. Our stunning collection of Powerpoint slides are 100% editable and can easily fit in any PowerPoint presentations. By using these animations and graphics in PowerPoint and you can easily make professional presentations. Any text can be entered at any point in the PowerPoint template or slide. Just DOWNLOAD our awesome PowerPoint templates and you are ready to go.
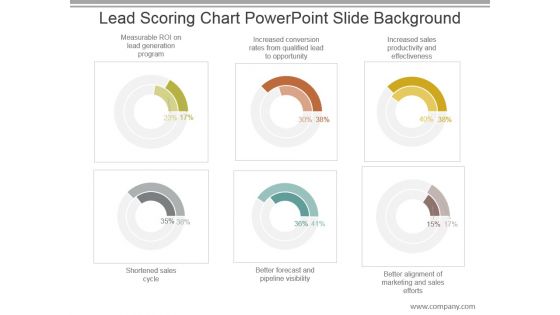
Lead Scoring Chart Powerpoint Slide Background
This is a lead scoring chart powerpoint slide background. This is a six stage process. The stages in this process are measurable roi on lead generation program, increased conversion rates from qualified lead to opportunity, increased sales productivity and effectiveness, shortened sales cycle, better forecast and pipeline visibility, better alignment of marketing and sales efforts.
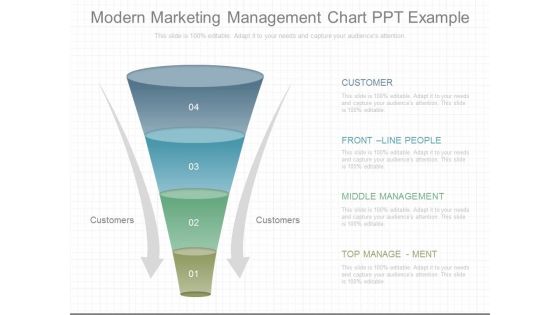
Modern Marketing Management Chart Ppt Example
This is a modern marketing management chart ppt example. This is a four stage process. The stages in this process are customer, customers, front line people, middle management, top management.
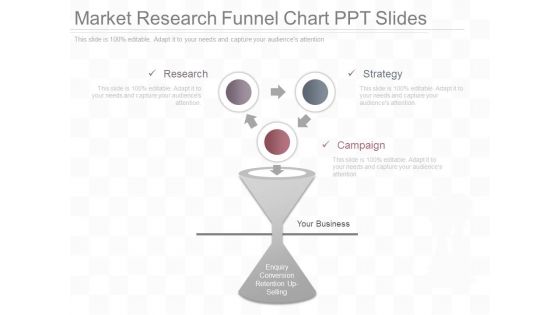
Market Research Funnel Chart Ppt Slides
This is a market research funnel chart ppt slides. This is a three stage process. The stages in this process are enquiry conversion retention up selling, your business, research, campaign, strategy.
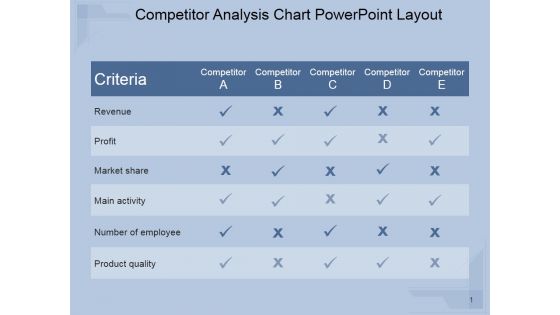
Competitor Analysis Chart Ppt PowerPoint Presentation Visuals
This is a competitor analysis chart ppt powerpoint presentation visuals. This is a five stage process. The stages in this process are revenue, profit, market share, main activity, number of employee, product quality.
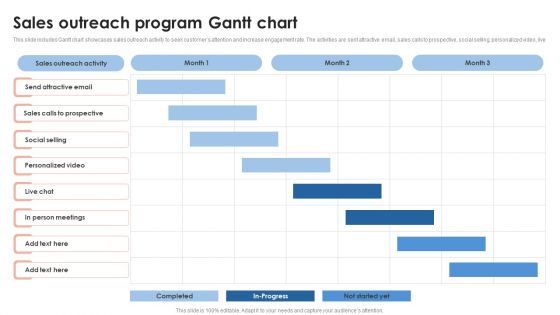
Sales Outreach Program Gantt Chart Infographics PDF
This slide includes Gantt chart showcases sales outreach activity to seek customers attention and increase engagement rate. The activities are sent attractive email, sales calls to prospective, social selling, personalized video, live chat and personal meeting. Pitch your topic with ease and precision using this Sales Outreach Program Gantt Chart Infographics PDF. This layout presents information on Attractive Email, Personalized Video, Person Meetings. It is also available for immediate download and adjustment. So, changes can be made in the color, design, graphics or any other component to create a unique layout.
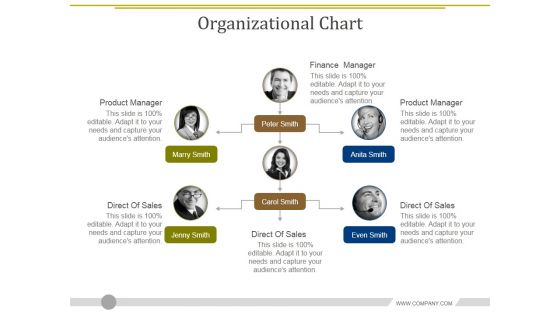
Organizational Chart Ppt PowerPoint Presentation Layouts Demonstration
This is a organizational chart ppt powerpoint presentation layouts demonstration. This is a six stage process. The stages in this process are finance manager, product manager, direct of sales, direct of sales, direct of sales.
Bar Chart Ppt PowerPoint Presentation Icon Demonstration
This is a bar chart ppt powerpoint presentation icon demonstration. This is a seven stage process. The stages in this process are product, sales in percentage, financial year, graph.

Bar Chart Ppt PowerPoint Presentation Outline Backgrounds
This is a bar chart ppt powerpoint presentation outline backgrounds. This is a one stage process. The stages in this process are sales in percentage, financial years, product, bar graph, finance.

Cycle Process Flow Chart Powerpoint Show
This is a cycle process flow chart powerpoint show. This is a six stage process. The stages in this process are sales and marketing, bidding process, requirements analysis, sale of good, production of goods, purchase of raw materials.

Project Management Resource Management Chart Slides PDF
Purpose of this slide is to showcase project resource planning chart that helps organization in optimum utilization of resources illustrating project name, manager, resources, department and cost. Purpose of this slide is to showcase project resource planning chart that helps organization in optimum utilization of resources illustrating project name, manager, resources, department and cost. Pitch your topic with ease and precision using this Project Management Resource Management Chart Slides PDF. This layout presents information on Training Customer Service, Developing Internal Links, Sales. It is also available for immediate download and adjustment. So, changes can be made in the color, design, graphics or any other component to create a unique layout.

Business Framework PowerPoint Bubble Chart PowerPoint Presentation
This innovative image slide has been designed with graphic of bubble chart to depict any information which requires visual presentation. This image slide is 100% editable. You may change color, size and orientation of any icon to your liking. This image slide may be used in school, business and social presentations. Make your presentations interesting using this image slide.

Sales Performance Wheel Chart Ppt Examples Professional
This is a sales performance wheel chart ppt examples professional. This is a ten stage process. The stages in this process are performance management, system and governance, supplier relationship management, result tracking and reporting, information technology, category plan development, trading partners relationship, organizational capabilities, business alignment, strategy and business process.
Scatter Chart Ppt PowerPoint Presentation Icon Elements
This is a scatter chart ppt powerpoint presentation icon elements. This is a nine stage process. The stages in this process are dollar in billions, sales in percentage, business, success.
Area Chart Ppt PowerPoint Presentation Gallery Icons
This is a area chart ppt powerpoint presentation gallery icons. This is a two stage process. The stages in this process are financial year, sales in percentage, product, finance, graph.
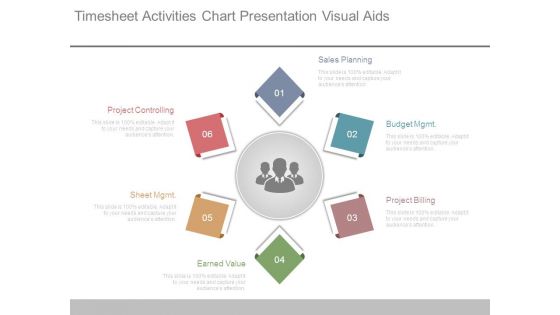
Timesheet Activities Chart Presentation Visual Aids
This is a timesheet activities chart presentation visual aids. This is a six stage process. The stages in this process are sales planning, budget mgmt, project billing, earned value, sheet mgmt, project controlling.
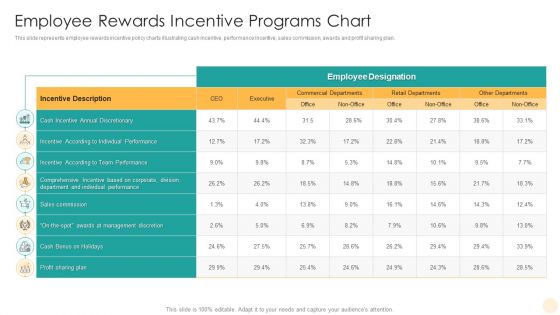
Employee Rewards Incentive Programs Chart Slides PDF
This slide represents employee rewards incentive policy charts illustrating cash incentive, performance incentive, sales commission, awards and profit sharing plan. Pitch your topic with ease and precision using this Employee Rewards Incentive Programs Chart Slides PDF. This layout presents information on Sales Commission, Team Performance, Individual Performance. It is also available for immediate download and adjustment. So, changes can be made in the color, design, graphics or any other component to create a unique layout.

PowerPoint Theme Lists Chart Ppt Template
PowerPoint Theme Lists Chart PPT Template-Use to awesome List and text boxes powerpoint templates to create awesome marketing and sales priority lists or any other types of lists.-PowerPoint Theme Lists Chart PPT Template-3d, Adhesive, Appliance, Background, Big, Blank, Blue, Chrome, Classic, Clean, Closed, Cold, Cool, Cooler, Copyspace, Design, Domestic, Door, Equipment, Freezer, Fridge, Handle, Household, Illustration, Kitchen, Large, List, Memo, Message, Metal, Nobody, Note, Object
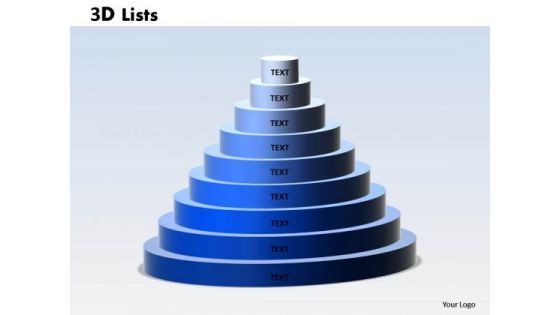
PowerPoint Designs List Chart Ppt Template
PowerPoint Designs List Chart PPT Template-Use to awesome List and text boxes powerpoint templates to create awesome marketing and sales priority lists or any other types of lists.-PowerPoint Designs List Chart PPT Template-3d, Adhesive, Appliance, Background, Big, Blank, Blue, Chrome, Classic, Clean, Closed, Cold, Cool, Cooler, Copyspace, Design, Domestic, Door, Equipment, Freezer, Fridge, Handle, Household, Illustration, Kitchen, Large, List, Memo, Message, Metal, Nobody, Note, Object
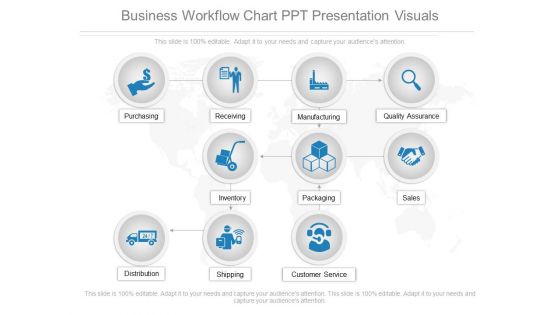
Business Workflow Chart Ppt Presentation Visuals
This is a business workflow chart ppt presentation visuals. This is a one stage process. The stages in this process are purchasing, receiving, manufacturing, quality assurance, inventory, packaging, sales, distribution, shipping, customer service.

Business Telecommunication Process Flow Chart Powerpoint Slides
This is a business telecommunication process flow chart powerpoint slides. This is a eight stage process. The stages in this process are business opportunity, market analysis, new product development, costing and projection, product support, marketing, sales and distribution, product evaluation.

Management Information System Chart Powerpoint Slide Download
This is a management information system chart powerpoint slide download. This is a six stage process. The stages in this process are technology, generate order, check credit, people, ship product, sales.
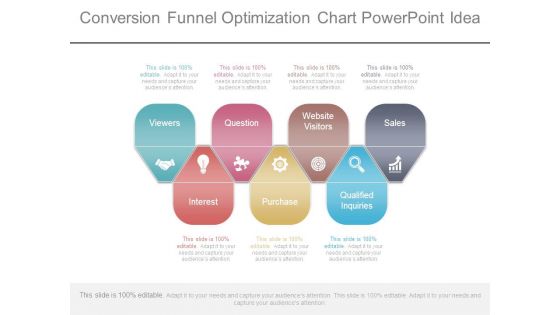
Conversion Funnel Optimization Chart Powerpoint Idea
This is a conversion funnel optimization chart powerpoint idea. This is a seven stage process. The stages in this process are viewers, question, website visitors, sales, interest, purchase, qualified inquiries.

Security Analysis Summary Chart Presentation Images
This is a security analysis summary chart presentation images. This is a one stage process. The stages in this process are ev ebitda, ev sales, div yield, open, pt close, high, low, mcap, eps.
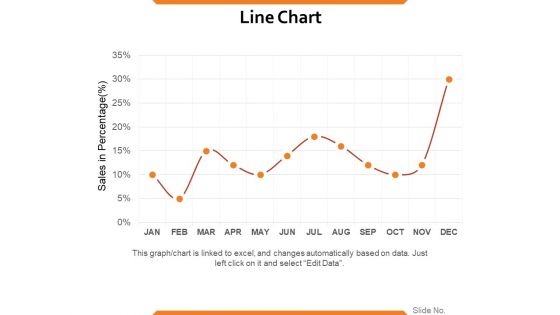
Line Chart Ppt PowerPoint Presentation Summary Samples
This is a line chart ppt powerpoint presentation summary samples. This is a one stage process. The stages in this process are sales in percentage, percentage, business, marketing, strategy.

Area Chart Ppt PowerPoint Presentation Pictures Files
This is a area chart ppt powerpoint presentation pictures files. This is a two stage process. The stages in this process are product, sales, in percentage, financial year, business.
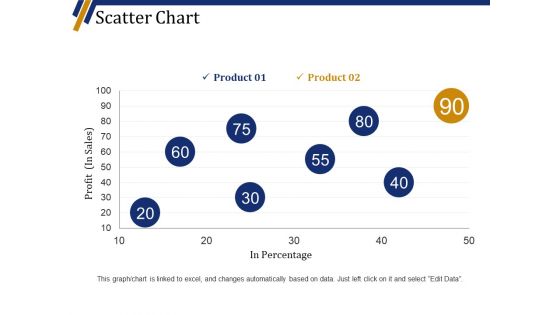
Scatter Chart Ppt PowerPoint Presentation Summary Visuals
This is a scatter chart ppt powerpoint presentation summary visuals. This is a eight stage process. The stages in this process are product, profit in sales, in percentage, finance, business.
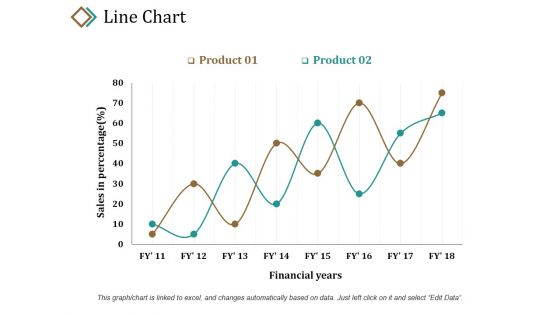
Line Chart Ppt PowerPoint Presentation Layouts Example
This is a line chart ppt powerpoint presentation layouts example. This is a two stage process. The stages in this process are sales in percentage, product, financial years, growth, success.

Line Chart Ppt PowerPoint Presentation Show Guide
This is a line chart ppt powerpoint presentation show guide. This is a two stage process. The stages in this process are product, sales in percentage, financial years, growth, success.
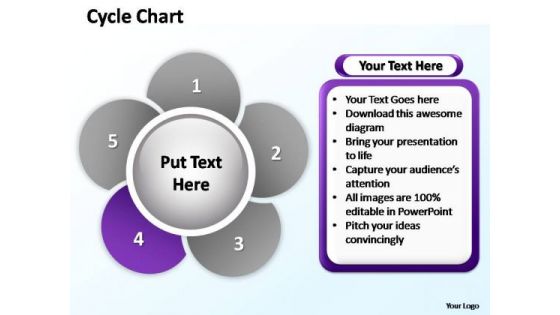
PowerPoint Designs Sales Cycle Chart Ppt Slides
PowerPoint_Designs_Sales_Cycle_Chart_PPT_Slides.pptx-The Circle of Life - a concept emmbedded in our minds and hence easy to comprehend. Life and Business is made up of processes comprising stages that flow from one to another. An excellent graphic to attract the attention of and understanding by your audience to improve earnings.

Business Framework Flow Chart Basics PowerPoint Presentation
This business framework power point image template has been crafted with graphic of flow chart. This PPT diagram contains the concept of process flow and management. Use this PPT diagram for your organizational and management related presentations.

Business Framework Bar Chart In PowerPoint Presentation
This power point diagram slide has been designed with graphic of bar chart. In this diagram slide we have used green and blue colored vertical bar graph. Display result analysis with this bar graph diagram and use it in your result verification and analysis related presentations.
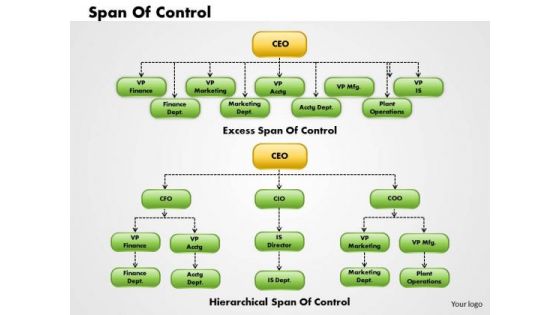
Business Framework Organization Chart 1 PowerPoint Presentation
This image slide has been designed to display span of control flow chart. Use this image slide, in your presentations to depict human resource management in business. This image slide will enhance the quality of your presentations.

Business Framework Organization Chart PowerPoint Presentation
This image slide has been designed to display sample of organization chart. Use this image slide, in your presentations to depict project development team management. This image slide will enhance the quality of your presentations.

Business Framework Organizational Chart Examples PowerPoint Presentation
This image slide has been designed to display organizational charts. Use this image slide, in your presentations to depict business management. This image slide will enhance the quality of your presentations and will provide professional appearance to your presentations.
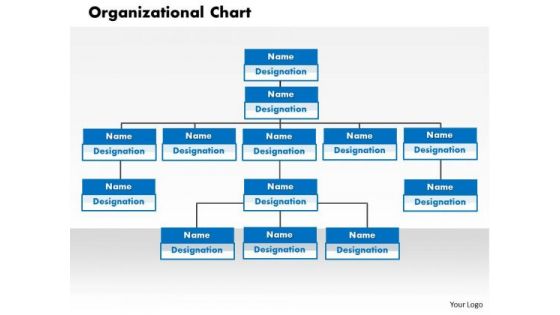
Business Framework Organizational Chart PowerPoint Presentation
This image slide has been designed to display organizational flow chart. Use this image slide, in your presentations to depict human resource management in business designation. This image slide will enhance the quality of your presentations.
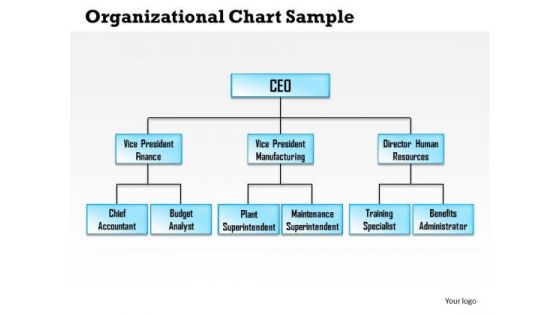
Business Framework Organizational Chart Sample PowerPoint Presentation
This image slide has been designed to display organizational flow chart. Use this image slide, in your presentations to depict higher post management in business. This image slide will enhance the quality of your presentations.

PowerPoint Process Process Circular Chart Ppt Slides
PowerPoint Process Process circular chart PPT Slides-The Circle of Life - a concept emmbedded in our minds and hence easy to comprehend. Life and Business is made up of processes comprising stages that flow from one to another. An excellent graphic to attract the attention of and understanding by your audience to improve earnings.
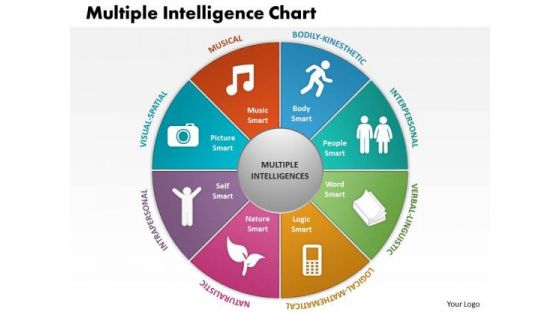
Business Framework Multiple Intelligence Chart PowerPoint Presentation
This business framework power point template has been designed with graphic of multiple intelligence chart. This kind of charts are used for testing and assessment process of any business. Add this template in your presentation and show creative ideas graphically.

PowerPoint Presentation Sales Hexagon Chart Ppt Backgrounds
PowerPoint Presentation Sales Hexagon Chart PPT BackgroundsBusiness PPT templates-These high quality powerpoint pre-designed slides and powerpoint templates have been carefully created by our professional team to help you impress your audience. All slides have been created and are 100% editable in powerpoint. Each and every property of any graphic - color, size, orientation, shading, outline etc. can be modified to help you build an effective powerpoint presentation. Any text can be entered at any point in the powerpoint template or slide. Simply DOWNLOAD, TYPE and PRESENT!
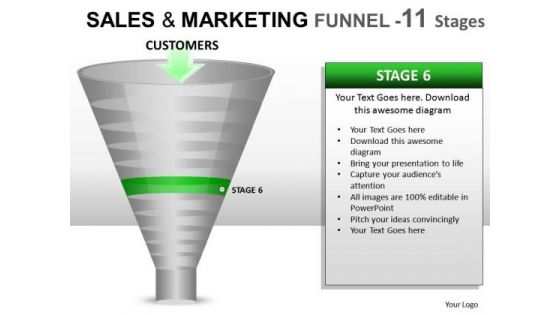
PowerPoint Funnel Chart Diagram For Ppt Slides
PowerPoint Funnel Chart Diagram for PPT Slides These high quality, editable pre-designed powerpoint slides have been carefully created by our professional team to help you impress your audience. Each graphic in every slide is vector based and is 100% editable in powerpoint. Each and every property of any slide - color, size, shading etc can be modified to build an effective powerpoint presentation. Use these slides to convey complex business concepts in a simplified manner. Any text can be entered at any point in the powerpoint slide. Simply DOWNLOAD, TYPE and PRESENT!
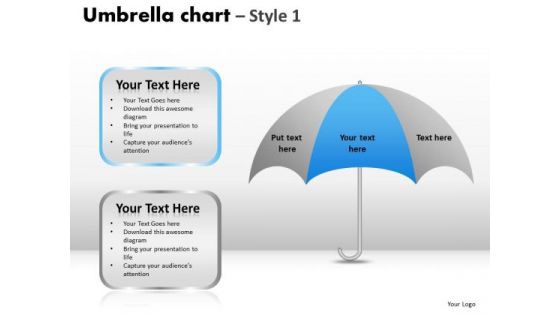
PowerPoint Backgrounds Sales Umbrella Chart Ppt Themes
PowerPoint Backgrounds Sales Umbrella Chart PPT Themes-These high quality powerpoint pre-designed slides and powerpoint templates have been carefully created by our professional team to help you impress your audience. All slides have been created and are 100% editable in powerpoint. Each and every property of any graphic - color, size, orientation, shading, outline etc. can be modified to help you build an effective powerpoint presentation. Any text can be entered at any point in the powerpoint template or slide. Simply DOWNLOAD, TYPE and PRESENT!
PowerPoint Theme Sales Umbrella Chart Ppt Layout
PowerPoint Theme Sales Umbrella Chart PPT Layout-These high quality powerpoint pre-designed slides and powerpoint templates have been carefully created by our professional team to help you impress your audience. All slides have been created and are 100% editable in powerpoint. Each and every property of any graphic - color, size, orientation, shading, outline etc. can be modified to help you build an effective powerpoint presentation. Any text can be entered at any point in the powerpoint template or slide. Simply DOWNLOAD, TYPE and PRESENT!

Optimize The Retail Process Chart Ppt Slides
This is a optimize the retail process chart ppt slides. This is a eight stage process. The stages in this process are predictive, scheduling, queue, management, in store, analytics, service, productivity, service, intensity, sales conversion, demand analytics, customer service model, behavior analytics.
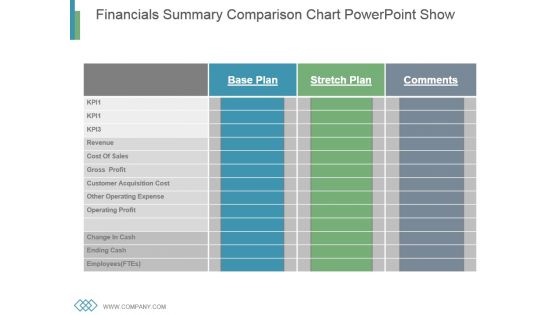
Financials Summary Comparison Chart Powerpoint Show
This is a financials summary comparison chart powerpoint show. This is a three stage process. The stages in this process are revenue, cost of sales, gross profit, customer acquisition cost, other operating cost expense, operating profit, change in cash, ending cash, employees.

PowerPoint Templates Chart Forming Storming Ppt Process
PowerPoint Templates Chart Forming Storming PPT Process-These high quality powerpoint pre-designed slides and powerpoint templates have been carefully created by our professional team to help you impress your audience. All slides have been created and are 100% editable in powerpoint. Each and every property of any graphic - color, size, orientation, shading, outline etc. can be modified to help you build an effective powerpoint presentation. Any text can be entered at any point in the powerpoint template or slide. Simply DOWNLOAD, TYPE and PRESENT!

PowerPoint Design Slides Chart Pyramid Ppt Backgrounds
PowerPoint Design Slides Chart Pyramid PPT Backgrounds-These high quality powerpoint pre-designed slides and powerpoint templates have been carefully created by our professional team to help you impress your audience. All slides have been created and are 100% editable in powerpoint. Each and every property of any graphic - color, size, orientation, shading, outline etc. can be modified to help you build an effective powerpoint presentation. Any text can be entered at any point in the powerpoint template or slide. Simply DOWNLOAD, TYPE and PRESENT!
PowerPoint Template Sales Umbrella Chart Ppt Designs
PowerPoint Template Sales Umbrella Chart PPT Designs-These high quality powerpoint pre-designed slides and powerpoint templates have been carefully created by our professional team to help you impress your audience. All slides have been created and are 100% editable in powerpoint. Each and every property of any graphic - color, size, orientation, shading, outline etc. can be modified to help you build an effective powerpoint presentation. Any text can be entered at any point in the powerpoint template or slide. Simply DOWNLOAD, TYPE and PRESENT!
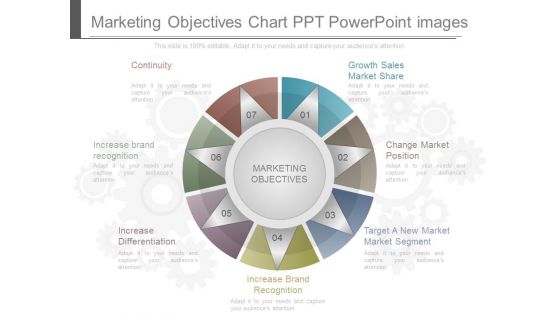
Marketing Objectives Chart Ppt Powerpoint Images
This is a marketing objectives chart ppt powerpoint images. This is a seven stage process. The stages in this process are continuity, growth sales market share, change market position, target a new market market segment, increase brand recognition, increase differentiation, increase brand recognition, marketing objectives.

Quarterly Money Flow Analysis Chart Presentation Design
This is a quarterly money flow analysis chart presentation design. This is a four stage process. The stages in this process are cash position, cash in, initial funding, sales, total cash in, cash out, start up costs, product costs, marketing, fixed costs, principal payments, total cash out, inflows outflows, cumulative.
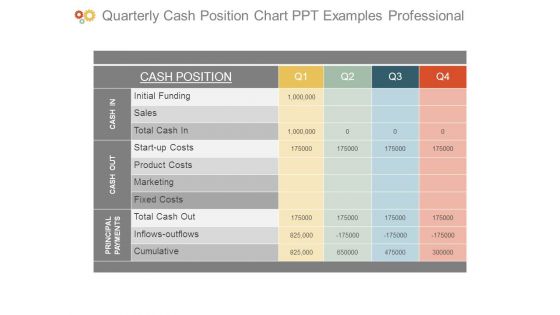
Quarterly Cash Position Chart Ppt Examples Professional
This is a quarterly cash position chart ppt examples professional. This is a four stage process. The stages in this process are cash position, initial funding, sales, total cash in, start up costs, product costs, marketing, fixed costs, total cash out, inflows outflows, cumulative, cash in, cash out, principal payments.

PowerPoint Backgrounds Leadership Quadrant Chart Ppt Theme
PowerPoint Backgrounds Leadership Quadrant Chart PPT Theme-These high quality powerpoint pre-designed slides and powerpoint templates have been carefully created by our professional team to help you impress your audience. All slides have been created and are 100% editable in powerpoint. Each and every property of any graphic - color, size, orientation, shading, outline etc. can be modified to help you build an effective powerpoint presentation. Any text can be entered at any point in the powerpoint template or slide. Simply DOWNLOAD, TYPE and PRESENT!
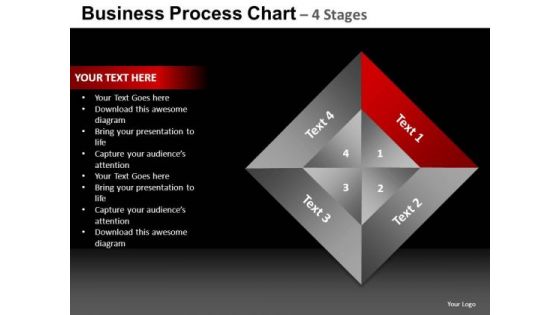
PowerPoint Backgrounds Process Quadrant Chart Ppt Themes
PowerPoint Backgrounds Process Quadrant Chart PPT Themes-These high quality powerpoint pre-designed slides and powerpoint templates have been carefully created by our professional team to help you impress your audience. All slides have been created and are 100% editable in powerpoint. Each and every property of any graphic - color, size, orientation, shading, outline etc. can be modified to help you build an effective powerpoint presentation. Any text can be entered at any point in the powerpoint template or slide. Simply DOWNLOAD, TYPE and PRESENT!

 Home
Home