Waterfall Chart

Commercial Marketing KPI With Cost Per Click Guidelines PDF
This slide template covers about the website total visit, cost per click, engagement rate with product sales trends and revenue generation by channel. Pitch your topic with ease and precision using this Commercial Marketing KPI With Cost Per Click Guidelines PDF. This layout presents information on Website Demographics, Referral Channels, Determining Influence. It is also available for immediate download and adjustment. So, changes can be made in the color, design, graphics or any other component to create a unique layout.
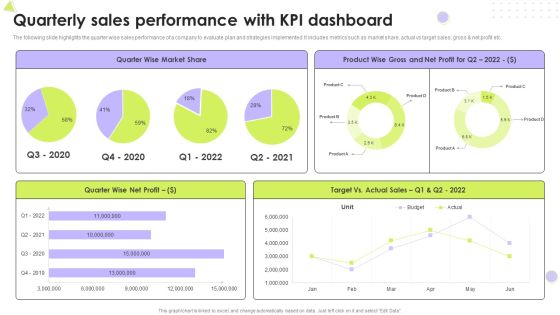
Quarterly Sales Performance With Kpi Dashboard Introduction PDF
The following slide highlights the quarter wise sales performance of a company to evaluate plan and strategies implemented. It includes metrics such as market share, actual vs target sales, gross and net profit etc. Pitch your topic with ease and precision using this Quarterly Sales Performance With Kpi Dashboard Introduction PDF. This layout presents information on Market Share, Net Profit, Target. It is also available for immediate download and adjustment. So, changes can be made in the color, design, graphics or any other component to create a unique layout.
Marketing And Operation KPI Dashboard To Increase Efficiency Icons PDF
This slide covers sales and operations KPI dashboard to increase efficiency. It involves performance, increase in profit, target, monthly profit and quarterly revenue trend. Pitch your topic with ease and precision using this Marketing And Operation KPI Dashboard To Increase Efficiency Icons PDF. This layout presents information on Profit By Monthly, Target, Performance. It is also available for immediate download and adjustment. So, changes can be made in the color, design, graphics or any other component to create a unique layout.
Small And Medium Business Weekly Sales Bar Graph Ppt PowerPoint Presentation Icon Diagrams PDF
Showcasing this set of slides titled small and medium business weekly sales bar graph ppt powerpoint presentation icon diagrams pdf. The topics addressed in these templates are small and medium business weekly sales bar graph. All the content presented in this PPT design is completely editable. Download it and make adjustments in color, background, font etc. as per your unique business setting.
Monthly Company Product Sales Bar Graph Ppt PowerPoint Presentation Icon Model PDF
Showcasing this set of slides titled monthly company product sales bar graph ppt powerpoint presentation icon model pdf. The topics addressed in these templates are monthly company product sales bar graph. All the content presented in this PPT design is completely editable. Download it and make adjustments in color, background, font etc. as per your unique business setting.

Daily Reports Analysis Of Various Sales Representatives Daily Ppt Gallery Graphic Tips PDF
The daily sales reports provides an overview of sales activities within a firm. It helps in analyzing the performance of different sales executives representatives. They help in tracking sales metrics that are relevant on daily basis such as number of sales, total volume of daily sales. Deliver and pitch your topic in the best possible manner with this daily reports analysis of various sales representatives daily ppt gallery graphic tips pdf. Use them to share invaluable insights on opportunities, sales, analysis and impress your audience. This template can be altered and modified as per your expectations. So, grab it now.

Company Quarterly Sales Performance Bar Graph Ppt PowerPoint Presentation File Templates PDF
Pitch your topic with ease and precision using this company quarterly sales performance bar graph ppt powerpoint presentation file templates pdf. This layout presents information on company quarterly sales performance bar graph. It is also available for immediate download and adjustment. So, changes can be made in the color, design, graphics or any other component to create a unique layout.

Bar Graph Depicting Business Sales Revenue With Cagr Value Ppt PowerPoint Presentation File Outline PDF
Showcasing this set of slides titled bar graph depicting business sales revenue with cagr value ppt powerpoint presentation file outline pdf. The topics addressed in these templates are bar graph depicting business sales revenue with cagr value. All the content presented in this PPT design is completely editable. Download it and make adjustments in color, background, font etc. as per your unique business setting.
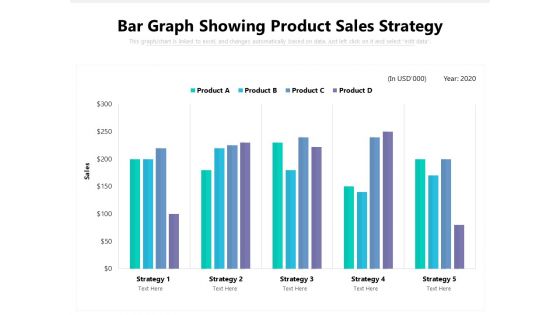
Bar Graph Showing Product Sales Strategy Ppt PowerPoint Presentation File Samples PDF
Showcasing this set of slides titled bar graph showing product sales strategy ppt powerpoint presentation file samples pdf. The topics addressed in these templates are bar graph showing product sales strategy. All the content presented in this PPT design is completely editable. Download it and make adjustments in color, background, font etc. as per your unique business setting.
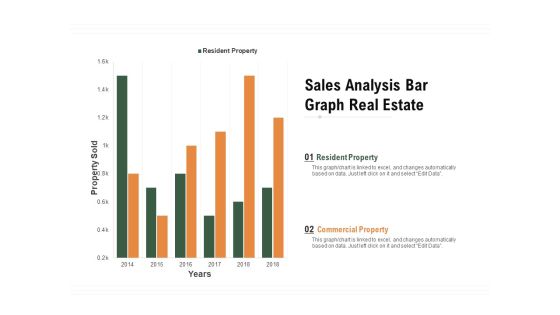
Sales Analysis Bar Graph Real Estate Ppt PowerPoint Presentation Infographic Template Show PDF
Pitch your topic with ease and precision using this sales analysis bar graph real estate ppt powerpoint presentation infographic template show pdf. This layout presents information on resident property, commercial property, property sold, 2014 to 2018. It is also available for immediate download and adjustment. So, changes can be made in the color, design, graphics or any other component to create a unique layout.
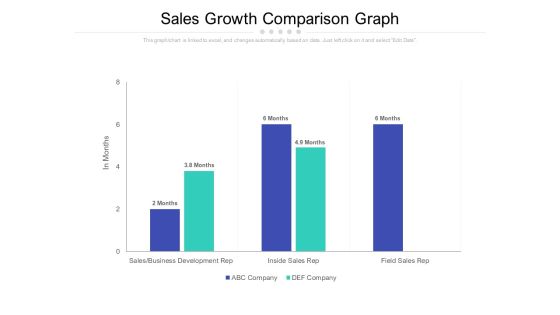
Sales Growth Comparison Graph Ppt PowerPoint Presentation Outline Demonstration
Presenting this set of slides with name sales growth comparison graph ppt powerpoint presentation outline demonstration. The topics discussed in these slides are sales, business development rep, inside sales rep, field sales rep. This is a completely editable PowerPoint presentation and is available for immediate download. Download now and impress your audience.

Company Sales And Revenue Performance Analysis Ppt Ideas Format PDF
This slide covers sales and revenue generated by a business entity. It also includes elements such profits earned, cost incurred, marketing and sales cost breakdown, annual sales revenue graph, sales generated through social media, revenue from up OR cross selling, etc. Pitch your topic with ease and precision using this Company Sales And Revenue Performance Analysis Ppt Ideas Format PDF. This layout presents information on Total Sales, Revenue Generation, Profit Earned, Cost Incurred. It is also available for immediate download and adjustment. So, changes can be made in the color, design, graphics or any other component to create a unique layout.
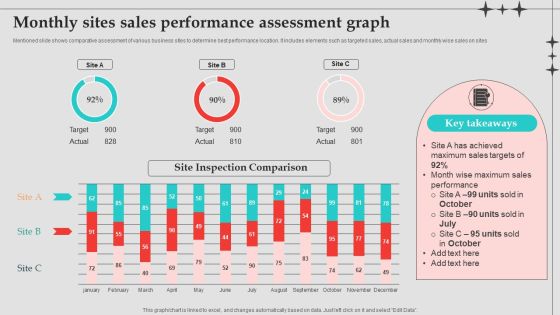
Monthly Sites Sales Performance Assessment Graph Designs PDF
Mentioned slide shows comparative assessment of various business sites to determine best performance location. It includes elements such as targeted sales, actual sales and monthly wise sales on sites. Pitch your topic with ease and precision using this Monthly Sites Sales Performance Assessment Graph Designs PDF. This layout presents information on Sales Performance, Sales Targets, Performance Assessment Graph . It is also available for immediate download and adjustment. So, changes can be made in the color, design, graphics or any other component to create a unique layout.

Ecommerce Industry Overview And Analysis Key Statistics Associated With Ecommerce Industry Introduction PDF
This slide provides glimpses of key statistics associated with the US ecommerce industry in terms of total e-commerce sales and retail ecommerce category growth in the US. It helps get valuable insights into shifts in the economy, ongoing market trends, demographics, and the traits of customers expenditures. Make sure to capture your audiences attention in your business displays with our gratis customizable Ecommerce Industry Overview And Analysis Key Statistics Associated With Ecommerce Industry Introduction PDF. These are great for business strategies, office conferences, capital raising or task suggestions. If you desire to acquire more customers for your tech business and ensure they stay satisfied, create your own sales presentation with these plain slides.

Digital Dashboard Indicating Insurance Agent Sales Performance Portrait PDF
This slide illustrates insurance agent sales performance digital dashboard. It provides information about total proposals, policies, accident, claims, sales revenue, rewards, etc. Pitch your topic with ease and precision using this Digital Dashboard Indicating Insurance Agent Sales Performance Portrait PDF. This layout presents information on Sales Revenue, Reward And Recognition. It is also available for immediate download and adjustment. So, changes can be made in the color, design, graphics or any other component to create a unique layout.

Sales Timeframe And Performance Management Dashboard Introduction PDF
The slide highlight the sales timeline and performance management dashboard illustrating regional market share, sales timeline, regional margin and category margin. Pitch your topic with ease and precision using this Sales Timeframe And Performance Management Dashboard Introduction PDF. This layout presents information on Regional Market Share, Category Margin, Sales Timeline. It is also available for immediate download and adjustment. So, changes can be made in the color, design, graphics or any other component to create a unique layout.

CRM Software Dashboard For Sales Comparison Mockup PDF
This slide represents the sales dashboard of CRM software. It includes KPIs such as profit, number of sales and expenses incurred. Pitch your topic with ease and precision using this CRM Software Dashboard For Sales Comparison Mockup PDF. This layout presents information on Profit, Sales Dashboard, Expenses Incurred. It is also available for immediate download and adjustment. So, changes can be made in the color, design, graphics or any other component to create a unique layout.

Contract Progress Status With Average Sales Cycle Length Topics PDF
Pitch your topic with ease and precision using this Contract Progress Status With Average Sales Cycle Length Topics PDF This layout presents information on Contract Value, Sales Activity, Sales Cycle It is also available for immediate download and adjustment. So, changes can be made in the color, design, graphics or any other component to create a unique layout.

Business Sales And Revenue Summary Dashboard Brochure PDF
This slide exhibits sales report dashboards that provides information of sales activities and performance in financial year. It includes elements such as average weekly sales revenue, customer acquisition cost, customer lifetime value and sales target. Pitch your topic with ease and precision using this Business Sales And Revenue Summary Dashboard Brochure PDF. This layout presents information on Average Revenue, Customer Lifetime, Customer Acquisition. It is also available for immediate download and adjustment. So, changes can be made in the color, design, graphics or any other component to create a unique layout.
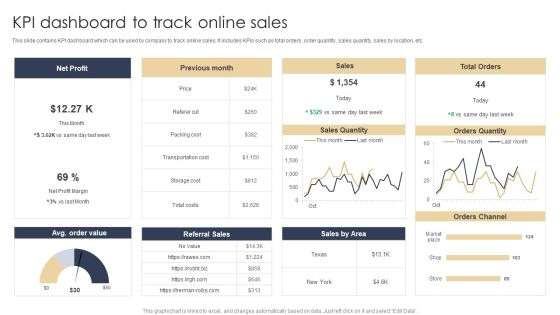
KPI Dashboard To Track Online Sales Structure PDF
This slide contains KPI dashboard which can be used by company to track online sales. It includes KPIs such as total orders, order quantity, sales quantity, sales by location, etc. Pitch your topic with ease and precision using this KPI Dashboard To Track Online Sales Structure PDF. This layout presents information on Net Profit, Sales, Orders Quantity. It is also available for immediate download and adjustment. So, changes can be made in the color, design, graphics or any other component to create a unique layout.

KPI Dashboard To Evaluate Corporate Sales Introduction PDF
This slide contains KPI dashboard which can be used by company to track e-commerce sales. It includes kpis such as total orders, order quantity, sales quantity, sales by location, etc. Pitch your topic with ease and precision using this KPI Dashboard To Evaluate Corporate Sales Introduction PDF. This layout presents information on KPI Dashboard, Evaluate Corporate Sales. It is also available for immediate download and adjustment. So, changes can be made in the color, design, graphics or any other component to create a unique layout.

Sales Monitoring Dashboard With Monthly Qualified Leads Guidelines PDF
This slide showcases dashboard that can help organization to monitor the sales pipeline velocity and predict future sales more accurately plus increase the leads converted. Its key components are monthly qualified leads, win rate based on deal size, monthly sales cycle and number of leads at each stage of pipeline. Pitch your topic with ease and precision using this Sales Monitoring Dashboard With Monthly Qualified Leads Guidelines PDF. This layout presents information on Monthly Qualified, Monthly Sales Cycle, Deal Size. It is also available for immediate download and adjustment. So, changes can be made in the color, design, graphics or any other component to create a unique layout.

International Sales Performance Dashboard With Regional Market Report Inspiration PDF
This slide showcases global report that can help organization to estimate forecast of the sales and identify yearly revenue generated. Its key elements are yearly sales, market share, regional outlook, competitor analysis and geographical sales. Pitch your topic with ease and precision using this International Sales Performance Dashboard With Regional Market Report Inspiration PDF. This layout presents information on Regional Outlook, Sales And Forecast, Market Share Overview. It is also available for immediate download and adjustment. So, changes can be made in the color, design, graphics or any other component to create a unique layout.

CRM Pipeline Administration Reduction In Sales Cycle Duration Formats PDF
The successful optimization of effective pipeline management solution results in improving sales cycle duration. The sales cycle initiates when the lead become sales ready until they purchase the product. This slide depict sales cycle from lead generation to sales conversion. Take your projects to the next level with our ultimate collection of CRM Pipeline Administration Reduction In Sales Cycle Duration Formats PDF. Slidegeeks has designed a range of layouts that are perfect for representing task or activity duration, keeping track of all your deadlines at a glance. Tailor these designs to your exact needs and give them a truly corporate look with your own brand colors theyll make your projects stand out from the rest.

Average Sales Compensation And Salary Dashboard Introduction PDF
The following slide showcases compensation administration dashboard highlighting sales compensation. The dashboard further includes average monthly compensation per employee. Pitch your topic with ease and precision using this Average Sales Compensation And Salary Dashboard Introduction PDF. This layout presents information on Salary Dashboard, Average Sales Compensation. It is also available for immediate download and adjustment. So, changes can be made in the color, design, graphics or any other component to create a unique layout.
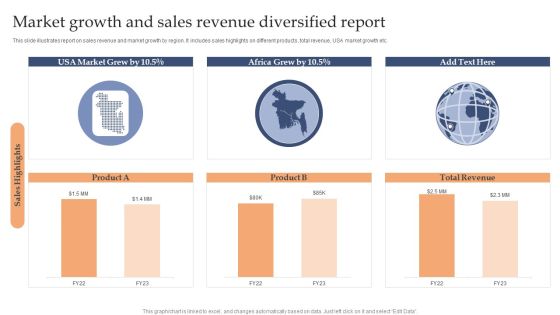
Market Growth And Sales Revenue Diversified Report Sample PDF
This slide illustrates report on sales revenue and market growth by region. It includes sales highlights on different products, total revenue, USA market growth etc.Pitch your topic with ease and precision using this Market Growth And Sales Revenue Diversified Report Sample PDF. This layout presents information on Market Grew, Africa Grew, Total Revenue. It is also available for immediate download and adjustment. So, changes can be made in the color, design, graphics or any other component to create a unique layout.

Retail Outlet Dashboard With Sales Kpis Clipart PDF
This slide covers a metrics dashboard for tracking retail store sales. It includes KPIs such as sales square foot per location, net profit, revues, shrinkage, customer retention rate, etc. Pitch your topic with ease and precision using this retail outlet dashboard with sales kpis clipart pdf This layout presents information on Retail outlet dashboard with sales kpis It is also available for immediate download and adjustment. So, changes can be made in the color, design, graphics or any other component to create a unique layout.

Sales Team Monthly Report With Variance Background PDF
The following slide highlights the sales team monthly report with variance illustrating key headings which includes key headings month, sales, target, variance, percentage variance and key takeaways. Pitch your topic with ease and precision using this Sales Team Monthly Report With Variance Background PDF. This layout presents information on Sales Team Monthly Report With Variance Background PDF. It is also available for immediate download and adjustment. So, changes can be made in the color, design, graphics or any other component to create a unique layout.

Manufactured Products Sales Performance Monitoring Dashboard Information PDF
This slide shows the dashboard the data related to the sales performance of the products manufactured by the organization in order to effectively measure and monitor the performance of the sales team. It shows details related to revenue generated and units sold etc.Pitch your topic with ease and precision using this Manufactured Products Sales Performance Monitoring Dashboard Information PDF. This layout presents information on Monthly Revenue, Manufactured Products, Sales Performance Monitoring. It is also available for immediate download and adjustment. So, changes can be made in the color, design, graphics or any other component to create a unique layout.

Executive Dashboards To Track Sales Performance Guidelines PDF
This slide represents the CEO dashboard for tracking the sales performance of the organization. It includes key performance indicators such as gross, operating and net profit, sales amount by category, income statement etc. Pitch your topic with ease and precision using this Executive Dashboards To Track Sales Performance Guidelines PDF. This layout presents information on Income Statement, Monthly Sales Growth, Days Receivable Outstanding. It is also available for immediate download and adjustment. So, changes can be made in the color, design, graphics or any other component to create a unique layout.

Sales Product Performance Dashboard Ppt PowerPoint Presentation Gallery Background
Presenting this set of slides with name sales product performance dashboard ppt powerpoint presentation gallery background. The topics discussed in these slides are sales, performance, revenue, incremental, social. This is a completely editable PowerPoint presentation and is available for immediate download. Download now and impress your audience.

Company Results Sales Ppt PowerPoint Presentation Ideas Examples
Presenting this set of slides with name company results sales ppt powerpoint presentation ideas examples. The topics discussed in these slides are customer recognition, enhanced sales, competitive edge. This is a completely editable PowerPoint presentation and is available for immediate download. Download now and impress your audience.

Graph Showing Sales Performance Analysis Ppt PowerPoint Presentation Professional Information
Presenting this set of slides with name graph showing sales performance analysis ppt powerpoint presentation professional information. The topics discussed in these slide is graph showing sales performance analysis. This is a completely editable PowerPoint presentation and is available for immediate download. Download now and impress your audience.

Company Sales And Performance Dashboard Ppt PowerPoint Presentation Inspiration Gallery
Presenting this set of slides with name company sales and performance dashboard ppt powerpoint presentation inspiration gallery. The topics discussed in these slides are month growth in revenue, product sales, profit margins graph . This is a completely editable PowerPoint presentation and is available for immediate download. Download now and impress your audience.

Company Sales And Performance Dashboard Ppt PowerPoint Presentation Inspiration Skills
Presenting this set of slides with name company sales and performance dashboard ppt powerpoint presentation inspiration skills. The topics discussed in these slides are growth revenue, product sales, profits. This is a completely editable PowerPoint presentation and is available for immediate download. Download now and impress your audience.

Company Sales And Performance Dashboard Ppt PowerPoint Presentation Model Ideas
Presenting this set of slides with name company sales and performance dashboard ppt powerpoint presentation model ideas. The topics discussed in these slides are 5 month growth in revenue, 4 year product sales, profit margins graph, 4 year profits . This is a completely editable PowerPoint presentation and is available for immediate download. Download now and impress your audience.

Company Sales And Performance Dashboard Ppt PowerPoint Presentation Slides Background
Presenting this set of slides with name company sales and performance dashboard ppt powerpoint presentation slides background. The topics discussed in these slides are 5 month growth in revenue, 4 year product sales, profit margins graph, 4 year profits. This is a completely editable PowerPoint presentation and is available for immediate download. Download now and impress your audience.

Commodity Up Selling Sales Projections Ppt Model Sample PDF
Presenting this set of slides with name commodity up selling sales projections ppt model sample pdf. The topics discussed in these slides are sales revenue. This is a completely editable PowerPoint presentation and is available for immediate download. Download now and impress your audience.

Progressive Business Performance Measurement Metrics Sales Ppt Pictures Guidelines PDF
Presenting this set of slides with name progressive business performance measurement metrics sales ppt pictures guidelines pdf. The topics discussed in these slides are sales, growth, targeted, revenue, performance. This is a completely editable PowerPoint presentation and is available for immediate download. Download now and impress your audience.
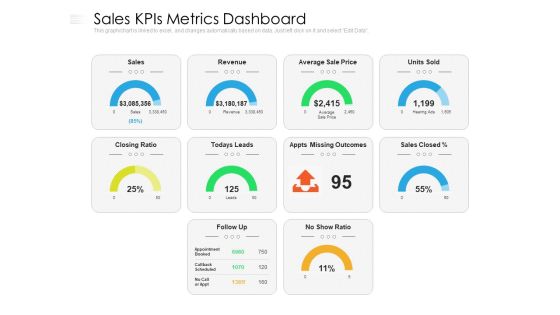
Sales Kpis Metrics Dashboard Ppt PowerPoint Presentation Gallery Demonstration PDF
Presenting this set of slides with name sales kpis metrics dashboard ppt powerpoint presentation gallery demonstration pdf. The topics discussed in these slides are sales, revenue, price. This is a completely editable PowerPoint presentation and is available for immediate download. Download now and impress your audience.
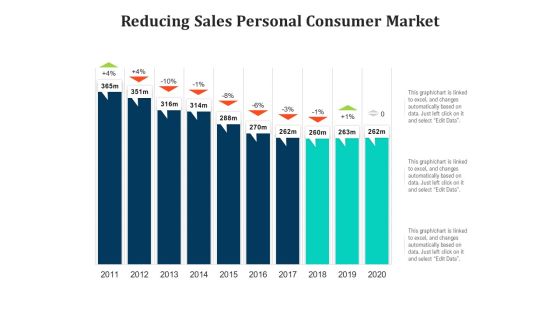
Reducing Sales Personal Consumer Market Ppt PowerPoint Presentation Portfolio
Pitch your topic with ease and precision using this reducing sales personal consumer market ppt powerpoint presentation portfolio. This layout presents information on reducing sales personal consumer market, 2011 to 2020. It is also available for immediate download and adjustment. So, changes can be made in the color, design, graphics or any other component to create a unique layout.

Graph Showing Financial Prediction Of Company Sales Revenue Topics PDF
Pitch your topic with ease and precision using this graph showing financial prediction of company sales revenue topics pdf. This layout presents information on graph showing financial prediction of company sales revenue. It is also available for immediate download and adjustment. So, changes can be made in the color, design, graphics or any other component to create a unique layout.

Company Hardware And Software Sales Accomplishment Rate Rules PDF
Pitch your topic with ease and precision using this company hardware and software sales accomplishment rate rules pdf. This layout presents information on company hardware and software sales accomplishment rate. It is also available for immediate download and adjustment. So, changes can be made in the color, design, graphics or any other component to create a unique layout.
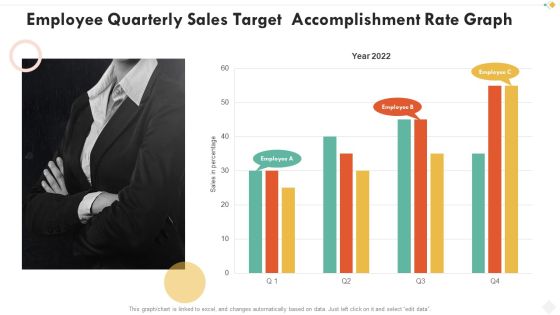
Employee Quarterly Sales Target Accomplishment Rate Graph Demonstration PDF
Pitch your topic with ease and precision using this employee quarterly sales target accomplishment rate graph demonstration pdf. This layout presents information on employee quarterly sales target accomplishment rate graph. It is also available for immediate download and adjustment. So, changes can be made in the color, design, graphics or any other component to create a unique layout.

KPI Compare Dashboard Depicting Sales Performance Summary PDF
Pitch your topic with ease and precision using this KPI Compare Dashboard Depicting Sales Performance Summary PDF This layout presents information on KPI Compare Dashboard Depicting Sales Performance It is also available for immediate download and adjustment. So, changes can be made in the color, design, graphics or any other component to create a unique layout.

Historical And Forecasted Sales Numbers With Key Insights Information PDF
Pitch your topic with ease and precision using this Historical And Forecasted Sales Numbers With Key Insights Information PDF. This layout presents information on Historical And Forecasted Sales Numbers With Key Insights. It is also available for immediate download and adjustment. So, changes can be made in the color, design, graphics or any other component to create a unique layout.
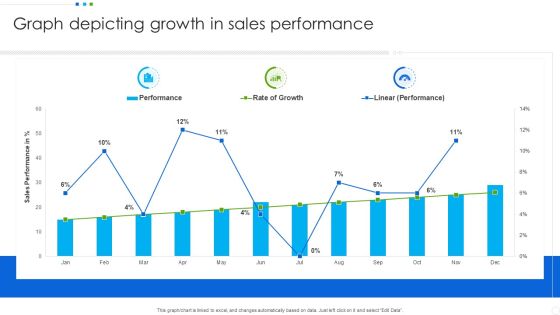
Graph Depicting Growth In Sales Performance Professional PDF
Pitch your topic with ease and precision using this Graph Depicting Growth In Sales Performance Professional PDF. This layout presents information on Graph Depicting, Sales Performance. It is also available for immediate download and adjustment. So, changes can be made in the color, design, graphics or any other component to create a unique layout.

Graph Representing Revenue Growth In B2b Sales Background PDF
Pitch your topic with ease and precision using this Graph Representing Revenue Growth In B2b Sales Background PDF. This layout presents information on Graph Representing, Revenue Growth, Sales. It is also available for immediate download and adjustment. So, changes can be made in the color, design, graphics or any other component to create a unique layout.
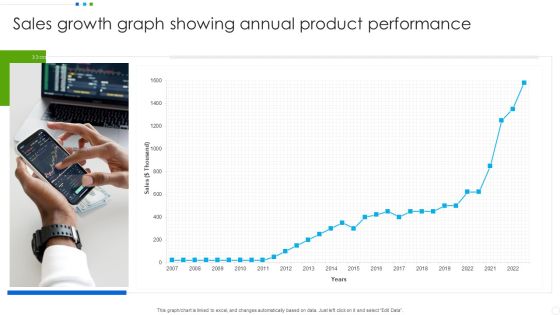
Sales Growth Graph Showing Annual Product Performance Slides PDF
Pitch your topic with ease and precision using this Sales Growth Graph Showing Annual Product Performance Slides PDF. This layout presents information on Sales Growth, Product Performance. It is also available for immediate download and adjustment. So, changes can be made in the color, design, graphics or any other component to create a unique layout.

Business Sales Highlights Of Different Manufacturing Companies Demonstration PDF
Pitch your topic with ease and precision using this Business Sales Highlights Of Different Manufacturing Companies Demonstration PDF. This layout presents information on Business Sales Highlights, Different Manufacturing Companies. It is also available for immediate download and adjustment. So, changes can be made in the color, design, graphics or any other component to create a unique layout.

Business Sales Highlights With Pushed Opportunities Infographics PDF
Pitch your topic with ease and precision using this Business Sales Highlights With Pushed Opportunities Infographics PDF. This layout presents information on Business Sales Highlights, Pushed Opportunities. It is also available for immediate download and adjustment. So, changes can be made in the color, design, graphics or any other component to create a unique layout.

Company Business Sales Highlights In Different Years Clipart PDF
Pitch your topic with ease and precision using this Company Business Sales Highlights In Different Years Clipart PDF. This layout presents information on Company Business Sales Highlights, Revenues. It is also available for immediate download and adjustment. So, changes can be made in the color, design, graphics or any other component to create a unique layout.

Company Business Sales Highlights With Target Percentage Background PDF
Pitch your topic with ease and precision using this Company Business Sales Highlights With Target Percentage Background PDF. This layout presents information on Company Business Sales Highlights, Target Percentage. It is also available for immediate download and adjustment. So, changes can be made in the color, design, graphics or any other component to create a unique layout.
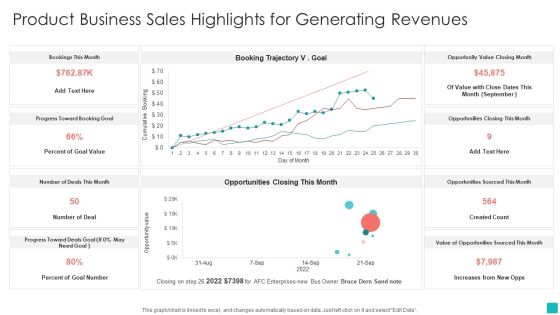
Product Business Sales Highlights For Generating Revenues Demonstration PDF
Pitch your topic with ease and precision using this Product Business Sales Highlights For Generating Revenues Demonstration PDF. This layout presents information on Product Business Sales Highlights, Generating Revenues. It is also available for immediate download and adjustment. So, changes can be made in the color, design, graphics or any other component to create a unique layout.
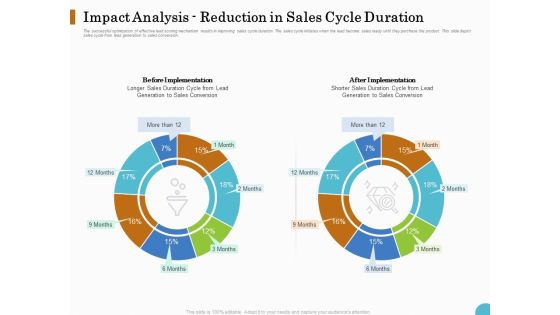
Lead Ranking Sales Methodology Model Impact Analysis Reduction In Sales Cycle Duration Ppt PowerPoint Presentation Slides Layout PDF
Presenting this set of slides with name lead ranking sales methodology model impact analysis reduction in sales cycle duration ppt powerpoint presentation slides layout pdf. The topics discussed in these slides are before implementation, after implementation, sales conversion, lead generation. This is a completely editable PowerPoint presentation and is available for immediate download. Download now and impress your audience.

Insurance Analytics Corporation Sales Insights Dashboard Structure PDF
This slide illustrates facts and figures in relation to sales and overall policy status. It includes total policies and premiums in current and previous year, quarterly premium revenue and monthly policy status. Pitch your topic with ease and precision using this Insurance Analytics Corporation Sales Insights Dashboard Structure PDF. This layout presents information on Quarterly Premium Revenue, Sales Insights Dashboard, Insurance Analytics Corporation. It is also available for immediate download and adjustment. So, changes can be made in the color, design, graphics or any other component to create a unique layout.
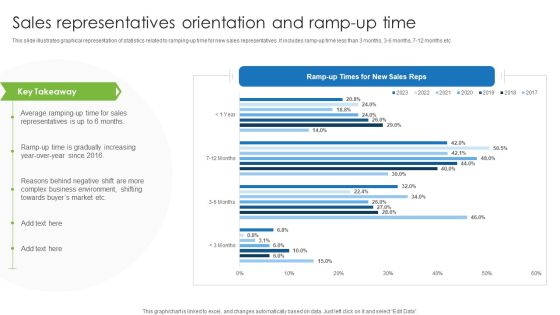
Sales Representatives Orientation And Ramp Up Time Summary PDF
This slide illustrates graphical representation of statistics related to ramping up time for new sales representatives. It includes ramp up time less than 3 months, 3 6 months, 7 12 months etc. Pitch your topic with ease and precision using this Sales Representatives Orientation And Ramp Up Time Summary PDF. This layout presents information on Sales Representatives Orientation, Ramp Up Time. It is also available for immediate download and adjustment. So, changes can be made in the color, design, graphics or any other component to create a unique layout.
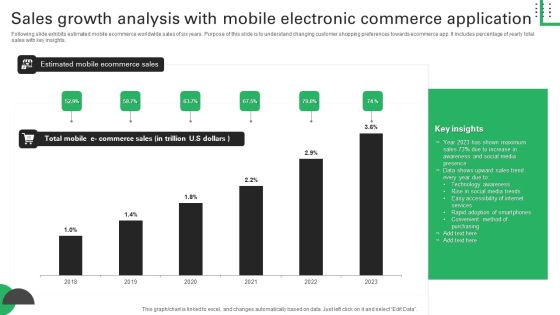
Sales Growth Analysis With Mobile Electronic Commerce Application Structure PDF
Following slide exhibits estimated mobile ecommerce worldwide sales of six years. Purpose of this slide is to understand changing customer shopping preferences towards ecommerce app. It includes percentage of yearly total sales with key insights. Pitch your topic with ease and precision using this Sales Growth Analysis With Mobile Electronic Commerce Application Structure PDF. This layout presents information on Shown Maximum, Awareness Social Media, Accessibility Internet. It is also available for immediate download and adjustment. So, changes can be made in the color, design, graphics or any other component to create a unique layout.

Comparative Assessment Of Annual Sales Result Evaluation Elements PDF
This slide signifies the comparative analysis of yearly sales result comparison to increase business growth. It includes various strategies that are being implemented by the organisation to achieve growth in each quarter Pitch your topic with ease and precision using this Comparative Assessment Of Annual Sales Result Evaluation Elements PDF. This layout presents information on Telecalling Strategy, Product Sales, Product Lower. It is also available for immediate download and adjustment. So, changes can be made in the color, design, graphics or any other component to create a unique layout.

Executive Summary Of Annual Sales Performance Topics PDF
The following slide highlights the sales performance for the year 2021 to track the achievements and assist further decision making. It also includes key highlights, performance indicators, growth stimulators, channel mix etc. Pitch your topic with ease and precision using this Executive Summary Of Annual Sales Performance Topics PDF. This layout presents information on Growth Stimulators, Sales, Value Proposition. It is also available for immediate download and adjustment. So, changes can be made in the color, design, graphics or any other component to create a unique layout.

KPI Dashboard To Measure Sales Divisional Strategy Performance Microsoft PDF
This slide signifies the key performance indicator dashboard to evaluate sales department strategy. It covers information regarding to the leads generated, conversion rate, top product in revenue. Pitch your topic with ease and precision using this KPI Dashboard To Measure Sales Divisional Strategy Performance Microsoft PDF. This layout presents information on Sales Rations, Lead Generation, Customer Conversion. It is also available for immediate download and adjustment. So, changes can be made in the color, design, graphics or any other component to create a unique layout.

Year Over Year Comparison Of Companys Sales Data Microsoft PDF
The purpose of this slide is to illustrate a valuable procedure that demonstrates to business owners how their growth has changed from the prior to the present year. It includes the sales comparison of five different companies for the years 2023 2022. Pitch your topic with ease and precision using this Year Over Year Comparison Of Companys Sales Data Microsoft PDF. This layout presents information on Sales Data Comparison, Liberal Government, Increase Investments. It is also available for immediate download and adjustment. So, changes can be made in the color, design, graphics or any other component to create a unique layout.
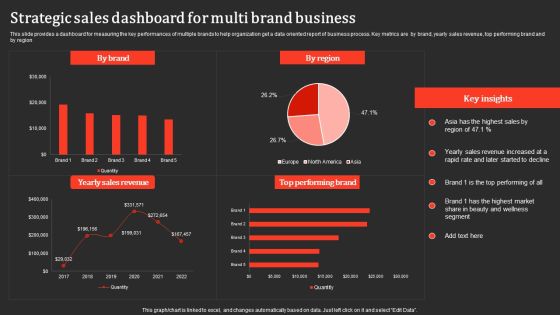
Strategic Sales Dashboard For Multi Brand Business Professional PDF
This slide provides a dashboard for measuring the key performances of multiple brands to help organization get a data oriented report of business process. Key metrics are by brand, yearly sales revenue, top performing brand and by region. Pitch your topic with ease and precision using this Strategic Sales Dashboard For Multi Brand Business Professional PDF. This layout presents information on Yearly Sales Revenue, Performing Brand. It is also available for immediate download and adjustment. So, changes can be made in the color, design, graphics or any other component to create a unique layout.

Customer Decline Of Sales Analysis Dashboard Rules PDF
The following slide presents a key performance indicating dashboards that can be used by managers in order to analyse customer-lost sales. Major key performance indicators are lost deals rate, lost sales rate, customer data analytics, etc. Pitch your topic with ease and precision using this Customer Decline Of Sales Analysis Dashboard Rules PDF. This layout presents information on Customer Data Analytics. It is also available for immediate download and adjustment. So, changes can be made in the color, design, graphics or any other component to create a unique layout.

Business Sales Contribution For Domestic And International Market Portrait PDF
This slide highlights the business sales contribution for domestic market, international market and other market for the year of 2022 and 2023 with key takeaways. Presenting this PowerPoint presentation, titled Business Sales Contribution For Domestic And International Market Portrait PDF, with topics curated by our researchers after extensive research. This editable presentation is available for immediate download and provides attractive features when used. Download now and captivate your audience. Presenting this Business Sales Contribution For Domestic And International Market Portrait PDF. Our researchers have carefully researched and created these slides with all aspects taken into consideration. This is a completely customizable Business Sales Contribution For Domestic And International Market Portrait PDF that is available for immediate downloading. Download now and make an impact on your audience. Highlight the attractive features available with our PPTs.

Impact Of Poor Risk Analysis On Sales Performance Information PDF
The following slide depicts the influence of inappropriate risk assessment on annual sales to review and control threats within the organization. It includes monthly sales amount along with key insights etc. Do you have an important presentation coming up Are you looking for something that will make your presentation stand out from the rest Look no further than Impact Of Poor Risk Analysis On Sales Performance Information PDF. With our professional designs, you can trust that your presentation will pop and make delivering it a smooth process. And with Slidegeeks, you can trust that your presentation will be unique and memorable. So why wait Grab Impact Of Poor Risk Analysis On Sales Performance Information PDF today and make your presentation stand out from the rest.

Sales Departmental Goals Achievement Graph Ppt Inspiration Slide Download PDF
This slide illustrates graphical representation of achievement percentage of each team member. It includes achievement percent, name, due date and target of respective member. Pitch your topic with ease and precision using this Sales Departmental Goals Achievement Graph Ppt Inspiration Slide Download PDF. This layout presents information on Sales Departmental, Goals, Achievement Graph. It is also available for immediate download and adjustment. So, changes can be made in the color, design, graphics or any other component to create a unique layout.
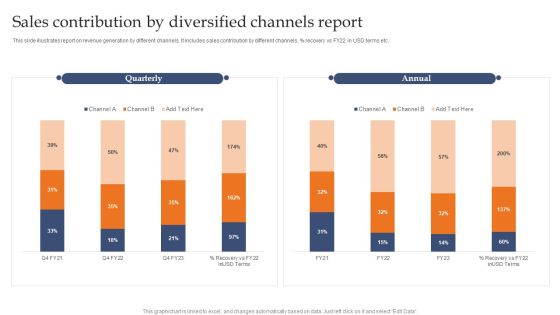
Sales Contribution By Diversified Channels Report Demonstration PDF
This slide illustrates report on revenue generation by different channels. It includes sales contribution by different channels, precent recovery vs FY22 in USD terms etc.Pitch your topic with ease and precision using this Sales Contribution By Diversified Channels Report Demonstration PDF. This layout presents information on Quarterly, Annual, Channel. It is also available for immediate download and adjustment. So, changes can be made in the color, design, graphics or any other component to create a unique layout.

Weekly Sales Performance KPI Dashboard For Revenue Generation Brochure PDF
The following slide exhibits dashboard to maintain revenue and management under control. It presents information related to profits, cross selling, costs, etc. Pitch your topic with ease and precision using this Weekly Sales Performance KPI Dashboard For Revenue Generation Brochure PDF. This layout presents information on Total Sales, Revenue, Profit, Cost. It is also available for immediate download and adjustment. So, changes can be made in the color, design, graphics or any other component to create a unique layout.

Artificial Intelligence Sales Capabilities And Revenue Dashboard Portrait PDF
This slide illustrates artificial intelligence and business intelligence corporate revenue dashboard. It includes pipeline for Aug 2023, revenue for Sep 2023, AI augmented opportunities etc. Pitch your topic with ease and precision using this Artificial Intelligence Sales Capabilities And Revenue Dashboard Portrait PDF. This layout presents information on Sales Capabilities, Revenue Dashboard. It is also available for immediate download and adjustment. So, changes can be made in the color, design, graphics or any other component to create a unique layout.

Online Marketing Activities KPI Dashboard To Improve Sales Ideas PDF
This slide covers online marketing dashboard to improve sales. It involves details such as web performance, conversion funnel, revenue this month, traffic sources and number of followers on social media.Pitch your topic with ease and precision using this Online Marketing Activities KPI Dashboard To Improve Sales Ideas PDF. This layout presents information on Email Performance, Web Performance, Cost Conversion. It is also available for immediate download and adjustment. So, changes can be made in the color, design, graphics or any other component to create a unique layout.
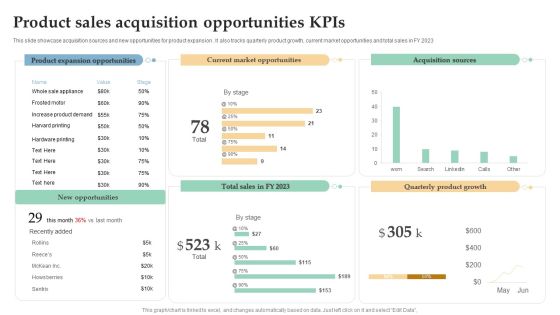
Product Sales Acquisition Opportunities Kpis Ppt Pictures Slide PDF
This slide showcase acquisition sources and new opportunities for product expansion . It also tracks quarterly product growth, current market opportunities and total sales in FY 2023. Pitch your topic with ease and precision using this Product Sales Acquisition Opportunities Kpis Ppt Pictures Slide PDF. This layout presents information on Product Expansion Opportunities, Current Market Opportunities, Acquisition Sources. It is also available for immediate download and adjustment. So, changes can be made in the color, design, graphics or any other component to create a unique layout.

Sales Product Performance And Growth Kpis Ppt Layouts Mockup PDF
This slide displays a breakdown of sales results by particular product to monitor product demand and also to project product growth in the market. It includes units sold, annual income, and product revenue. Pitch your topic with ease and precision using this Sales Product Performance And Growth Kpis Ppt Layouts Mockup PDF. This layout presents information on Monthly Revenue, Product, Product Units. It is also available for immediate download and adjustment. So, changes can be made in the color, design, graphics or any other component to create a unique layout.
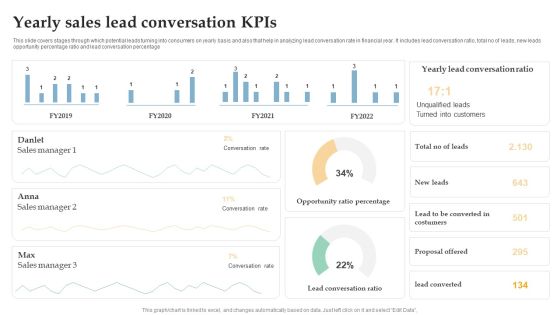
Yearly Sales Lead Conversation Kpis Ppt Inspiration Brochure PDF
This slide covers stages through which potential leads turning into consumers on yearly basis and also that help in analyzing lead conversation rate in financial year. It includes lead conversation ratio, total no of leads, new leads opportunity percentage ratio and lead conversation percentage. Pitch your topic with ease and precision using this Yearly Sales Lead Conversation Kpis Ppt Inspiration Brochure PDF. This layout presents information on Sales Manager, Conversation Rate, Opportunity Ratio Percentage. It is also available for immediate download and adjustment. So, changes can be made in the color, design, graphics or any other component to create a unique layout.

Account Based Promotion Engagement Dashboard For Sales Background PDF
This slide covers account based marketing engagement dashboard for sales. It involves details such as total number of targeted accounts, open opportunity amount, close opportunity amount etc. Pitch your topic with ease and precision using this Account Based Promotion Engagement Dashboard For Sales Background PDF. This layout presents information on Target Accounts, Open Opportunity Amount, Close Opportunity Amount. It is also available for immediate download and adjustment. So, changes can be made in the color, design, graphics or any other component to create a unique layout.
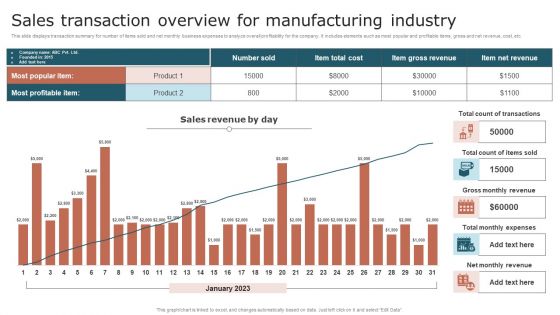
Sales Transaction Overview For Manufacturing Industry Elements PDF
This slide displays transaction summary for number of items sold and net monthly business expenses to analyze overall profitability for the company. It includes elements such as most popular and profitable items, gross and net revenue, cost, etc. Pitch your topic with ease and precision using this Sales Transaction Overview For Manufacturing Industry Elements PDF. This layout presents information on Product, Sales Revenue, Transactions. It is also available for immediate download and adjustment. So, changes can be made in the color, design, graphics or any other component to create a unique layout.
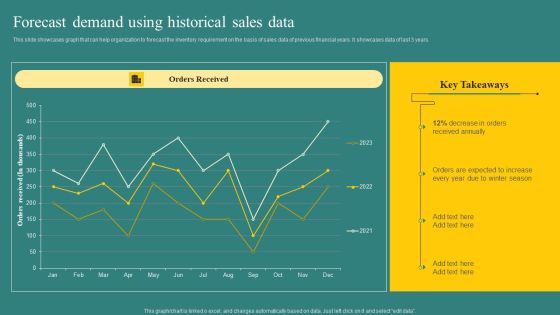
Forecast Demand Using Historical Sales Data Background PDF
This slide showcases graph that can help organization to forecast the inventory requirement on the basis of sales data of previous financial years. It showcases data of last 3 years. Take your projects to the next level with our ultimate collection of Forecast Demand Using Historical Sales Data Background PDF. Slidegeeks has designed a range of layouts that are perfect for representing task or activity duration, keeping track of all your deadlines at a glance. Tailor these designs to your exact needs and give them a truly corporate look with your own brand colors they will make your projects stand out from the rest.
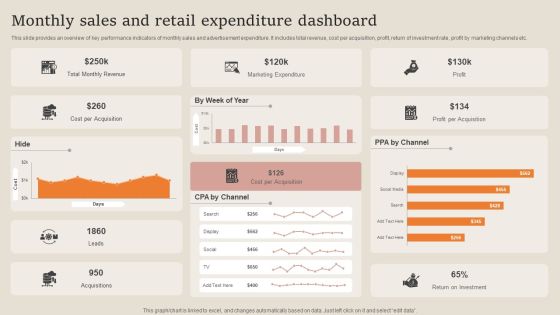
Monthly Sales And Retail Expenditure Dashboard Summary PDF
This slide provides an overview of key performance indicators of monthly sales and advertisement expenditure. It includes total revenue, cost per acquisition, profit, return of investment rate, profit by marketing channels etc. Pitch your topic with ease and precision using this Monthly Sales And Retail Expenditure Dashboard Summary PDF. This layout presents information on Marketing Expenditure, Revenue, Cost Per Acquisition. It is also available for immediate download and adjustment. So, changes can be made in the color, design, graphics or any other component to create a unique layout.

Sales Evaluation Finance Ppt PowerPoint Presentation Inspiration Aids
Presenting this set of slides with name sales evaluation finance ppt powerpoint presentation inspiration aids. The topics discussed in these slides are finance, marketing, management, investment, analysis. This is a completely editable PowerPoint presentation and is available for immediate download. Download now and impress your audience.

Actual Vs Target Sales Analysis Ppt PowerPoint Presentation Summary Demonstration
Presenting this set of slides with name actual vs target sales analysis ppt powerpoint presentation summary demonstration. The topics discussed in these slides are finance, marketing, management, investment, analysis. This is a completely editable PowerPoint presentation and is available for immediate download. Download now and impress your audience.

Sales Product Performance Dashboard Ppt PowerPoint Presentation Pictures Deck
Presenting this set of slides with name sales product performance dashboard ppt powerpoint presentation pictures deck. The topics discussed in these slides are finance, marketing, management, investment, analysis. This is a completely editable PowerPoint presentation and is available for immediate download. Download now and impress your audience.

Actual Vs Target Sales Analysis Ppt PowerPoint Presentation Professional Slideshow
Presenting this set of slides with name actual vs target sales analysis ppt powerpoint presentation professional slideshow. The topics discussed in these slides are finance, marketing, management, investment, analysis. This is a completely editable PowerPoint presentation and is available for immediate download. Download now and impress your audience.

Sales Product Performance Dashboard Ppt PowerPoint Presentation Styles Files
Presenting this set of slides with name sales product performance dashboard ppt powerpoint presentation styles files. The topics discussed in these slides are finance, marketing, management, investment, analysis. This is a completely editable PowerPoint presentation and is available for immediate download. Download now and impress your audience.

Bar Graph For Sales Inflow And Goals Graph Ppt PowerPoint Presentation Infographics Visual Aids PDF
Pitch your topic with ease and precision using this bar graph for sales inflow and goals graph ppt powerpoint presentation infographics visual aids pdf. This layout presents information on sales revenue vs target, new customer, congrats target is met. It is also available for immediate download and adjustment. So, changes can be made in the color, design, graphics or any other component to create a unique layout.

Comparative Analysis Of Budgeted And Actual Sales Rules PDF
The following slide depicts the analysis of projected and actual sales performance post risk management to evaluate its success. It mainly includes revenue generated during 2021 and 2022 along with gross profit margin etc. This Comparative Analysis Of Budgeted And Actual Sales Rules PDF from Slidegeeks makes it easy to present information on your topic with precision. It provides customization options, so you can make changes to the colors, design, graphics, or any other component to create a unique layout. It is also available for immediate download, so you can begin using it right away. Slidegeeks has done good research to ensure that you have everything you need to make your presentation stand out. Make a name out there for a brilliant performance.

Daily Reports Analysis Of Various Sales Representatives Ppt Portfolio Design Inspiration PDF
Deliver and pitch your topic in the best possible manner with this daily reports analysis of various sales representatives ppt portfolio design inspiration pdf. Use them to share invaluable insights on opportunities, sales, leads created and impress your audience. This template can be altered and modified as per your expectations. So, grab it now.

Bar Graph Showing Sales Projections Ppt PowerPoint Presentation Styles Graphics Download PDF
Presenting this set of slides with name bar graph showing sales projections ppt powerpoint presentation styles graphics download pdf. The topics discussed in these slides are Sales, Forecasted Sales. This is a completely editable PowerPoint presentation and is available for immediate download. Download now and impress your audience.

Business Management Strategy Survey To Boost Sales Summary PDF
This slide illustrate survey result of various promotional tactics used by top 1000 multi national companies to promote their product and services. it includes promotional strategies such as online advertisement, business directory, social media platforms etc. Pitch your topic with ease and precision using this Business Management Strategy Survey To Boost Sales Summary PDF. This layout presents information on Advertisement Strategy, Organization, Social Median. It is also available for immediate download and adjustment. So, changes can be made in the color, design, graphics or any other component to create a unique layout.

Bar Graph Showing Sales Performance Dashboard Ppt PowerPoint Presentation File Design Ideas PDF
Presenting this set of slides with name bar graph showing sales performance dashboard ppt powerpoint presentation file design ideas pdf. The topics discussed in these slide is bar graph showing sales performance dashboard. This is a completely editable PowerPoint presentation and is available for immediate download. Download now and impress your audience.

Bar Graph For Business Sales And Profit Assessment Ppt PowerPoint Presentation File Tips PDF
Presenting this set of slides with name bar graph for business sales and profit assessment ppt powerpoint presentation file tips pdf. The topics discussed in these slides are sales, gross margin, net profit. This is a completely editable PowerPoint presentation and is available for immediate download. Download now and impress your audience.

Bar Graph Showing Sales Cost And Profit Analysis Ppt PowerPoint Presentation Infographics Images PDF
Presenting this set of slides with name bar graph showing sales cost and profit analysis ppt powerpoint presentation infographics images pdf. The topics discussed in these slides are sales, cost, roi, profit. This is a completely editable PowerPoint presentation and is available for immediate download. Download now and impress your audience.
Real Estate Finance Dashboard With Monthly Sales And Properties Listed Ppt Gallery Icons PDF
This slide shows a Real Estate Finance Dashboard with variables such as monthly sales, properties listed, new listings, average days on market, commission paid etc. Deliver an awe inspiring pitch with this creative real estate finance dashboard with monthly sales and properties listed ppt gallery icons pdf bundle. Topics like real estate finance dashboard with monthly sales and properties listed can be discussed with this completely editable template. It is available for immediate download depending on the needs and requirements of the user.

Customer Relationship Management Lifecycle Analytics Dashboard With Sales Record Brochure PDF
This slide signifies the customer relationship management analytics dashboard. It covers information about sales record by different representative, total products sold, sales by different month, etc.Pitch your topic with ease and precision using this Customer Relationship Management Lifecycle Analytics Dashboard With Sales Record Brochure PDF. This layout presents information on Sales Record, Representative, Total Items. It is also available for immediate download and adjustment. So, changes can be made in the color, design, graphics or any other component to create a unique layout.
Monthly Statistical Analysis For Daily Product Sales Ppt PowerPoint Presentation Show Icon PDF
Presenting this set of slides with name monthly statistical analysis for daily product sales ppt powerpoint presentation show icon pdf. The topics discussed in these slides are month, day, revenue. This is a completely editable PowerPoint presentation and is available for immediate download. Download now and impress your audience.

Evolving Target Consumer List Through Sectionalization Techniques Sales Performance Yearly And Quarterly Brochure PDF
Following slide illustrates sales performance of the firm both yearly as well as quarterly. Number of units sold in 2020 are 61,213. Deliver and pitch your topic in the best possible manner with this evolving target consumer list through sectionalization techniques sales performance yearly and quarterly brochure pdf. Use them to share invaluable insights on yearly sales performance, quarterly sales performance and impress your audience. This template can be altered and modified as per your expectations. So, grab it now.

Implementation Plan For New Product Launch Sales Performance Over Last Three Years Guidelines PDF
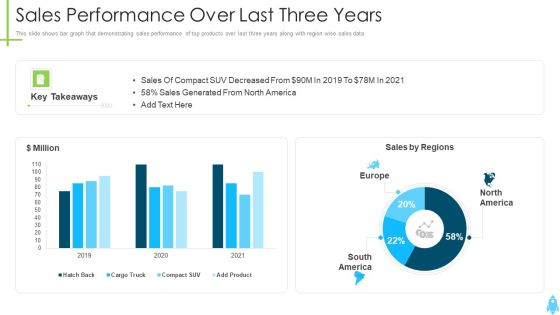
This slide shows bar graph that demonstrating sales performance of top products over last three years along with region wise sales data. Deliver an awe inspiring pitch with this creative implementation plan for new product launch sales performance over last three years guidelines pdf bundle. Topics like sales performance over last three years can be discussed with this completely editable template. It is available for immediate download depending on the needs and requirements of the user.

Dual Branding Campaign To Boost Sales Of Product Or Services Clustered Bar Mockup PDF
This Dual Branding Campaign To Boost Sales Of Product Or Services Clustered Bar Mockup PDF is perfect for any presentation, be it in front of clients or colleagues. It is a versatile and stylish solution for organizing your meetings. TheDual Branding Campaign To Boost Sales Of Product Or Services Clustered Bar Mockup PDF features a modern design for your presentation meetings. The adjustable and customizable slides provide unlimited possibilities for acing up your presentation. Slidegeeks has done all the homework before launching the product for you. So, do not wait, grab the presentation templates today
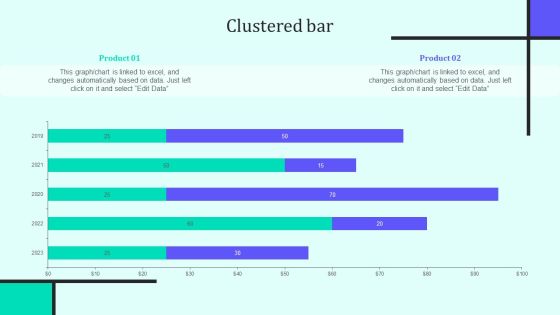
Implementing New Sales And Marketing Process For Services Clustered Bar Rules PDF
Find a pre designed and impeccable Implementing New Sales And Marketing Process For Services Clustered Bar Rules PDF. The templates can ace your presentation without additional effort. You can download these easy to edit presentation templates to make your presentation stand out from others. So, what are you waiting for Download the template from Slidegeeks today and give a unique touch to your presentation.

Nuclear Warning Sign Ppt Sales Business Plan PowerPoint Templates
Doll up your thoughts with our nuclear warning sign ppt sales business plan PowerPoint templates. They will make a pretty picture. They say a dog is man's best friend. Our Signs Powerpoint templates come a close second. Establish the dominance of your ideas. Our Flow Charts Powerpoint templates will put them on top.
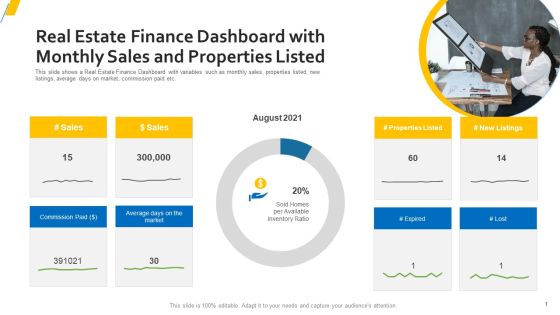
Real Estate Finance Dashboard With Monthly Sales And Properties Listed Microsoft PDF
Deliver an awe-inspiring pitch with this creative real estate finance dashboard with monthly sales and properties listed microsoft pdf. bundle. Topics like average days on the market, sales can be discussed with this completely editable template. It is available for immediate download depending on the needs and requirements of the user.
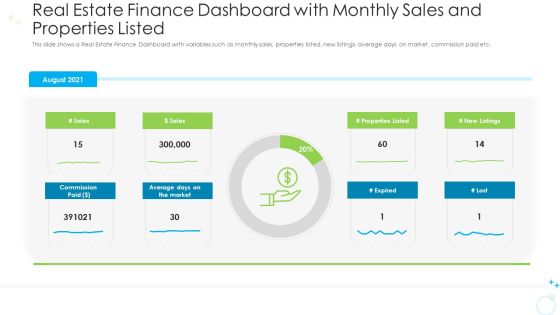
Real Estate Finance Dashboard With Monthly Sales And Properties Listed Ppt Gallery Visual Aids Pdf
Deliver and pitch your topic in the best possible manner with this real estate finance dashboard with monthly sales and properties listed ppt gallery visual aids pdf. Use them to share invaluable insights on average, market, sales and impress your audience. This template can be altered and modified as per your expectations. So, grab it now.
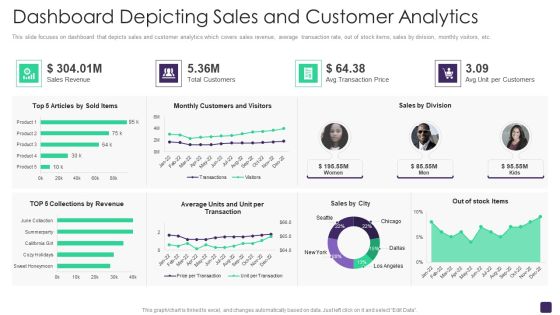
Retail Merchandising Program Dashboard Depicting Sales And Customer Analytics Topics PDF
This slide focuses on dashboard that depicts sales and customer analytics which covers sales revenue, average transaction rate, out of stock items, sales by division, monthly visitors, etc. Deliver an awe inspiring pitch with this creative Retail Merchandising Program Dashboard Depicting Sales And Customer Analytics Topics PDF bundle. Topics like Sales Revenue, Total Customers, Avg Transaction Price, Sales Division can be discussed with this completely editable template. It is available for immediate download depending on the needs and requirements of the user.
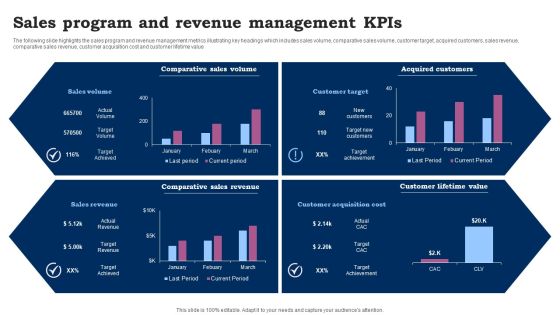
Sales Program And Revenue Management Kpis Ppt Outline Slide Download PDF
The following slide highlights the sales program and revenue management metrics illustrating key headings which includes sales volume, comparative sales volume, customer target, acquired customers, sales revenue, comparative sales revenue, customer acquisition cost and customer lifetime value. Showcasing this set of slides titled Sales Program And Revenue Management Kpis Ppt Outline Slide Download PDF. The topics addressed in these templates are Comparative Sales Volume, Acquired Customers, Comparative Sales Revenue. All the content presented in this PPT design is completely editable. Download it and make adjustments in color, background, font etc. as per your unique business setting.
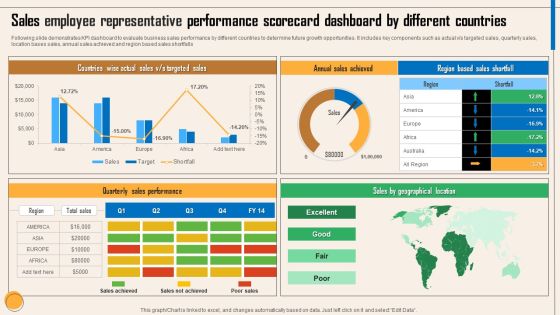
Sales Employee Representative Performance Scorecard Dashboard By Different Countries Themes PDF
Following slide demonstrates KPI dashboard to evaluate business sales performance by different countries to determine future growth opportunities. It includes key components such as actual v or s targeted sales, quarterly sales, location bases sales, annual sales achieved and region based sales shortfalls. Showcasing this set of slides titled Sales Employee Representative Performance Scorecard Dashboard By Different Countries Themes PDF. The topics addressed in these templates are Countries Wise Actual Sales, V Or S Targeted Sales, Annual Sales Achieved, Quarterly Sales Performance, Sales By Geographical Location. All the content presented in this PPT design is completely editable. Download it and make adjustments in color, background, font etc. as per your unique business setting.
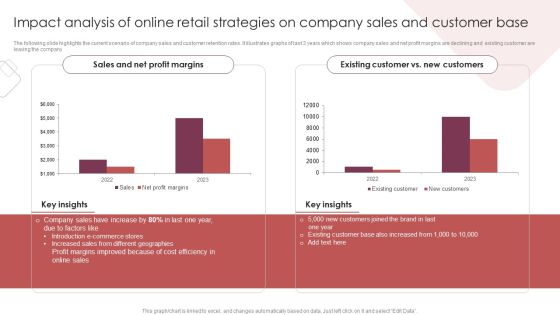
E Commerce Marketing Techniques To Boost Sales Impact Analysis Of Online Retail Strategies On Company Sales And Customer Base Slides PDF
The following slide highlights the current scenario of company sales and customer retention rates. It illustrates graphs of last 3 years which shows company sales and net profit margins are declining and existing customer are leaving the company. Explore a selection of the finest E Commerce Marketing Techniques To Boost Sales Impact Analysis Of Online Retail Strategies On Company Sales And Customer Base Slides PDF here. With a plethora of professionally designed and pre-made slide templates, you can quickly and easily find the right one for your upcoming presentation. You can use our E Commerce Marketing Techniques To Boost Sales Impact Analysis Of Online Retail Strategies On Company Sales And Customer Base Slides PDF to effectively convey your message to a wider audience. Slidegeeks has done a lot of research before preparing these presentation templates. The content can be personalized and the slides are highly editable. Grab templates today from Slidegeeks.
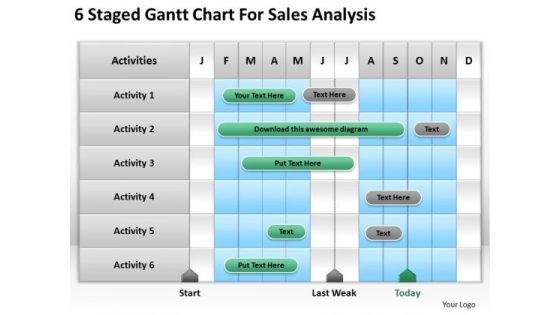
Business PowerPoint Template Sales Analysis Ppt Templates Backgrounds For Slides
Touch base with our Business powerpoint template sales analysis ppt templates backgrounds for slides. Review your growth with your audience. Take a deep dive with our Competition PowerPoint Templates. Get into the nitty gritty of it all. Plan your storyboard with our Org Charts PowerPoint Templates. Give an outline to the solutions you have.
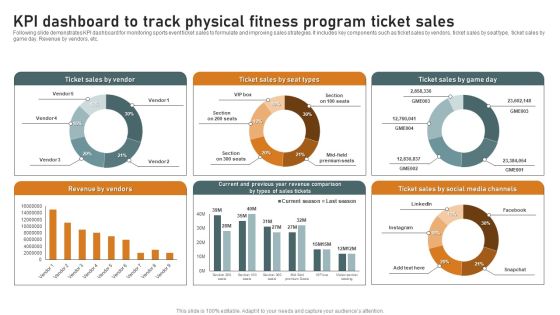
KPI Dashboard To Track Physical Fitness Program Ticket Sales Summary PDF
Following slide demonstrates KPI dashboard for monitoring sports event ticket sales to formulate and improving sales strategies. It includes key components such as ticket sales by vendors, ticket sales by seat type, ticket sales by game day. Revenue by vendors, etc. Showcasing this set of slides titled KPI Dashboard To Track Physical Fitness Program Ticket Sales Summary PDF. The topics addressed in these templates are Revenue By Vendors, Sales By Vendor, Social Media Channels. All the content presented in this PPT design is completely editable. Download it and make adjustments in color, background, font etc. as per your unique business setting.
Purchase Assessment Process Current Situation Decrease In Sales Because Of Supplier Problems Sample PDF
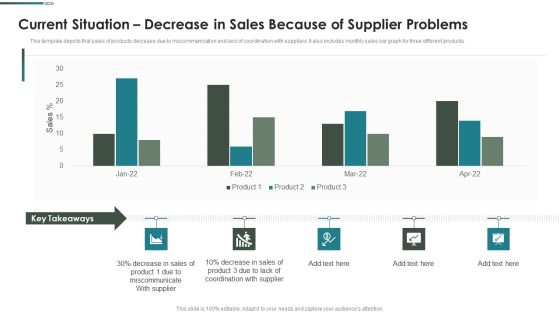
This template depicts that sales of products decrease due to miscommunication and lack of coordination with suppliers. It also includes monthly sales bar graph for three different products.Deliver an awe inspiring pitch with this creative Purchase Assessment Process Current Situation Decrease In Sales Because Of Supplier Problems Sample PDF bundle. Topics like Coordination Supplier, Miscommunicate Supplier, Decrease Sale can be discussed with this completely editable template. It is available for immediate download depending on the needs and requirements of the user.

Key Statistics Of Mobile E Commerce Sales Developing Online Consumer Engagement Program Infographics PDF
This slide covers key statistics of mobile e commerce sales that shows mobile share in total e commerce sales which depicts increasing number of online sales in six consecutive years.Deliver an awe inspiring pitch with this creative Key Statistics Of Mobile E Commerce Sales Developing Online Consumer Engagement Program Infographics PDF bundle. Topics like Subsequent Increase, Ecommerce Sales, Captures Maximum can be discussed with this completely editable template. It is available for immediate download depending on the needs and requirements of the user.
Product Kick Off Strategy Sales Performance Over Last Three Years Formats PDF
This slide shows bar graph that demonstrating sales performance of top products over last three years along with region wise sales data. Deliver an awe inspiring pitch with this creative product kick off strategy sales performance over last three years formats pdf bundle. Topics like sales performance over last three years can be discussed with this completely editable template. It is available for immediate download depending on the needs and requirements of the user.

Go To Market Strategy For New Product Sales Performance Over Last Three Years Guidelines PDF
This slide shows bar graph that demonstrating sales performance of top products over last three years along with region wise sales data. Deliver an awe inspiring pitch with this creative go to market strategy for new product sales performance over last three years guidelines pdf bundle. Topics like sales performance over last three years can be discussed with this completely editable template. It is available for immediate download depending on the needs and requirements of the user.
Marketing Strategy New Product Introduction Sales Performance Over Last Three Years Slides PDF
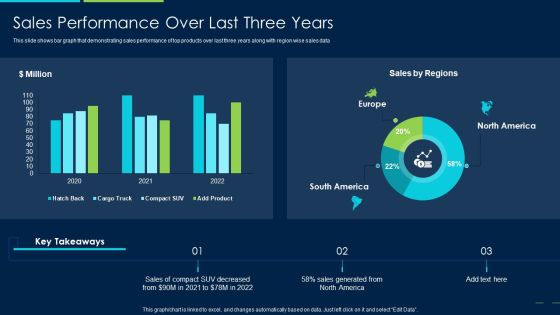
This slide shows bar graph that demonstrating sales performance of top products over last three years along with region wise sales data Deliver and pitch your topic in the best possible manner with this marketing strategy new product introduction sales performance over last three years slides pdf. Use them to share invaluable insights on sales performance over last three years and impress your audience. This template can be altered and modified as per your expectations. So, grab it now.

Approaches For New Product Release Sales Performance Over Last Three Years Graphics PDF
This slide shows bar graph that demonstrating sales performance of top products over last three years along with region wise sales data Deliver an awe inspiring pitch with this creative approaches for new product release sales performance over last three years graphics pdf bundle. Topics like sales performance over last three years can be discussed with this completely editable template. It is available for immediate download depending on the needs and requirements of the user.
Multiple Phases For Supply Chain Management Sales Forecasting Growth Summary PDF
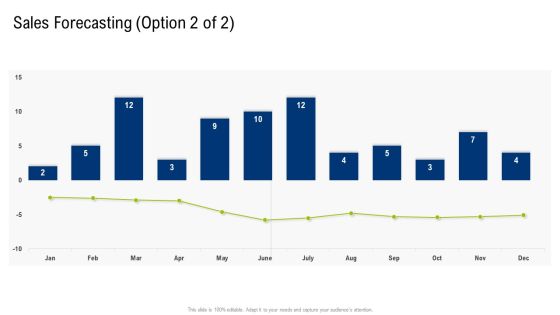
Deliver and pitch your topic in the best possible manner with this multiple phases for supply chain management sales forecasting growth summary pdf. Use them to share invaluable insights on sales forecasting and impress your audience. This template can be altered and modified as per your expectations. So, grab it now.

Multiple Phases For Supply Chain Management Sales Forecasting Roadmap Portrait PDF
Deliver an awe inspiring pitch with this creative multiple phases for supply chain management sales forecasting roadmap portrait pdf bundle. Topics like sales forecasting can be discussed with this completely editable template. It is available for immediate download depending on the needs and requirements of the user.
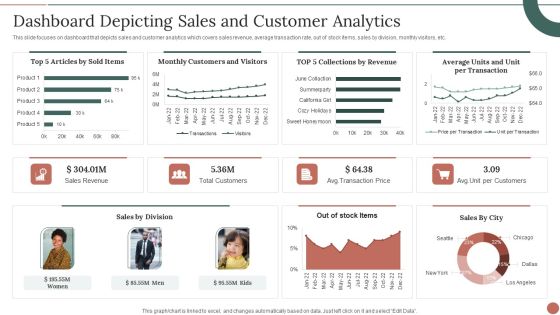
Retail Business Product Planning Procedure Dashboard Depicting Sales And Customer Analytics Themes PDF
This slide focuses on dashboard that depicts sales and customer analytics which covers sales revenue, average transaction rate, out of stock items, sales by division, monthly visitors, etc. Deliver and pitch your topic in the best possible manner with this Retail Business Product Planning Procedure Dashboard Depicting Sales And Customer Analytics Themes PDF. Use them to share invaluable insights on Sales Revenue, Total Customers, Sales By Division and impress your audience. This template can be altered and modified as per your expectations. So, grab it now.

Refurbishing The Product Advertising Plan Sales Revenue From New Product Ppt Layout PDF
Following graph highlights the sales revenue achieved by the firm on introducing new product. August month is recorded with the highest sales revenue mark.Deliver and pitch your topic in the best possible manner with this refurbishing the product advertising plan sales revenue from new product ppt layout pdf. Use them to share invaluable insights on sales revenue from new product and impress your audience. This template can be altered and modified as per your expectations. So, grab it now.

Online Marketing Strategy For Lead Generation Analyzing Impact Of Performance Marketing Campaigns Template PDF
This slide showcases impact of performance marketing campaigns which can help organization to evaluate the effectiveness of executed plan. Its key elements are website traffic and product sales. The Online Marketing Strategy For Lead Generation Analyzing Impact Of Performance Marketing Campaigns Template PDF is a compilation of the most recent design trends as a series of slides. It is suitable for any subject or industry presentation, containing attractive visuals and photo spots for businesses to clearly express their messages. This template contains a variety of slides for the user to input data, such as structures to contrast two elements, bullet points, and slides for written information. Slidegeeks is prepared to create an impression.

Creating Successful Advertising Campaign Sales Revenue From New Product Icons PDF
Following graph highlights the sales revenue achieved by the firm on introducing new product. August month is recorded with the highest sales revenue mark. Deliver an awe inspiring pitch with this creative creating successful advertising campaign sales revenue from new product icons pdf bundle. Topics like sales revenue from new product can be discussed with this completely editable template. It is available for immediate download depending on the needs and requirements of the user.

Current Situation Decrease In Sales Because Of Supplier Problems Mockup PDF
This template depicts that sales of products decrease due to miscommunication and lack of coordination with suppliers. It also includes monthly sales bar graph for three different products.Deliver and pitch your topic in the best possible manner with this Current Situation Decrease In Sales Because Of Supplier Problems Mockup PDF. Use them to share invaluable insights on Miscommunicate, Supplier, Coordination and impress your audience. This template can be altered and modified as per your expectations. So, grab it now.

 Home
Home