Waterfall Chart
Accounts And Graph Business PowerPoint Templates And PowerPoint Backgrounds 0511
Microsoft PowerPoint Template and Background with an accounts bar charts in different colors

Smart Home Security Solutions Company Profile Security Company Sales Revenue By Market Themes PDF
This slide highlights the security company sales revenue by market share and commodity in pie chart format which includes Northeast, Southwest, Southeast, Midwest regions sales revenue. Deliver an awe inspiring pitch with this creative Smart Home Security Solutions Company Profile Security Company Sales Revenue By Market Themes PDF bundle. Topics like Sales Revenue Market, Sales Revenue Product, Wireless And Networking can be discussed with this completely editable template. It is available for immediate download depending on the needs and requirements of the user.

Accounts And Graph Business PowerPoint Themes And PowerPoint Slides 0511
Microsoft PowerPoint Theme and Slide with an accounts bar charts in different colors
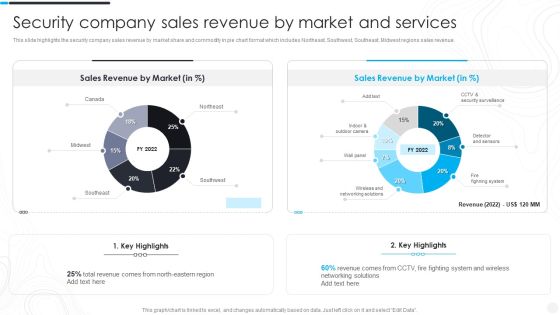
Security Camera System Company Profile Security Company Sales Revenue Template PDF
This slide highlights the security company sales revenue by market share and commodity in pie chart format which includes Northeast, Southwest, Southeast, Midwest regions sales revenue.Deliver an awe inspiring pitch with this creative Security Camera System Company Profile Security Company Sales Revenue Template PDF bundle. Topics like Detector And Sensors, Fighning System, Security Surveillance can be discussed with this completely editable template. It is available for immediate download depending on the needs and requirements of the user.

Security And Surveillance Company Profile Security Company Sales Revenue Clipart PDF
This slide highlights the security company sales revenue by market share and commodity in pie chart format which includes Northeast, Southwest, Southeast, Midwest regions sales revenue.Deliver an awe inspiring pitch with this creative Security And Surveillance Company Profile Security Company Sales Revenue Clipart PDF bundle. Topics like Sales Revenue, Security Surveillance, Networking Solutions can be discussed with this completely editable template. It is available for immediate download depending on the needs and requirements of the user.

International Trading Business Export Company Trading Company Sales Revenue By Market And Commodity Elements PDF
This slide highlights the trading company sales revenue by market share and commodity in pie chart format which includes asia pacific, north america, south africa and europe market.Deliver an awe inspiring pitch with this creative International Trading Business Export Company Trading Company Sales Revenue By Market And Commodity Elements PDF bundle. Topics like Sales Revenue, Revenue Commodity, Sales Comes can be discussed with this completely editable template. It is available for immediate download depending on the needs and requirements of the user.
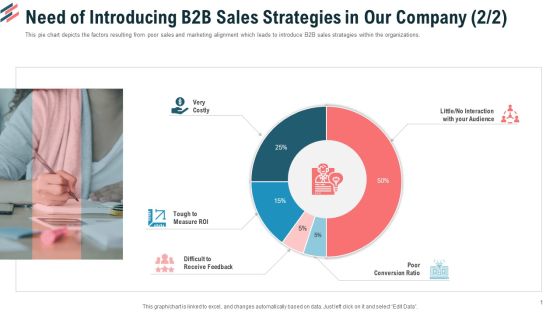
Need Of Introducing B2B Sales Strategies In Our Company Poor Ppt Model Smartart PDF
This pie chart depicts the factors resulting from poor sales and marketing alignment which leads to introduce B2B sales strategies within the organizations.Deliver and pitch your topic in the best possible manner with this need of introducing b2b sales strategies in our company poor ppt model smartart pdf. Use them to share invaluable insights on very costly, tough to measure roi, poor conversion ratio and impress your audience. This template can be altered and modified as per your expectations. So, grab it now.

Automobile Sales Scorecard With Unit Sold And Average Price Statistics Formats PDF
This graph or chart is linked to excel, and changes automatically based on data. Just left click on it and select Edit Data. Deliver an awe inspiring pitch with this creative Automobile Sales Scorecard With Unit Sold And Average Price Statistics Formats PDF bundle. Topics like Automobile Sales Scorecard, Unit Sold Revenue, Average Price Statistics can be discussed with this completely editable template. It is available for immediate download depending on the needs and requirements of the user.

Auto Sales Profit Scorecard For Two And Four Wheeler Vehicles Inspiration PDF
This graph or chart is linked to excel, and changes automatically based on data. Just left click on it and select Edit Data. Deliver an awe inspiring pitch with this creative Auto Sales Profit Scorecard For Two And Four Wheeler Vehicles Inspiration PDF bundle. Topics like Two Wheeler Vehicles, Four Wheeler Vehicles, Six Wheeler Vehicles can be discussed with this completely editable template. It is available for immediate download depending on the needs and requirements of the user.

BANT Sales Lead Qualification Model Our Revenue For The Future Mockup PDF
This graph or chart is linked to excel and change automatically based on data. Just left click on it and select Edit Data. Deliver an awe inspiring pitch with this creative BANT Sales Lead Qualification Model Our Revenue For The Future Mockup PDF bundle. Topics like Continues Decline, Marketing Strategy, 2017 To 2022 can be discussed with this completely editable template. It is available for immediate download depending on the needs and requirements of the user.
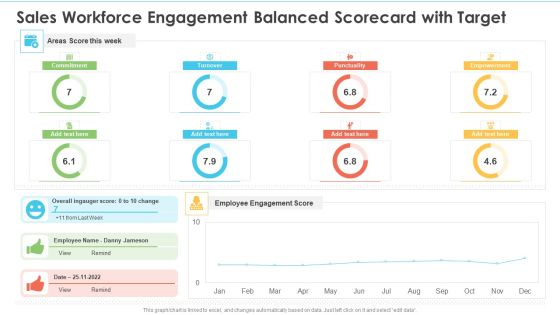
Sales Workforce Engagement Balanced Scorecard With Target Ppt Professional Designs Download PDF
This graph or chart is linked to excel, and changes automatically based on data. Just left click on it and select edit data. Deliver an awe inspiring pitch with this creative Sales Workforce Engagement Balanced Scorecard With Target Ppt Professional Designs Download PDF bundle. Topics like Areas Score Week, Employee Engagement Score, Overall Ingauger Score can be discussed with this completely editable template. It is available for immediate download depending on the needs and requirements of the user.

Playbook For Sales Growth Strategies Digital Marketing Dashboard For Organic Growth Designs PDF
This graph or chart is linked to excel, and changes automatically based on data. Just left click on it and select Edit Data. Deliver and pitch your topic in the best possible manner with this Playbook For Sales Growth Strategies Digital Marketing Dashboard For Organic Growth Designs PDF. Use them to share invaluable insights on Unique Visitors, Sessions, Bounce Rate and impress your audience. This template can be altered and modified as per your expectations. So, grab it now.

Sales Forecasting For Online Branding Agency Investor Funding Elevator Pitch Deck Rules PDF
Purpose of the following slide is to show the total amount of funds required by the organization , the provided pie chart displays the utilization of these funds. Deliver and pitch your topic in the best possible manner with this sales forecasting for online branding agency investor funding elevator pitch deck rules pdf. Use them to share invaluable insights on growth, organization and impress your audience. This template can be altered and modified as per your expectations. So, grab it now.

Global Healthcare Device Sale Trends Microsoft PDF
This slide shows international market sale trends that can be used to frame future marketing strategies to boost overall revenue of organization. It include projected sales over next five years, current growth data and top global players etc.Showcasing this set of slides titled Global Healthcare Device Sale Trends Microsoft PDF. The topics addressed in these templates are Market Growth, Incremental Growth, Growth Current. All the content presented in this PPT design is completely editable. Download it and make adjustments in color, background, font etc. as per your unique business setting.

Weekly Sales Performance Highlights With Product Share Ppt File Information PDF
This graph or chart is linked to excel, and changes automatically based on data. Just left click on it and select Edit Data. Pitch your topic with ease and precision using this Weekly Sales Performance Highlights With Product Share Ppt File Information PDF. This layout presents information on Dashboard Summary, Weekly Sale, Product Share. It is also available for immediate download and adjustment. So, changes can be made in the color, design, graphics or any other component to create a unique layout.

Stock Market Business PowerPoint Backgrounds And Templates 1210
Microsoft PowerPoint Template and Background with Financial market charts on display forex candlesticks
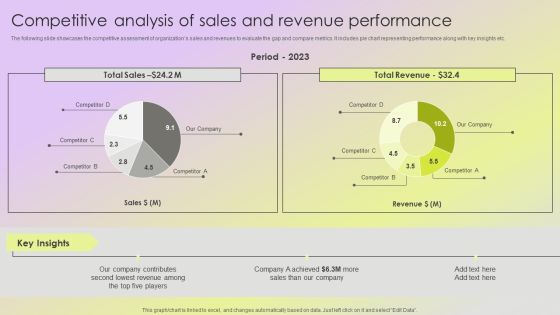
Mitigating Sales Risks With Strategic Action Planning Competitive Analysis Of Sales And Revenue Performance Slides PDF
The following slide showcases the competitive assessment of organizations sales and revenues to evaluate the gap and compare metrics. It includes pie chart representing performance along with key insights etc. Find a pre designed and impeccable Mitigating Sales Risks With Strategic Action Planning Competitive Analysis Of Sales And Revenue Performance Slides PDF. The templates can ace your presentation without additional effort. You can download these easy to edit presentation templates to make your presentation stand out from others. So, what are you waiting for Download the template from Slidegeeks today and give a unique touch to your presentation.
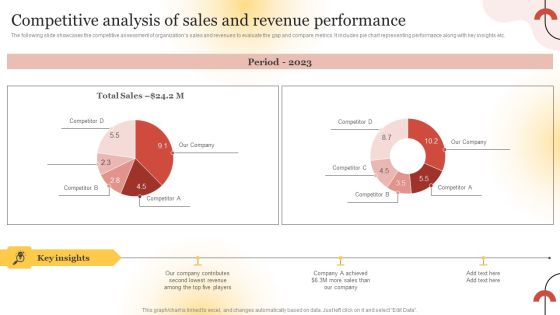
Executing Sales Risk Reduction Plan Competitive Analysis Of Sales And Revenue Performance Diagrams PDF
The following slide showcases the competitive assessment of organizations sales and revenues to evaluate the gap and compare metrics. It includes pie chart representing performance along with key insights etc. Take your projects to the next level with our ultimate collection of Executing Sales Risk Reduction Plan Competitive Analysis Of Sales And Revenue Performance Diagrams PDF. Slidegeeks has designed a range of layouts that are perfect for representing task or activity duration, keeping track of all your deadlines at a glance. Tailor these designs to your exact needs and give them a truly corporate look with your own brand colors they will make your projects stand out from the rest.

Automobile Sales Scorecard Percentage Scorecard For Auto Sales Based On Fuel Usage Graphics PDF
This graph or chart is linked to excel, and changes automatically based on data. Just left click on it and select Edit Data. Deliver and pitch your topic in the best possible manner with this Automobile Sales Scorecard Percentage Scorecard For Auto Sales Based On Fuel Usage Graphics PDF. Use them to share invaluable insights on Petrol Engine Vehicles, Diesel Engine Vehicles, Electric Vehicles Sales and impress your audience. This template can be altered and modified as per your expectations. So, grab it now.
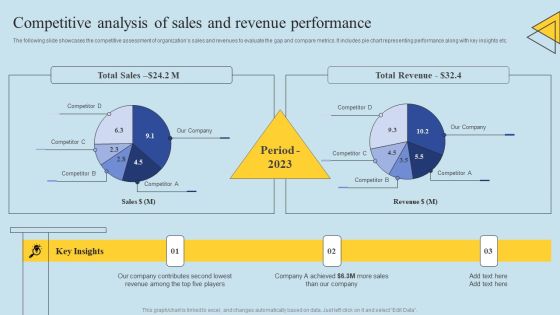
Determining Risks In Sales Administration Procedure Competitive Analysis Of Sales And Revenue Introduction PDF
The following slide showcases the competitive assessment of organizations sales and revenues to evaluate the gap and compare metrics. It includes pie chart representing performance along with key insights etc. Make sure to capture your audiences attention in your business displays with our gratis customizable Determining Risks In Sales Administration Procedure Competitive Analysis Of Sales And Revenue Introduction PDF. These are great for business strategies, office conferences, capital raising or task suggestions. If you desire to acquire more customers for your tech business and ensure they stay satisfied, create your own sales presentation with these plain slides.
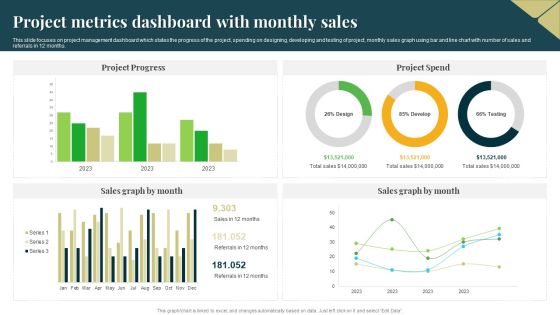
Project Metrics Dashboard With Monthly Sales Professional PDF
This slide focuses on project management dashboard which states the progress of the project, spending on designing, developing and testing of project, monthly sales graph using bar and line chart with number of sales and referrals in 12 months. Pitch your topic with ease and precision using this Project Metrics Dashboard With Monthly Sales Professional PDF. This layout presents information on Project Progress, Project Spend, Sales Graph. It is also available for immediate download and adjustment. So, changes can be made in the color, design, graphics or any other component to create a unique layout.

Competitive Analysis Of Sales And Revenue Performance Information PDF
The following slide showcases the competitive assessment of organizations sales and revenues to evaluate the gap and compare metrics. It includes pie chart representing performance along with key insights etc. Slidegeeks is one of the best resources for PowerPoint templates. You can download easily and regulate Competitive Analysis Of Sales And Revenue Performance Information PDF for your personal presentations from our wonderful collection. A few clicks is all it takes to discover and get the most relevant and appropriate templates. Use our Templates to add a unique zing and appeal to your presentation and meetings. All the slides are easy to edit and you can use them even for advertisement purposes.
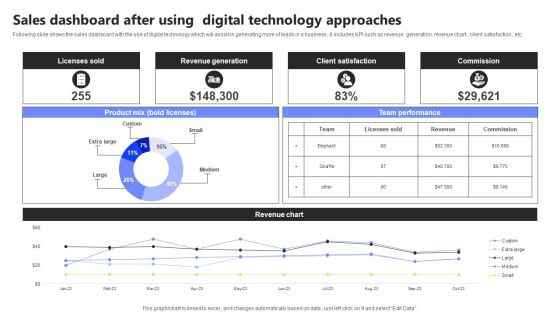
Sales Dashboard After Using Digital Technology Approaches Infographics PDF
Following slide shows the sales dashboard with the use of digital technology which will assist in generating more of leads in a business . It includes KPI such as revenue generation, revenue chart , client satisfaction , etc. Showcasing this set of slides titled Sales Dashboard After Using Digital Technology Approaches Infographics PDF. The topics addressed in these templates are Licenses Sold, Revenue Generation, Client Satisfaction. All the content presented in this PPT design is completely editable. Download it and make adjustments in color, background, font etc. as per your unique business setting.

Improving Corporate Performance Sales Opportunity Monitoring Dashboard Portrait PDF
This graph or chart is linked to excel, and changes automatically based on data. Just left click on it and select Edit Data. Welcome to our selection of the Improving Corporate Performance Sales Opportunity Monitoring Dashboard Portrait PDF. These are designed to help you showcase your creativity and bring your sphere to life. Planning and Innovation are essential for any business that is just starting out. This collection contains the designs that you need for your everyday presentations. All of our PowerPoints are 100 percent editable, so you can customize them to suit your needs. This multi-purpose template can be used in various situations. Grab these presentation templates today.
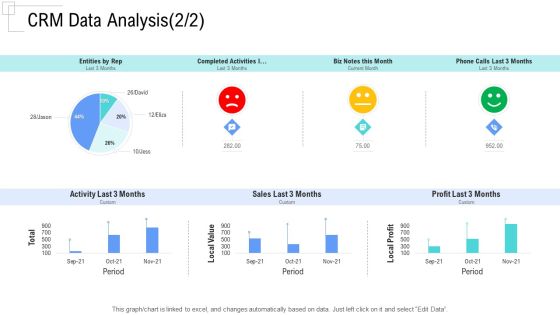
Managing Customer Experience CRM Data Analysis Sales Pictures PDF
This graph or chart is linked to excel, and changes automatically based on data. Just left click on it and select Edit Data.Deliver and pitch your topic in the best possible manner with this managing customer experience crm data analysis sales pictures pdf. Use them to share invaluable insights on entities by rep, completed activities l, biz notes this month, phone calls last 3 months, activity last 3 months and impress your audience. This template can be altered and modified as per your expectations. So, grab it now.

Summary Financial Sales And Profit Margin Analysis Dashboard Pictures PDF
This graph or chart is linked to excel, and changes automatically based on data. Just left click on it and select Edit Data. Deliver an awe inspiring pitch with this creative Summary Financial Sales And Profit Margin Analysis Dashboard Pictures PDF bundle. Topics like Net Profit, Past Year Vs Target Vs Actual, Net Profit Margin By Region, Channel, Expenses Breakdown, Costs And Expenses, Profitability Indicator Ratios can be discussed with this completely editable template. It is available for immediate download depending on the needs and requirements of the user.
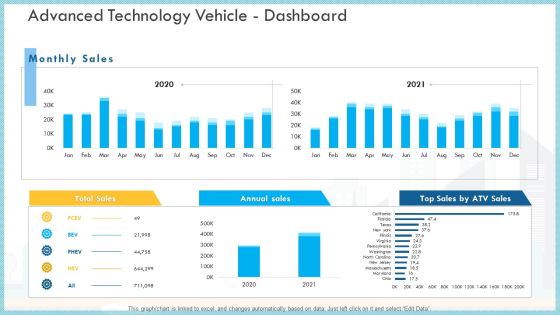
Loss Of Income And Financials Decline In An Automobile Organization Case Study Advanced Technology Vehicle Dashboard Infographics PDF
This graph or chart is linked to excel, and changes automatically based on data. Just left click on it and select Edit Data.Deliver an awe inspiring pitch with this creative loss of income and financials decline in an automobile organization case study advanced technology vehicle dashboard infographics pdf bundle. Topics like total sales, annual sales, monthly sales can be discussed with this completely editable template. It is available for immediate download depending on the needs and requirements of the user.

Evaluation Of Risk Factor Influencing Sales Performance Inspiration PDF
This slide depicts the major factors that influences the sales performance of a company. It includes pie chart with weightage showing initial risks like shortage of raw material, increase in price. Pitch your topic with ease and precision using this Evaluation Of Risk Factor Influencing Sales Performance Inspiration PDF. This layout presents information on Production Cost, Customer Shift, Risk Influencing. It is also available for immediate download and adjustment. So, changes can be made in the color, design, graphics or any other component to create a unique layout.

Competitive Analysis Of Sales And Revenue Performance Elements PDF
The following slide showcases the competitive assessment of organizations sales and revenues to evaluate the gap and compare metrics. It includes pie chart representing performance along with key insights etc. Take your projects to the next level with our ultimate collection of Competitive Analysis Of Sales And Revenue Performance Elements PDF. Slidegeeks has designed a range of layouts that are perfect for representing task or activity duration, keeping track of all your deadlines at a glance. Tailor these designs to your exact needs and give them a truly corporate look with your own brand colors they will make your projects stand out from the rest.

Competitive Analysis Of Sales And Revenue Performance Designs PDF
The following slide showcases the competitive assessment of organizations sales and revenues to evaluate the gap and compare metrics. It includes pie chart representing performance along with key insights etc. Take your projects to the next level with our ultimate collection of Competitive Analysis Of Sales And Revenue Performance Designs PDF. Slidegeeks has designed a range of layouts that are perfect for representing task or activity duration, keeping track of all your deadlines at a glance. Tailor these designs to your exact needs and give them a truly corporate look with your own brand colors they will make your projects stand out from the rest.
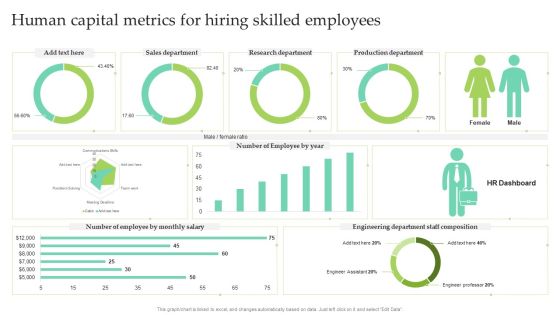
Human Capital Metrics For Hiring Skilled Employees Ppt Slides Themes PDF
This graph or chart is linked to excel, and changes automatically based on data. Just left click on it and select Edit Data. Showcasing this set of slides titled Human Capital Metrics For Hiring Skilled Employees Ppt Slides Themes PDF. The topics addressed in these templates are Sales Department, Research Department, Production Department. All the content presented in this PPT design is completely editable. Download it and make adjustments in color, background, font etc. as per your unique business setting.

Alternative Distribution Advertising Platform Multi Channel Marketing Annual Budget Plan Sales Background PDF
This pie chart evaluates the projected budget of the various marketing channels which a company must invest in such as local marketing, national marketing, public relations, etc. Deliver and pitch your topic in the best possible manner with this alternative distribution advertising platform multi channel marketing annual budget plan sales background pdf. Use them to share invaluable insights on sales, campaign, marketing, social media, public and impress your audience. This template can be altered and modified as per your expectations. So, grab it now.

Amalgamation Marketing Pitch Deck Multi Channel Marketing Annual Budget Plan Sales Rules PDF
This pie chart evaluates the projected budget of the various marketing channels which a company must invest in such as local marketing, national marketing, public relations, etc. Deliver and pitch your topic in the best possible manner with this amalgamation marketing pitch deck multi channel marketing annual budget plan sales rules pdf. Use them to share invaluable insights on sales, campaign, marketing, social media, public and impress your audience. This template can be altered and modified as per your expectations. So, grab it now.
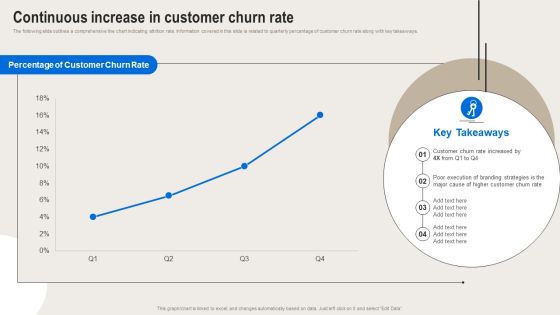
Formulating Branding Strategy To Enhance Revenue And Sales Continuous Increase In Customer Churn Rate Themes PDF
The following slide outlines a comprehensive line chart indicating attrition rate. Information covered in this slide is related to quarterly percentage of customer churn rate along with key takeaways. Boost your pitch with our creative Formulating Branding Strategy To Enhance Revenue And Sales Continuous Increase In Customer Churn Rate Themes PDF. Deliver an awe-inspiring pitch that will mesmerize everyone. Using these presentation templates you will surely catch everyones attention. You can browse the ppts collection on our website. We have researchers who are experts at creating the right content for the templates. So you do not have to invest time in any additional work. Just grab the template now and use them.

Firm Marketing Dashboard Report With Closed Sales Ppt Slides Graphics Example PDF
This graph or chart is linked to excel, and changes automatically based on data. Just left click on it and select Edit Data. Showcasing this set of slides titled Firm Marketing Dashboard Report With Closed Sales Ppt Slides Graphics Example PDF. The topics addressed in these templates are Days On Market, Homes For Sale, Median Sales Price, Closed Sales. All the content presented in this PPT design is completely editable. Download it and make adjustments in color, background, font etc. as per your unique business setting.

Need Of Introducing B2b Sales Strategies In Our Company Measure Ppt Infographics Skills PDF
This pie chart depicts the factors resulting from poor sales and marketing alignment which leads to introduce B2B sales strategies within the organizations. Deliver and pitch your topic in the best possible manner with this need of introducing b2b sales strategies in our company measure ppt infographics skills pdf. Use them to share invaluable insights on need of introducing b2b sales strategies in our company and impress your audience. This template can be altered and modified as per your expectations. So, grab it now.
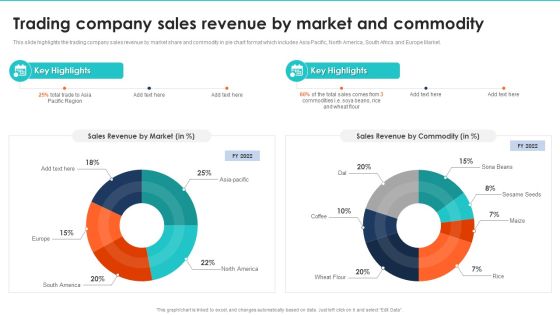
Export Management Company Profile Trading Company Sales Revenue By Market And Commodity Background PDF
This slide highlights the trading company sales revenue by market share and commodity in pie chart format which includes Asia Pacific, North America, South Africa and Europe Market. Deliver and pitch your topic in the best possible manner with this Export Management Company Profile Trading Company Sales Revenue By Market And Commodity Background PDF. Use them to share invaluable insights on Sales Revenue By Market, Sales Revenue By Commodity and impress your audience. This template can be altered and modified as per your expectations. So, grab it now.
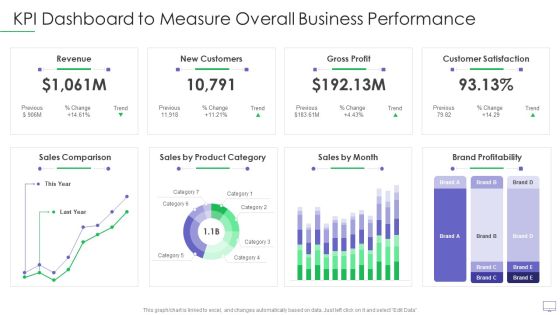
Guide For Software Developers KPI Dashboard To Measure Overall Business Performance Elements PDF
This graph or chart is linked to excel, and changes automatically based on data. Just left click on it and select Edit Data. Deliver an awe inspiring pitch with this creative guide for software developers kpi dashboard to measure overall business performance elements pdf bundle. Topics like revenue new customers, gross profit, customer satisfaction, sales comparison, brand profitability can be discussed with this completely editable template. It is available for immediate download depending on the needs and requirements of the user.
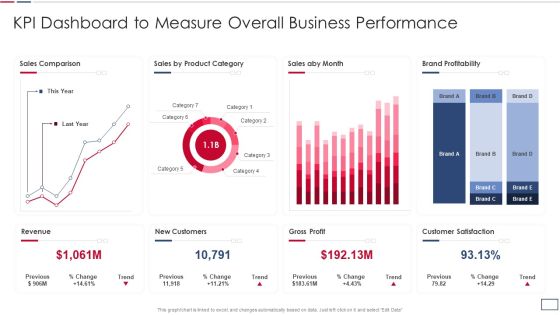
Software Developer Playbook Kpi Dashboard To Measure Overall Business Performance Topics PDF
This graph or chart is linked to excel, and changes automatically based on data. Just left click on it and select Edit Data. Deliver and pitch your topic in the best possible manner with this software developer playbook kpi dashboard to measure overall business performance topics pdf. Use them to share invaluable insights on revenue new customers, gross profit, customer satisfaction, sales comparison and impress your audience. This template can be altered and modified as per your expectations. So, grab it now.
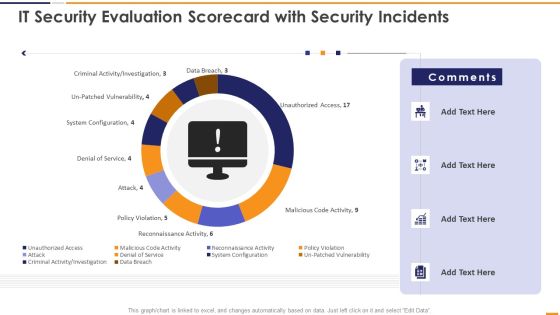
IT Security Evaluation Scorecard With Security Incidents Ppt Pictures Vector PDF
This graph or chart is linked to excel, and changes automatically based on data. Just left click on it and select Edit Data. Deliver and pitch your topic in the best possible manner with this IT Security Evaluation Scorecard With Security Incidents Ppt Pictures Vector PDF. Use them to share invaluable insights on Unauthorized Access Sales, Malicious Code Activity, Reconnaissance Activity Attack and impress your audience. This template can be altered and modified as per your expectations. So, grab it now.

Client Helpline Dashboard With Average Talk Time Distribution Ppt Gallery Backgrounds PDF
This graph or chart is linked to excel, and changes automatically based on data. Just left click on it and select Edit Data. Showcasing this set of slides titled Client Helpline Dashboard With Average Talk Time Distribution Ppt Gallery Backgrounds PDF. The topics addressed in these templates are External Incoming Call, Occupancy, Break Time, Sales. All the content presented in this PPT design is completely editable. Download it and make adjustments in color, background, font etc. as per your unique business setting.
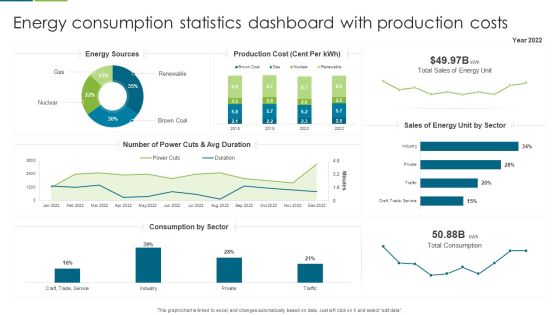
Energy Consumption Statistics Dashboard With Production Costs Slides PDF
This graph or chart is linked to excel, and changes automatically based on data. Just left click on it and select edit data. Showcasing this set of slides titled Energy Consumption Statistics Dashboard With Production Costs Slides PDF. The topics addressed in these templates are Production Cost, Sales Energy, Number Power. All the content presented in this PPT design is completely editable. Download it and make adjustments in color, background, font etc. as per your unique business setting.
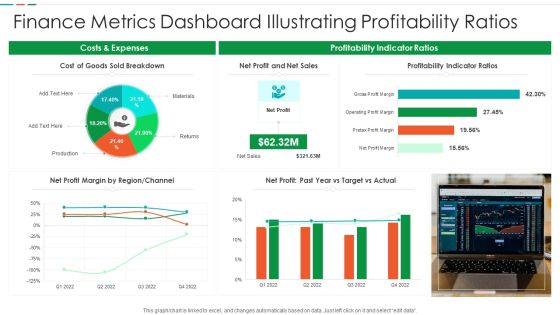
Finance Metrics Dashboard Illustrating Profitability Ratios Diagrams PDF
This graph or chart is linked to excel, and changes automatically based on data. Just left click on it and select edit data. Pitch your topic with ease and precision using this Finance Metrics Dashboard Illustrating Profitability Ratios Diagrams PDF. This layout presents information on Cost Goods Sold, Net Profit Net, Sales Profitability Indicator. It is also available for immediate download and adjustment. So, changes can be made in the color, design, graphics or any other component to create a unique layout.
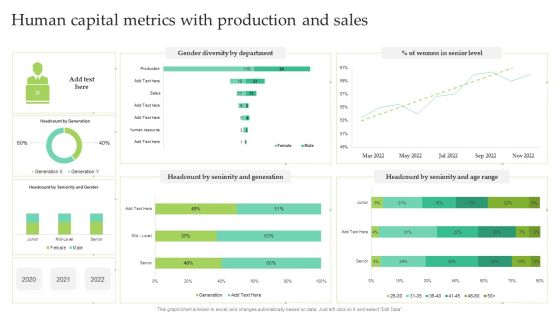
Human Capital Metrics With Production And Sales Ppt Infographic Template Summary PDF
This graph or chart is linked to excel, and changes automatically based on data. Just left click on it and select Edit Data. Showcasing this set of slides titled Human Capital Metrics With Production And Sales Ppt Infographic Template Summary PDF. The topics addressed in these templates are Women Senior Level, Gender Diversity Department, Seniority And Generation. All the content presented in this PPT design is completely editable. Download it and make adjustments in color, background, font etc. as per your unique business setting.
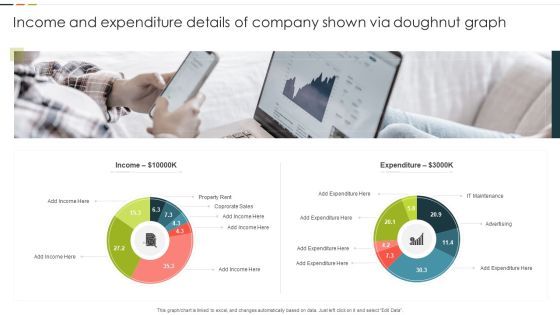
Income And Expenditure Details Of Company Shown Via Doughnut Graph Graphics PDF
This graph or chart is linked to excel, and changes automatically based on data. Just left click on it and select Edit Data. Pitch your topic with ease and precision using this Income And Expenditure Details Of Company Shown Via Doughnut Graph Graphics PDF. This layout presents information on Property Rent, Corporate Sales, Expenditure. It is also available for immediate download and adjustment. So, changes can be made in the color, design, graphics or any other component to create a unique layout.
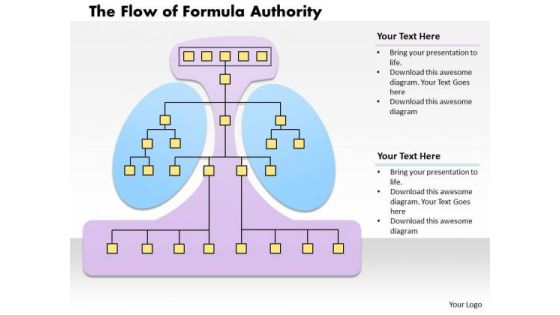
Business Framework Formula Authority PowerPoint Presentation
This image slide has been designed to display the follow of formula authority diagram. This image has been designed with graphic of text boxes in flow chart with innovative background. Use this image slide, in your presentation to depict management levels in business. This image slide will help you express your views to target audience.
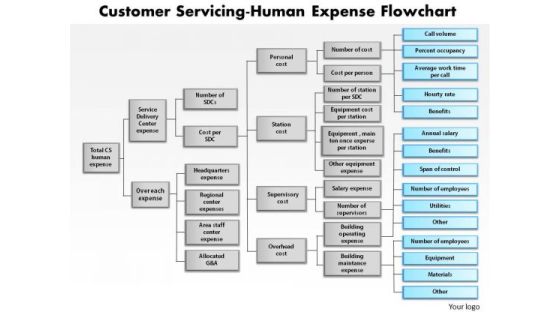
Business Framework Customer Servicing Human Expense Flowchart PowerPoint Presentation
This image slide has been designed with flow chart to depict customer servicing-human expense. This image slide may be used in your presentations to display business marketing. You may change color size and orientation of any icon to your liking. This image slide will impart professional appearance to your presentations.
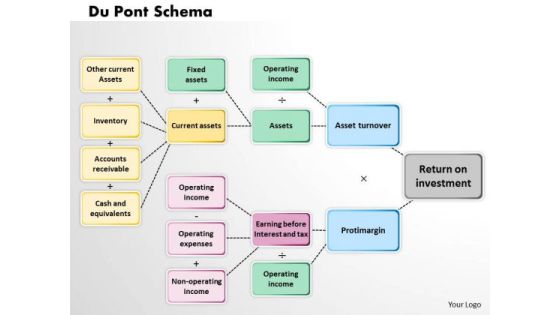
Business Framework Du Pont Schema PowerPoint Presentation
This beautiful image slide has been designed to display DuPont schema flow chart process in your presentations. This image slide may be used in business and marketing presentations. You may change color, size and orientation of any icon to your liking. Create professional presentations using this image slide.
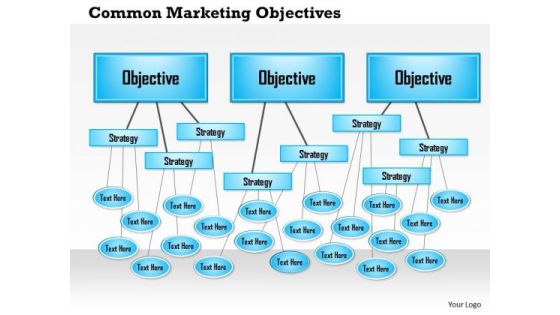
Business Framework Common Marketing Objectives PowerPoint Presentation
This image slide displays common marketing objectives business framework. This image slide has been beautifully designed with graphic of flow chart with objectives Use this image slide, in your presentations to express views on marketing strategic planning objectives. This image slide will help you create professional presentations.
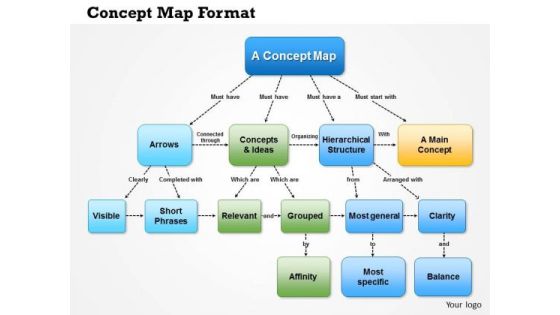
Business Framework Concept Map Format PowerPoint Presentation
This business framework displays concept map. This image slide has been crafted to depict concept mapping in flow chart with boxes. Use this image slide, in your presentations to express views on marketing, technology and business. This image slide will help you make outstanding presentations.

Business Framework Concept Map PowerPoint Presentation
This business framework displays concept map. This image slide has been crafted to depict concept mapping in flow chart with cloud boxes. Use this image slide, in your presentations to express views on marketing, technology and business. This image slide will help you make outstanding presentations.

Business Framework Concept Mapping Template PowerPoint Presentation
This business framework displays concept map. This image slide has been crafted to depict concept mapping in flow chart with editable boxes. Use this image slide, in your presentations to express views on marketing, technology and business. This image slide will help you make outstanding presentations.
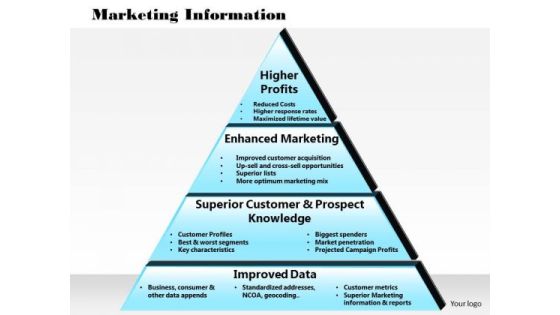
Business Framework Marketing Information PowerPoint Presentation 1
Graphic of two level flow chart has been used in this business framework power point template. This PPT contains the concept of marketing information with step by step process. This PPT is suitable for marketing related presentations. Give detailed information about the topic in graphical manner with our professional PPT.

Business Framework Marketing Mix Example PowerPoint Presentation
Four staged process flow chart with target selection techniques has been used to design this business framework PPT. This PPT contains the concept of marketing target selection and achievement process. Add this PPT in your presentation and good comments from viewers.
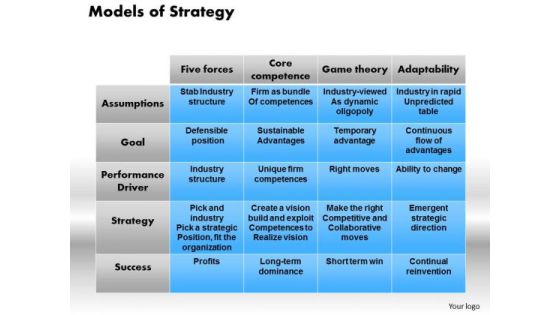
Business Framework Models Of Strategy PowerPoint Presentation
This power point template has been crafted with model of strategy. This PPT contains two variable text box organization chart which can be used for various business strategies. Add this PPT in your business presentations and create an impact on viewers.

Business Framework Motivation Theories PowerPoint Presentation
Define the importance of motivation in organization and business with this exclusive Motivational Theories PPT. This template contains the two way flow chart to explain process of motivation. Add this template in you presentation and get excellent way to motivate your viewers.

Abc Company Sales Trends Analysis Statistical Report Slides PDF
This slide represents the statistical report showing the sales trends analysis for ABC company. It includes details related to sales , gross profit and new customers for the current year, sales monthly trends, top 5 sales by region etc. Deliver an awe inspiring pitch with this creative Abc Company Sales Trends Analysis Statistical Report Slides PDF bundle. Topics like Abc Company Sales, Trends Analysis Statistical Report can be discussed with this completely editable template. It is available for immediate download depending on the needs and requirements of the user.

Global Ecommerce Sales Trend Analysis Statistical Report Mockup PDF
This slide shows the statistical graph representing the emerging trends in the sales growth of Ecommerce sites. It shows increase in sales of ecommerce sites in seven years. Deliver and pitch your topic in the best possible manner with this Global Ecommerce Sales Trend Analysis Statistical Report Mockup PDF. Use them to share invaluable insights on Sales Growth, Ecommerce Sites and impress your audience. This template can be altered and modified as per your expectations. So, grab it now.
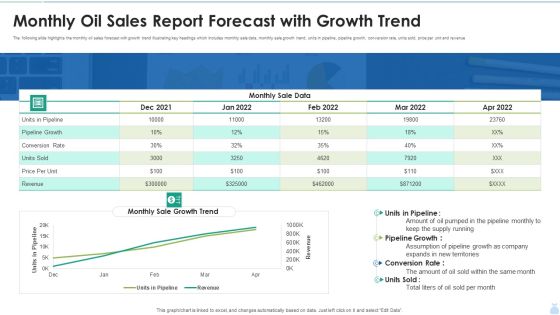
Monthly Oil Sales Report Forecast With Growth Trend Graphics PDF
The following slide highlights the monthly oil sales forecast with growth trend illustrating key headings which includes monthly sale data, monthly sale growth trend, units in pipeline, pipeline growth, conversion rate, units sold, price per unit and revenue. Showcasing this set of slides titled Monthly Oil Sales Report Forecast With Growth Trend Graphics PDF. The topics addressed in these templates are Pipeline Growth, Monthly Sale Data, Conversion Rate. All the content presented in this PPT design is completely editable. Download it and make adjustments in color, background, font etc. as per your unique business setting.

Business Monthly Sales Opportunity Report Summary With Trend Professional PDF
The Following Slide Highlights the monthly sales Opportunity report with trend . It depicts sales opportunity by sales person , total won opportunity , win ratio , average opportunity and win opportunity trend.Showcasing this set of slides titled Business Monthly Sales Opportunity Report Summary With Trend Professional PDF The topics addressed in these templates are Average Opportunity, Won Opportunity, Sales Opportunity All the content presented in this PPT design is completely editable. Download it and make adjustments in color, background, font etc. as per your unique business setting.

 Home
Home