Waterfall Chart
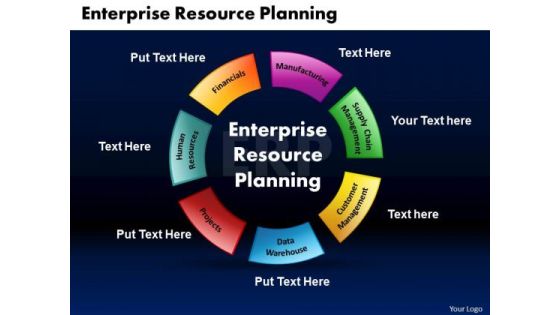
Business Circle Charts PowerPoint Templates Marketing Enterprise Resource Planning Ppt Slides
Business Circle Charts PowerPoint Templates Marketing Enterprise Resource Planning PPT Slides-This Event Resource Planning diagram can help you in displaying an organized view of marketing services and processes.-Business Circle Charts PowerPoint Templates Marketing Enterprise Resource Planning PPT Slides-This template can be used for presentations relating to 3d, Arrow, Blueprint, Business, Circle, Cleverness, Commerce, Company, Competence, Concept, Constructive, Corporate, Create, Creative, Creativity, Decision, Design, Develop, Device, Discover, Earn, Enterprise, Finance, Goal, Idea, Imaginative, Ingenious, Innovative, Inspiration, Inspire, Inventive, Job, Management, Market
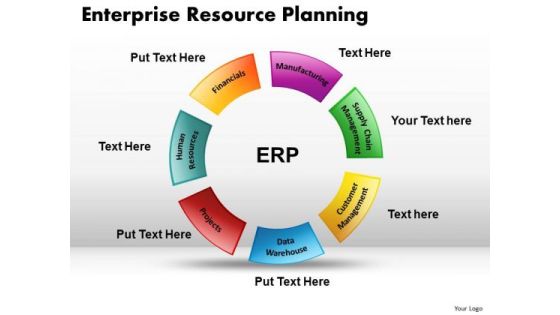
Business Circle Charts PowerPoint Templates Leadership Enterprise Resource Planning Ppt Slides
Business Circle Charts PowerPoint Templates Leadership Enterprise Resource Planning PPT Slides-A wonderful graphics to make a PowerPoint presentation on Enterprise Resource Planning-Business Circle Charts PowerPoint Templates Leadership Enterprise Resource Planning PPT Slides-This template can be used for presentations relating to 3d, Arrow, Blueprint, Business, Circle, Cleverness, Commerce, Company, Competence, Concept, Constructive, Corporate, Create, Creative, Creativity, Decision, Design, Develop, Device, Discover, Earn, Enterprise, Finance, Goal, Idea, Imaginative, Ingenious, Innovative, Inspiration, Inspire, Inventive, Job, Management, Market
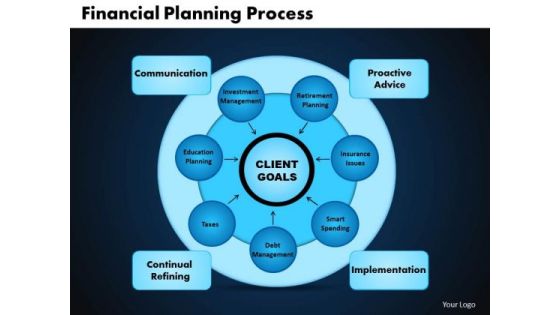
Business Circle Charts PowerPoint Templates Leadership Financial Planning Process Ppt Slides
Business Circle Charts PowerPoint Templates Leadership Financial Planning Process PPT Slides-This PowerPoint diagram shows transformations from one stage to others stage of Financial Planning Process-Business Circle Charts PowerPoint Templates Leadership Financial Planning Process PPT Slides-This template can be used for presentations relating to Abstract, Action, Business, Chart, Commerce, Competitor, Components, Concept, Conceptual, Design, Diagram, Executive, Financial, Goals, Guide, Guidelines, Hierarchy, Icon, Idea, Illustration, Manage, Management, Marketing, Mind, Mission, Model, Operations, Organization, Performance, Plan, Planning, Process

Data Flow Charts For Sale Order Processing System Ppt PowerPoint Presentation File Introduction PDF
Persuade your audience using this Data Flow Charts For Sale Order Processing System Ppt PowerPoint Presentation File Introduction PDF. This PPT design covers three stages, thus making it a great tool to use. It also caters to a variety of topics including Consumer, Faulty Orders, Billing Details. Download this PPT design now to present a convincing pitch that not only emphasizes the topic but also showcases your presentation skills.
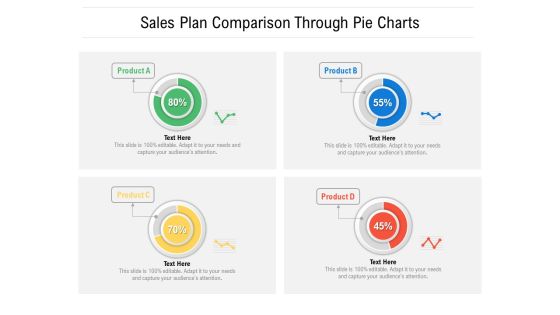
Sales Plan Comparison Through Pie Charts Ppt PowerPoint Presentation File Format Ideas PDF
Showcasing this set of slides titled sales plan comparison through pie charts ppt powerpoint presentation file format ideas pdf. The topics addressed in these templates are sales plan comparison through pie charts. All the content presented in this PPT design is completely editable. Download it and make adjustments in color, background, font etc. as per your unique business setting.

Ppt Group Of People Pie Charts Person Standing Pink Piece PowerPoint Templates
PPT group of people pie charts person standing pink piece PowerPoint Templates-Use this 3D Amazing PowerPoint Diagram to illustrate the steps to be followed in Circular Process. It is represented by Pink stage. This Diagram shows every single stage which can be explained in single slide to make your Presentation Attractive.-PPT group of people pie charts person standing pink piece PowerPoint Templates-arrow, bar, business, businessman, candidate, cartoon, character, chart, circle, circular, client, communication, company, concept, diagram, finance, growth, human, illustration, increase, information, marketing, person, presentation, process, profit, sales, stats, success, target
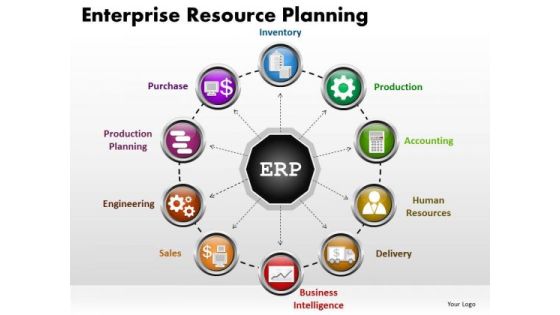
Business Circle Charts PowerPoint Templates Strategy Enterprise Resource Planning Ppt Slides
Business Circle Charts PowerPoint Templates Strategy Enterprise Resource Planning PPT Slides-This circle chart shows various interrelated circles can be used for factors involved in stragey enterprise resource planning-Business Circle Charts PowerPoint Templates Strategy Enterprise Resource Planning PPT Slides-This template can be used for presentations relating to 3d, Arrow, Blueprint, Business, Circle, Cleverness, Commerce, Company, Competence, Concept, Constructive, Corporate, Create, Creative, Creativity, Decision, Design, Develop, Device, Discover, Earn, Enterprise, Finance, Goal, Idea, Imaginative, Ingenious, Innovative, Inspiration, Inspire, Inventive, Job, Management, Market

Business Charts PowerPoint Templates Step By Marketing Plan Sales And Slides
Business Charts PowerPoint templates step by marketing plan Sales and Slides-This diagram consists of four Interconnected elements which can be useful to present an organized view of business services and processes. This diagram is an amazing tool to ensure that strategic planning sessions contribute to teambuilding.-Business Charts PowerPoint templates step by marketing plan Sales and Slides

Past Trends In Market Share Of ABC Carbonated Drink Company Ppt Diagram Graph Charts PDF
This slide shows the past trends in market share of ABC Carbonated Beverage Company worldwide. The market share has decreased due to decline in sales as people have become more health conscious and avoid beverages that have high sugar content and caffeine. Deliver an awe inspiring pitch with this creative past trends in market share of abc carbonated drink company ppt diagram graph charts pdf bundle. Topics like past trends in market share of abc carbonated drink company can be discussed with this completely editable template. It is available for immediate download depending on the needs and requirements of the user.

Business Charts PowerPoint Templates Simple 4 Stage Circular Process Editable Sales
Business Charts PowerPoint templates simple 4 stage circular process editable Sales-This PowerPoint Diagram consists of four animated Process tables of Different Colors. It can be used to symbolize four different Approaches or four distinct techniques. It consists of single color slide as well. This diagram will fit for Business Presentations.

Business Charts PowerPoint Templates Steps To Reach The Top Editable Sales
Business Charts PowerPoint templates steps to reach the top editable Sales-This PowerPoint Diagram shows the doorsteps to reach the door that is Success. It portrays the concept of accomplishment, achievement, attainment, benefit, big hit, eminence, fame, flying colors, fortune, gain, good luck, good times, grand slam, lap of luxury, laughter, maturation, profit, progress, prosperity, realization, reward, triumph, and victory.
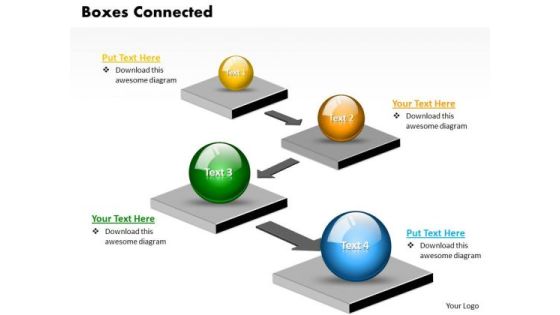
Business Charts PowerPoint Templates 3d Boxes Connected With Arrows Linear Circular Direction Sales
Business Charts PowerPoint templates 3d boxes connected with arrows linear circular direction Sales-Use this Graphical Interface to follow the Correct Path to reach the Destination. This 3D PowerPoint Diagram Shows Four Circular text boxes pointing one to the other defining which Path to follow. This Diagram will make your Presentation Attractive and Delightful to watch.

Business Circle Charts PowerPoint Templates Business Customer Business Product Ppt Slides
Business Circle Charts PowerPoint Templates Business customer business product PPT Slides-This PowerPoint diagram shows factors involved in a customer business product strategy -Business Circle Charts PowerPoint Templates Business customer business product PPT Slides-This template can be used for presentations relating to Aim, Arrow, Background, Business, Commerce, Conceptual, Customer, Finance, Financial, Gain, Growth, Illustration, Industry, Investment, Law, Legal, Manufacturing, Metaphor, Money, Objective, Product, Professional, Profit, Quality, Retail, Rights, Sale, Shop, Shopping, Success, Teamwork

Business Charts PowerPoint Templates 3d Process Puzzle Support Structure Fitting The Missing Piece
Business Charts PowerPoint templates 3d process puzzle support structure fitting the missing piece-This PowerPoint Diagram Shows 3d Circular process explaining puzzle support structure fitting the missing piece. It imitates the concept of Sales, Marketing, Business etc.-Business Charts PowerPoint templates 3d process puzzle support structure fitting the missing piece
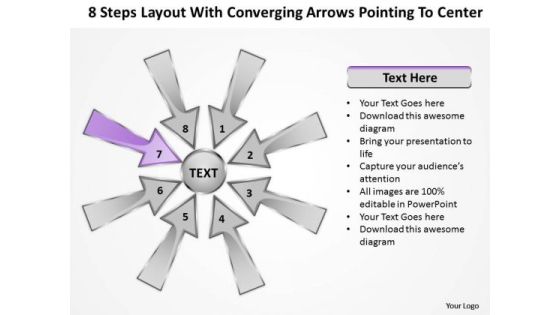
Steps Layout With Converging Arrows Pointing To Center Ppt Charts And Diagrams PowerPoint Slides
We present our steps layout with converging arrows pointing to center ppt Charts and Diagrams PowerPoint Slides.Present our Arrows PowerPoint Templates because this slide can help to bullet point your views. Download our Circle Charts PowerPoint Templates because you know your business and have a vision for it. Download and present our Shapes PowerPoint Templates because with the help of our Slides you can Illustrate these thoughts with this slide. Use our Business PowerPoint Templates because maximising sales of your product is the intended destination. Present our Flow Charts PowerPoint Templates because you require care and diligence to function well.Use these PowerPoint slides for presentations relating to 3d, abstract, all, around, arrow, aspect, attention, attract, blue, center, collect, colorful, conceptual, converge, course, cutout, direct, direction, factor, gather, globalization, go, green, guide, illustration, indicate, integration, isolated, location, many, movement, point, pointer, rainbow, reach, red, round, show, sides, sign, source, sphere, strategy, summon, symbol, target, unity, way, white, yellow. The prominent colors used in the PowerPoint template are Purple, Gray, Black. Presenters tell us our steps layout with converging arrows pointing to center ppt Charts and Diagrams PowerPoint Slides are Amazing. The feedback we get is that our attention PowerPoint templates and PPT Slides are second to none. Presenters tell us our steps layout with converging arrows pointing to center ppt Charts and Diagrams PowerPoint Slides are visually appealing. You can be sure our aspect PowerPoint templates and PPT Slides are Multicolored. People tell us our steps layout with converging arrows pointing to center ppt Charts and Diagrams PowerPoint Slides are Endearing. PowerPoint presentation experts tell us our around PowerPoint templates and PPT Slides are Majestic.
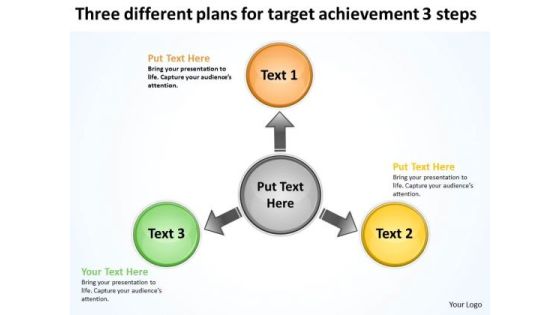
Three Different Plans For Target Achievement 3 Steps Charts And PowerPoint Slides
We present our three different plans for target achievement 3 steps Charts and PowerPoint Slides.Present our Circle Charts PowerPoint Templates because you have the people in place, selected the team leaders and all are raring to go. Present our Arrows PowerPoint Templates because with the help of our Slides you can Illustrate these thoughts with this slide. Download our Business PowerPoint Templates because this layout helps you to bring some important aspects of your business process to the notice of all concerned. Streamline the flow of information across the board. Present our Shapes PowerPoint Templates because Our PowerPoint Templates and Slides will effectively help you save your valuable time. They are readymade to fit into any presentation structure. Download and present our Flow Charts PowerPoint Templates because your ideas are fundamentally stable with a broad base of workable possibilities.Use these PowerPoint slides for presentations relating to 3d, achievement, aim, arrow, background, blue, business, career, chart, communication, competition, concept, curve, design, development, different, direction, education, financial, forecast, forward, glossy, graph, graphic, group, growth, icon, illustration, increase, investment, moving, outlook, path, plan, price, profit, progress, race, sales, start, success, target, team, three, turn, up, upwards, win, winner. The prominent colors used in the PowerPoint template are Orange, Yellow, Green. Customers tell us our three different plans for target achievement 3 steps Charts and PowerPoint Slides help you meet deadlines which are an element of today's workplace. Just browse and pick the slides that appeal to your intuitive senses. PowerPoint presentation experts tell us our blue PowerPoint templates and PPT Slides are Spectacular. People tell us our three different plans for target achievement 3 steps Charts and PowerPoint Slides are Tasteful. People tell us our background PowerPoint templates and PPT Slides are Handsome. Customers tell us our three different plans for target achievement 3 steps Charts and PowerPoint Slides are One-of-a-kind. People tell us our background PowerPoint templates and PPT Slides will help you be quick off the draw. Just enter your specific text and see your points hit home.

Venn Diagram Of Help Circle Charts PowerPoint Templates Ppt Backgrounds For Slides 1112
We present our Venn Diagram Of Help Circle Charts PowerPoint Templates PPT Backgrounds For Slides 1112.Download and present our Circle charts PowerPoint Templates because there are a bucketful of brilliant ideas swirling around within your group. Download our Venn diagrams PowerPoint Templates because you have an idea of which you are sure. Download our Business PowerPoint Templates because maximising sales of your product is the intended destination. Download and present our Education PowerPoint Templates because we all know Education is the foundation of growth in any endeavour. Use our Success PowerPoint Templates because iT outlines the entire thought process for the benefit of others. Tell it to the world with your characteristic aplomb.Use these PowerPoint slides for presentations relating to Venn diagram help others help yourself, circle charts, venn diagrams, business, education, success. The prominent colors used in the PowerPoint template are Green, Blue, Blue navy. People tell us our Venn Diagram Help Others Help Yourself Circle Charts PowerPoint Templates PPT Backgrounds For Slides 1112 are specially created by a professional team with vast experience. They diligently strive to come up with the right vehicle for your brilliant Ideas. Presenters tell us our charts PowerPoint templates and PPT Slides are Nostalgic. PowerPoint presentation experts tell us our Venn Diagram Help Others Help Yourself Circle Charts PowerPoint Templates PPT Backgrounds For Slides 1112 are Efficient. Customers tell us our charts PowerPoint templates and PPT Slides are Ritzy. Customers tell us our Venn Diagram Help Others Help Yourself Circle Charts PowerPoint Templates PPT Backgrounds For Slides 1112 are Awesome. Customers tell us our charts PowerPoint templates and PPT Slides are Stylish.
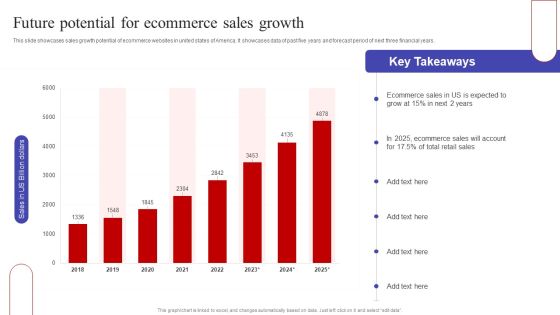
Future Potential For Ecommerce Sales Growth Ppt PowerPoint Presentation Diagram Graph Charts PDF
This slide showcases sales growth potential of ecommerce websites in united states of America. It showcases data of past five years and forecast period of next three financial years. Here you can discover an assortment of the finest PowerPoint and Google Slides templates. With these templates, you can create presentations for a variety of purposes while simultaneously providing your audience with an eye catching visual experience. Download Future Potential For Ecommerce Sales Growth Ppt PowerPoint Presentation Diagram Graph Charts PDF to deliver an impeccable presentation. These templates will make your job of preparing presentations much quicker, yet still, maintain a high level of quality. Slidegeeks has experienced researchers who prepare these templates and write high quality content for you. Later on, you can personalize the content by editing the Future Potential For Ecommerce Sales Growth Ppt PowerPoint Presentation Diagram Graph Charts PDF.
Business Charts PowerPoint Templates 3d Illustration Of Surprised Emoticon Picture Sales
Business Charts PowerPoint templates 3d illustration of surprised emoticon picture Sales-Use this Amazing 3D PowerPoint Diagram to express the Surprising Situation. This Diagram can be used in Business related Presentations. It consists of other colorful Emoticons which can be used for different purposes.

Problems Related To Current Product Positioning Ppt PowerPoint Presentation Diagram Graph Charts PDF
This slide highlights the problems related to current product positioning which showcases in graphical format depicting downgrading product sales and changing consumer trends. Do you have an important presentation coming up Are you looking for something that will make your presentation stand out from the rest Look no further than Problems Related To Current Product Positioning Ppt PowerPoint Presentation Diagram Graph Charts PDF. With our professional designs, you can trust that your presentation will pop and make delivering it a smooth process. And with Slidegeeks, you can trust that your presentation will be unique and memorable. So why wait Grab Problems Related To Current Product Positioning Ppt PowerPoint Presentation Diagram Graph Charts PDF today and make your presentation stand out from the rest

Business Charts PowerPoint Templates 3d Sales Puzzle Pieces Stock Illustration And Marketing Slides
Business Charts PowerPoint templates 3d Sales Puzzle pieces stock illustration and marketing Slides-This PowerPoint diagram shows two Missing Puzzles from 8x8 Matrix Diagram. There is a lot of space available for writing your text. You can easily edit the size, position, text, color. -Business Charts PowerPoint templates 3d Sales Puzzle pieces stock illustration and marketing Slides

Business Charts PowerPoint Templates Simple 2 Stage Circular Flow Editable Sales
Business Charts PowerPoint templates simple 2 stage circular flow editable Sales-This PowerPoint Diagram consists of two steps Process of Different Colors. It can be used to symbolize two Steps involved in a some Process of Business. It consists of single color slide as well. This diagram will fit for Business Presentations.

Comparison Of Social Media Platforms To Run Online Ads Ppt PowerPoint Presentation Diagram Graph Charts PDF
This slide showcases comparative assessment of social media channels which can help marketers to identify ideal platform for running ad campaigns. Its key components are platform, worldwide users, user demographics, B2B and B2C Slidegeeks is here to make your presentations a breeze with Comparison Of Social Media Platforms To Run Online Ads Ppt PowerPoint Presentation Diagram Graph Charts PDF With our easy to use and customizable templates, you can focus on delivering your ideas rather than worrying about formatting. With a variety of designs to choose from, you are sure to find one that suits your needs. And with animations and unique photos, illustrations, and fonts, you can make your presentation pop. So whether you are giving a sales pitch or presenting to the board, make sure to check out Slidegeeks first.
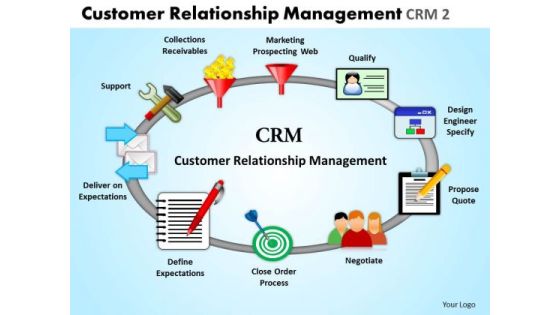
Business Circle Charts PowerPoint Templates Business Customer Relationship Management Ppt Slides
Business Circle Charts PowerPoint Templates Business customer relationship management PPT Slides-This CRM ppt template is amazingly designed to make wonderful CRM PowerPoint Presentations-Business Circle Charts PowerPoint Templates Business customer relationship management PPT Slides-This template can be used for presentations relating to Analysis, Brainstorming, Business, Chart, Concept, Creative, Creativity, Crm, Customer, Diagram, Executive, Flowchart,Hand, Idea, Inspire, Interface, Layout, Legal, Management, Manager, Meeting, Note, Office, Pen, Plan, Presentation, Program, Relationship, Student, Teach, Teamwork, Technical

Business Circle Charts PowerPoint Templates Sales Customer Relationship Management Ppt Slides
Business Circle Charts PowerPoint Templates Sales customer relationship management PPT Slides-Use this graphics to discuss the main functions and various models of CRM;. Explain the role of salespeople as relationship developers.-Business Circle Charts PowerPoint Templates Sales customer relationship management PPT Slides-This template can be used for presentations relating to Analysis, Brainstorming, Business, Chart, Concept, Creative, Creativity, Crm, Customer, Diagram, Executive, Flowchart,Hand, Idea, Inspire, Interface, Layout, Legal, Management, Manager, Meeting, Note, Office, Pen, Plan, Presentation, Program, Relationship, Student, Teach, Teamwork, Technical
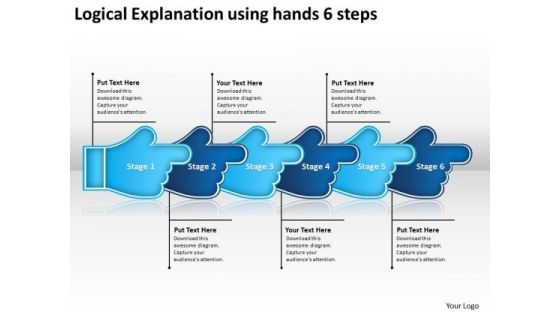
Logical Explanation Using Hands 6 Steps Sample Process Flow Charts PowerPoint Slides
We present our logical explanation using hands 6 steps sample process flow charts PowerPoint Slides. Use our Symbol PowerPoint Templates because, Leadership Template:- Show them the way, be Captain of the ship and lead them to new shores. Use our Business PowerPoint Templates because, Marketing Strategy Business Template:- maximizing sales of your product is the intended destination. Use our Metaphor PowerPoint Templates because, Amplify on your views and plans for getting ahead and then the manner in which you intend staying ahead. Use our Abstract PowerPoint Templates because; Refine them all as you take them through the numerous filtering stages of the funnel of your quality control process. Use our Process and Flows PowerPoint Templates because, one pushes the other till it all comes back full circle. Use these PowerPoint slides for presentations relating to Collinear, Description using hands steps, Business, Collection, Connection, Cursor, Decoration, Design, Dimensional, Direction, Element, Icon, Illustration, Information, Modern, Motion, Paper, Perspective, Plastic, Pointer, Pointing, Process, Recycle, Recycling, Reflective, Set, Shape, Shiny, Sign, Symbol, Technology. The prominent colors used in the PowerPoint template are Blue, Blue navy, Gray
Sales Performance Report With Charts And Graphs Ppt PowerPoint Presentation Icon Master Slide PDF
Presenting sales performance report with charts and graphs ppt powerpoint presentation icon master slide pdf to dispense important information. This template comprises three stages. It also presents valuable insights into the topics including sales performance report with charts and graphs. This is a completely customizable PowerPoint theme that can be put to use immediately. So, download it and address the topic impactfully.

Business Sales Analysis Charts And Graphs Ppt PowerPoint Presentation File Deck PDF
Presenting business sales analysis charts and graphs ppt powerpoint presentation file deck pdf to dispense important information. This template comprises three stages. It also presents valuable insights into the topics including business sales analysis charts and graphs. This is a completely customizable PowerPoint theme that can be put to use immediately. So, download it and address the topic impactfully.

Business Charts PowerPoint Templates Stages For Marketing Plan Sales And Slides
Business Charts PowerPoint templates stages for marketing plan Sales and Slides-This PowerPoint diagram is a simple diagram that provides a graphical overview of a continuing sequence of stages, tasks, actions, or events in a parallel way. This PowerPoint diagram can be used for business process automation and other business related issues.-Business Charts PowerPoint templates stages for marketing plan Sales and Slides

Business Circle Charts PowerPoint Templates Business Enterprise Resource Planning Ppt Slides
Business Circle Charts PowerPoint Templates Business Enterprise Resource Planning PPT Slides-A wonderful graphics to make a PowerPoint presentation on Enterprise Resource Planning-Business Circle Charts PowerPoint Templates Business Enterprise Resource Planning PPT Slides-This template can be used for presentations relating to 3d, Arrow, Blueprint, Business, Circle, Cleverness, Commerce, Company, Competence, Concept, Constructive, Corporate, Create, Creative, Creativity, Decision, Design, Develop, Device, Discover, Earn, Enterprise, Finance, Goal, Idea, Imaginative, Ingenious, Innovative, Inspiration, Inspire, Inventive, Job, Management, Market

Assessment Of Two Products Through Sales Charts Ppt PowerPoint Presentation Styles Graphics Design PDF
Showcasing this set of slides titled assessment of two products through sales charts ppt powerpoint presentation styles graphics design pdf. The topics addressed in these templates are assessment of two products, through sales charts. All the content presented in this PPT design is completely editable. Download it and make adjustments in color, background, font etc. as per your unique business setting.

Workplace Risk Management And Reduction Based On ALARP Principle Ppt PowerPoint Presentation Diagram Graph Charts PDF
Whether you have daily or monthly meetings, a brilliant presentation is necessary. Workplace Risk Management And Reduction Based On ALARP Principle Ppt PowerPoint Presentation Diagram Graph Charts PDF can be your best option for delivering a presentation. Represent everything in detail using Workplace Risk Management And Reduction Based On ALARP Principle Ppt PowerPoint Presentation Diagram Graph Charts PDF and make yourself stand out in meetings. The template is versatile and follows a structure that will cater to your requirements. All the templates prepared by Slidegeeks are easy to download and edit. Our research experts have taken care of the corporate themes as well. So, give it a try and see the results.

Steps For Sales Risk Management Process Ppt Diagram Graph Charts PDF
The following slide illustrates some steps to optimize sales risk administration process improving organizations overall financial performance. It includes activities such as identifying , assessing, prioritizing, treating and monitoring issues etc. The Steps For Sales Risk Management Process Ppt Diagram Graph Charts PDF is a compilation of the most recent design trends as a series of slides. It is suitable for any subject or industry presentation, containing attractive visuals and photo spots for businesses to clearly express their messages. This template contains a variety of slides for the user to input data, such as structures to contrast two elements, bullet points, and slides for written information. Slidegeeks is prepared to create an impression.
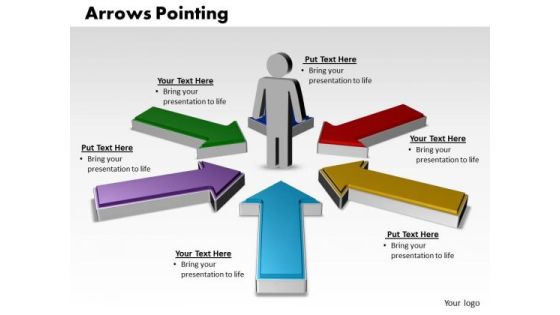
Business Charts PowerPoint Templates Arrows Pointing Inwards With Circular Direction Editable Sales
Business Charts PowerPoint templates arrows pointing inwards with circular direction editable Sales-This PowerPoint Diagram shows the five different colored Arrows pointing towards the man .It imitates the conceptualization of Success, Business, Marketing, Finance, Insurance etc.

Business Circle Charts PowerPoint Templates Success Goals And Targets Ppt Slides
Business Circle Charts PowerPoint Templates Success goals and targets PPT Slides- Use this diagram to configure your targets, identified your goals as per priority and importance. . Explain the various related aspects of these varied tracks and how they will, on hitting their own targets, cumulatively contribute to hitting GOAL.\n \n-Business Circle Charts PowerPoint Templates Success goals and targets PPT Slides-This template can be used for presentations relating to 3d, Abstract, Accuracy, Arrow, Art, Background, Board, Business, Card, Celebration, Center, Circle, Competition, Concept, Creative, Dart, Date, Decoration, Design, Event, Fun, Game, Goal, Graphic, Idea, Illustration, Luck, Next, Number, Occasion, Performance, Point, Shot, Sign, Success, Symbol, Target
Marketing Funnel Icon With Dollar Symbol Ppt PowerPoint Presentation Diagram Graph Charts PDF
Presenting this set of slides with name marketing funnel icon with dollar symbol ppt powerpoint presentation diagram graph charts pdf. This is a three stage process. The stages in this process are marketing funnel icon with dollar symbol. This is a completely editable PowerPoint presentation and is available for immediate download. Download now and impress your audience.

Business Charts Coming Out Of Box Success PowerPoint Templates Ppt Backgrounds For Slides 0113
We present our Business Charts Coming Out Of Box Success PowerPoint Templates PPT Backgrounds For Slides 0113.Present our Business PowerPoint Templates because You aspire to touch the sky with glory. Let our PowerPoint Templates and Slides provide the fuel for your ascent. Use our Success PowerPoint Templates because Our PowerPoint Templates and Slides will Activate the energies of your audience. Get their creative juices flowing with your words. Present our Shapes PowerPoint Templates because Our PowerPoint Templates and Slides will effectively help you save your valuable time. They are readymade to fit into any presentation structure. Present our Marketing PowerPoint Templates because You can Channelise the thoughts of your team with our PowerPoint Templates and Slides. Urge them to focus on the goals you have set. Download our Sales PowerPoint Templates because Our PowerPoint Templates and Slides are designed to help you succeed. They have all the ingredients you need.Use these PowerPoint slides for presentations relating to Business charts coming out of a box, marketing, success, sales, shapes, business. The prominent colors used in the PowerPoint template are Red, Blue, Yellow. People tell us our Business Charts Coming Out Of Box Success PowerPoint Templates PPT Backgrounds For Slides 0113 are second to none. People tell us our success PowerPoint templates and PPT Slides will make the presenter look like a pro even if they are not computer savvy. PowerPoint presentation experts tell us our Business Charts Coming Out Of Box Success PowerPoint Templates PPT Backgrounds For Slides 0113 are the best it can get when it comes to presenting. PowerPoint presentation experts tell us our a PowerPoint templates and PPT Slides are topically designed to provide an attractive backdrop to any subject. Presenters tell us our Business Charts Coming Out Of Box Success PowerPoint Templates PPT Backgrounds For Slides 0113 effectively help you save your valuable time. The feedback we get is that our a PowerPoint templates and PPT Slides are designed to make your presentations professional.

Business Charts PowerPoint Templates 4 Steps Planning Circular Direction Diagram Sales
Business Charts PowerPoint templates 4 steps planning circular direction diagram Sales-This Rangoli Based PowerPoint Diagram shows the four step planning process in Circular Manner. It shows four Phases required in any Process related to Business. Use this Fascinating Diagram to make your Presentation delightful.

Business Charts PowerPoint Templates Cards And Dices Happy New Year Sales Marketing Slides
Business Charts PowerPoint templates cards and dices happy new year Sales marketing Slides-New Year is the time at which a new calendar year begins and the calendar's year count is incremented. This PowerPoint Diagram helps you to wish New Year in different way. It consists of many slides with different graphics. It shows different ways of representing 2013 and wishing New Year.

Business Charts PowerPoint Templates 4 Reasons You Should Buy From Circular Process Tables Sales
Business Charts PowerPoint templates 4 reasons you should buy from circular process tables Sales-This PowerPoint Diagram consists of four animated Process tables of Different Colors. It can be used to symbolize four different Approaches or four distinct techniques. It consists of single color slide as well. This diagram will fit for Business Presentations.
Business Charts PowerPoint Templates Design Of An Emoticon Showing Angry Face Sales
Business Charts PowerPoint templates design of an emoticon showing angry face Sales-Use this Business PowerPoint Diagram to represent different types of angry faces. It portrays the concept of animosity, annoyance, antagonism, ill humor, ill temper, impatience, indignation, infuriation, irascibility, ire, irritability, vexation, violence.

Free Business Charts Of 5 Stages Process Strategy Ppt PowerPoint Templates
We present our free business charts of 5 stages process strategy ppt PowerPoint templates.Present our Marketing PowerPoint Templates because It will let you Set new benchmarks with our PowerPoint Templates and Slides. They will keep your prospects well above par. Download our Business PowerPoint Templates because Our PowerPoint Templates and Slides will give good value for money. They also have respect for the value of your time. Download our Layers PowerPoint Templates because It will get your audience in sync. Download and present our Funnels PowerPoint Templates because Our PowerPoint Templates and Slides have the Brilliant backdrops. Guaranteed to illuminate the minds of your audience. Use our cones PowerPoint Templates because Our PowerPoint Templates and Slides will effectively help you save your valuable time. They are readymade to fit into any presentation structure. Use these PowerPoint slides for presentations relating to 2, 3, 3d, 4, 5, Analyses, Analytics, Analyze, Analyzing, Blank, Blue, Business, Buying, Channel, Chart, Cone, Conversion, Diagram, Drawing, Five, Flow, Four, Funnel, Graphics, Icon, Illustration, Internet, Lead, Level, Marketing, Part, Pipe, Purchase, Sale, Seven, Six, Slice, Sliced, Stage, Strategy, Target, Three, Traffic, Two, Vector, Web, Web marketing,. The prominent colors used in the PowerPoint template are Yellow, Gray, White.
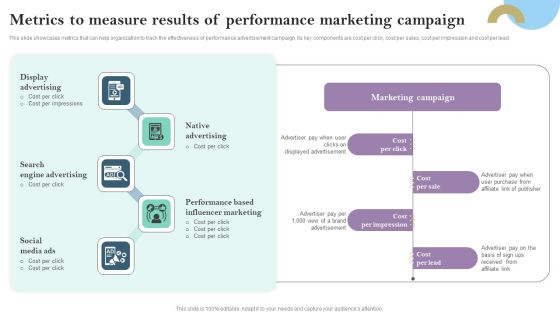
Metrics To Measure Results Of Performance Marketing Campaign Ppt PowerPoint Presentation Diagram Graph Charts PDF
This slide showcases metrics that can help organization to track the effectiveness of performance advertisement campaign. Its key components are cost per click, cost per sales, cost per impression and cost per lead Presenting this PowerPoint presentation, titled Metrics To Measure Results Of Performance Marketing Campaign Ppt PowerPoint Presentation Diagram Graph Charts PDF, with topics curated by our researchers after extensive research. This editable presentation is available for immediate download and provides attractive features when used. Download now and captivate your audience. Presenting this Metrics To Measure Results Of Performance Marketing Campaign Ppt PowerPoint Presentation Diagram Graph Charts PDF. Our researchers have carefully researched and created these slides with all aspects taken into consideration. This is a completely customizable Metrics To Measure Results Of Performance Marketing Campaign Ppt PowerPoint Presentation Diagram Graph Charts PDF that is available for immediate downloading. Download now and make an impact on your audience. Highlight the attractive features available with our PPTs.

6 Benefits Of Data Augmentation In Sales Ppt Diagram Graph Charts PDF
The slide explains the benefits of data enrichment. It includes cost saving, improved customer experience, improved targeting, higher sales gain, and discard redundant data. Presenting 6 Benefits Of Data Augmentation In Sales Ppt Diagram Graph Charts PDF to dispense important information. This template comprises six stages. It also presents valuable insights into the topics including Discard Redundant Data, Improved Targeting, Enhance Customer Nurturing, Cost Saving. This is a completely customizable PowerPoint theme that can be put to use immediately. So, download it and address the topic impactfully.

5 Steps Illustrated In Horizontal Manner Process Flow Charts Examples PowerPoint Templates
We present our 5 steps illustrated in horizontal manner process flow charts examples PowerPoint templates.Download and present our Arrows PowerPoint Templates because it shows you the vision of a desired destination and the best road to take to reach that goal. Download and present our Shapes PowerPoint Templates because it helps your team to align their arrows to consistently be accurate. Download our Signs PowerPoint Templates because generation of sales is the core of any business. Use our Business PowerPoint Templates because you have churned your mind and come upwith solutions. Use our Process and Flows PowerPoint Templates because this diagram has the unique ability to drive home your ideas and show how they mesh to guarantee success.Use these PowerPoint slides for presentations relating to Abstract, Arrows, business, chart, circulation, concept, conceptual, design, diagram, executive, four, icon, idea, illustration, management, map, mapping, model, numbers, organization, procedure, process, progression, resource, sequence, sequential, stages, steps, strategy,. The prominent colors used in the PowerPoint template are Green, Gray, White. The feedback we get is that our 5 steps illustrated in horizontal manner process flow charts examples PowerPoint templates are topically designed to provide an attractive backdrop to any subject. People tell us our circulation PowerPoint templates and PPT Slides are Luxuriant. We assure you our 5 steps illustrated in horizontal manner process flow charts examples PowerPoint templates are Wistful. Presenters tell us our conceptual PowerPoint templates and PPT Slides are Amazing. We assure you our 5 steps illustrated in horizontal manner process flow charts examples PowerPoint templates are Beautiful. Use our concept PowerPoint templates and PPT Slides are Striking.

Hands Emphasizing 7 Stages Process Business Work Flow Charts PowerPoint Slides
We present our hands emphasizing 7 stages process business work flow charts PowerPoint Slides. Use our Advertising PowerPoint Templates because, Will surely see the all making the grade. Use our Shapes PowerPoint Templates because, creating a winner is your passion and dream. Use our Targets PowerPoint Templates because, you have the people in place, selected the team leaders and all are raring to go. Use our Process and Flows PowerPoint Templates because, are the triggers of our growth. Use our Signs PowerPoint Templates because, Start the gears of youthful minds and set them in motion. Use these PowerPoint slides for presentations relating to Adult, alone, arranging, background, child, dirty, empty, family, handprint, hands, human, identity, illustration, isolated, love, messy, naked, objects, paint, painting, palm, set, shape, simple, stage, stained, stamp, toe, togetherness. The prominent colors used in the PowerPoint template are Green, Gray, and White
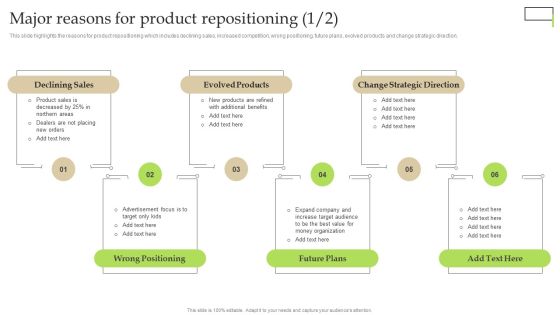
Major Reasons For Product Repositioning Ppt PowerPoint Presentation Diagram Graph Charts PDF
This slide highlights the reasons for product repositioning which includes declining sales, increased competition, wrong positioning, future plans, evolved products and change strategic direction. Do you have to make sure that everyone on your team knows about any specific topic I yes, then you should give Major Reasons For Product Repositioning Ppt PowerPoint Presentation Diagram Graph Charts PDF a try. Our experts have put a lot of knowledge and effort into creating this impeccable Major Reasons For Product Repositioning Ppt PowerPoint Presentation Diagram Graph Charts PDF. You can use this template for your upcoming presentations, as the slides are perfect to represent even the tiniest detail. You can download these templates from the Slidegeeks website and these are easy to edit. So grab these today

PowerPoint Template Horizontal Flow Course Charts Theme Of 5 Stage Diagram Image
We present our PowerPoint template horizontal flow course charts theme of 5 stage diagram Image. Use our Arrows PowerPoint Templates because, getting it done in time is the key to success. Use our Leadership PowerPoint Templates because; Employ the right colors for your brilliant ideas. Use our Process and flows PowerPoint Templates because, Targets: - You have a handle on all the targets, a master of the game, the experienced and consummate juggler. Use our Symbol PowerPoint Templates because, Brainstorming Light Bulbs: - The atmosphere in the workplace is electric. Use our Business PowerPoint Templates because, Marketing Strategy Business Template: - Maximizing sales of your product is the intended destination. Use these PowerPoint slides for presentations relating to Abstract, Arrow, Blank, Business, Chart, Circular, Circulation, Concept, Conceptual, Design, Diagram, Executive, Icon, Idea, Illustration, Linear, Management, Model, Numbers, Organization, Procedure, Process, Progression, Resource, Sequence, Sequential, Stages, Steps, Strategy. The prominent colors used in the PowerPoint template are Green, Gray, and White

3d Consecutive Flow Process 5 Concepts What Is Charts PowerPoint Slides
We present our 3d consecutive flow process 5 concepts what is charts PowerPoint Slides. Use our Business PowerPoint Templates because, Marketing Strategy Business Template:- Maximizing sales of your product is the intended destination. Use our Leadership PowerPoint Templates because, Knowledge is power goes the popular saying. Use our Shapes PowerPoint Templates because, you have it all down to a nicety, slice by slice, layer by layer. Use our Metaphor PowerPoint Templates because, Gears interconnected: - The Gear Train is a basic element of living and daily business. Use our Process and Flows PowerPoint Templates because, But you have the ideas, you have got a brainwave. Use these PowerPoint slides for presentations relating to abstract, arrow, blank, business, chart, circular, circulation, concept, conceptual, consecutive, design, diagram, executive, flow, icon, idea, illustration, management, model, numbers, organization, procedure, process. The prominent colors used in the PowerPoint template are Green, Gray, and Black

Arrows Describing 3 Methods Sequential Manner Ppt Flow Charts Vision PowerPoint Templates
We present our arrows describing 3 methods sequential manner ppt flow charts vision PowerPoint templates.Download our Marketing PowerPoint Templates because this diagram helps you to explain your strategy to co-ordinate activities of these seperate groups. Download and present our Business PowerPoint Templates because you too have got the framework of your companys growth in place. Download and present our Process and Flows PowerPoint Templates because you can Present your views on the methods using our self-explanatory templates. Use our Shapes PowerPoint Templates because this is Aesthetically designed to make a great first impression this template highlights . Download our Arrows PowerPoint Templates because this outlines the path you have in mind in order to boost sales and stay ahead of the competition enhancing your corporate reputation as you go along the road to success.Use these PowerPoint slides for presentations relating to 3d, Abstract, Around, Arrows, Blue, Border, Business, Center, Circle, Circular, Concept, Connections, Copy, Curve, Cycle, Directions, Distribution, Illustration, Management, Middle, Objects, Pieces, Plan, Pointing, Process, Recycle, Rounded, Shadows, Space, System. The prominent colors used in the PowerPoint template are Blue, Gray, Black. People tell us our arrows describing 3 methods sequential manner ppt flow charts vision PowerPoint templates are Wistful. PowerPoint presentation experts tell us our Around PowerPoint templates and PPT Slides are designed by a team of presentation professionals. Presenters tell us our arrows describing 3 methods sequential manner ppt flow charts vision PowerPoint templates are designed by professionals The feedback we get is that our Center PowerPoint templates and PPT Slides will generate and maintain the level of interest you desire. They will create the impression you want to imprint on your audience. You can be sure our arrows describing 3 methods sequential manner ppt flow charts vision PowerPoint templates are Liberated. Professionals tell us our Circle PowerPoint templates and PPT Slides are Dazzling.
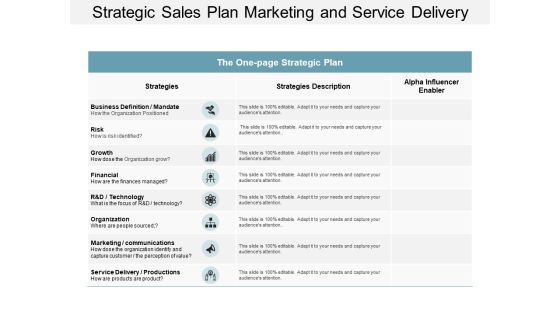
Strategic Sales Plan Marketing And Service Delivery Ppt Powerpoint Presentation Diagram Graph Charts
This is a strategic sales plan marketing and service delivery ppt powerpoint presentation diagram graph charts. This is a three stage process. The stages in this process are one page strategy, one page plan, one page approach.

Project Backlog Management Through Kanban Board Ppt PowerPoint Presentation Diagram Graph Charts PDF
This slide showcases managing project backlogs through Kanban board. It provides information about software features, project requirements, project analysis, proposal, scope, approval, timeline, resources, etc. Slidegeeks is here to make your presentations a breeze with Project Backlog Management Through Kanban Board Ppt PowerPoint Presentation Diagram Graph Charts PDF With our easy to use and customizable templates, you can focus on delivering your ideas rather than worrying about formatting. With a variety of designs to choose from, you are sure to find one that suits your needs. And with animations and unique photos, illustrations, and fonts, you can make your presentation pop. So whether you are giving a sales pitch or presenting to the board, make sure to check out Slidegeeks first.

Introduction And Benefits Of Marketing Collateral Ppt PowerPoint Presentation Diagram Graph Charts PDF
The following slide provides an overview of marketing collateral along with its positive impact on business. It showcases advantages such as standard information communication, reference material for sales, support material for conversations and campaign promotions. Present like a pro with Introduction And Benefits Of Marketing Collateral Ppt PowerPoint Presentation Diagram Graph Charts PDF Create beautiful presentations together with your team, using our easy to use presentation slides. Share your ideas in real time and make changes on the fly by downloading our templates. So whether you are in the office, on the go, or in a remote location, you can stay in sync with your team and present your ideas with confidence. With Slidegeeks presentation got a whole lot easier. Grab these presentations today.

Data Center Relocation Benefits To The Company Ppt PowerPoint Presentation Diagram Graph Charts PDF
The following slide shows the benefits of data center relocation to the company such as increase in overall data center efficiency, reduction in data center expenses and increase in overall data security. Slidegeeks is here to make your presentations a breeze with Data Center Relocation Benefits To The Company Ppt PowerPoint Presentation Diagram Graph Charts PDF With our easy to use and customizable templates, you can focus on delivering your ideas rather than worrying about formatting. With a variety of designs to choose from, you are sure to find one that suits your needs. And with animations and unique photos, illustrations, and fonts, you can make your presentation pop. So whether you are giving a sales pitch or presenting to the board, make sure to check out Slidegeeks first.

Presenting Deals And Offers To Lure Prospects Ppt PowerPoint Presentation Diagram Graph Charts PDF
The following slide showcases deals and offers which can be presented by marketers to lure more customers. It provides information about email marketing sequence, news events, holidays, seasons, etc. Slidegeeks is here to make your presentations a breeze with Presenting Deals And Offers To Lure Prospects Ppt PowerPoint Presentation Diagram Graph Charts PDF With our easy to use and customizable templates, you can focus on delivering your ideas rather than worrying about formatting. With a variety of designs to choose from, you are sure to find one that suits your needs. And with animations and unique photos, illustrations, and fonts, you can make your presentation pop. So whether you are giving a sales pitch or presenting to the board, make sure to check out Slidegeeks first.

Highlighting Role Of Chief Strategy Officer In Corporate Growth Ppt PowerPoint Presentation Diagram Graph Charts PDF
This slide provides information regarding the importance of chief strategy officer in handling firms growth. The responsibilities of CSO include communication with CFO for capital development, identification and management of strategic risks, etc. Slidegeeks is here to make your presentations a breeze with Highlighting Role Of Chief Strategy Officer In Corporate Growth Ppt PowerPoint Presentation Diagram Graph Charts PDF With our easy to use and customizable templates, you can focus on delivering your ideas rather than worrying about formatting. With a variety of designs to choose from, you are sure to find one that suits your needs. And with animations and unique photos, illustrations, and fonts, you can make your presentation pop. So whether you are giving a sales pitch or presenting to the board, make sure to check out Slidegeeks first.
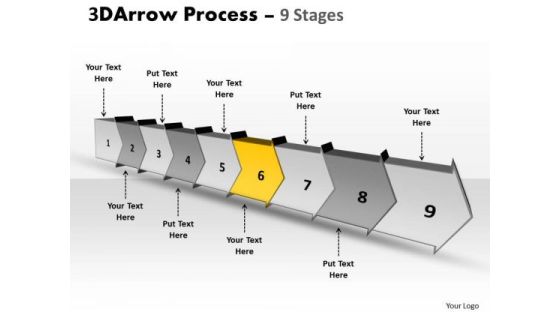
Ppt Template Continous Free Concept Flow Process Charts Diagram 7 Image
We present our PPT template continuous free concept flow process charts diagram 7 Image. Use our Success PowerPoint Templates because, Cycle Template: - Rolling along while gathering profits along the way is the aim. Use our Arrows PowerPoint Templates because, Our Template designs are State of the Art. Use our Business PowerPoint Templates because; transmit your passion via our creative templates. Use our Shapes PowerPoint Templates because; Take your team along by explaining your plans. Use our Symbol PowerPoint Templates because; Lead the way to spread good cheer to one and all. Use these PowerPoint slides for presentations relating to Advertisement, Arrow, Badge, Bread, Crumbs, Business, Button, Collection, Decoration, Design, Direction, Financial, Flow, Gradient, Graph, Green, Grey, Label, Menu, Message, Nobody, Placard, Process, Push, Retail, Round, Sale, Set, Shape, Shiny, Silver, Steps, Symbol. The prominent colors used in the PowerPoint template are Yellow, Gray, and White
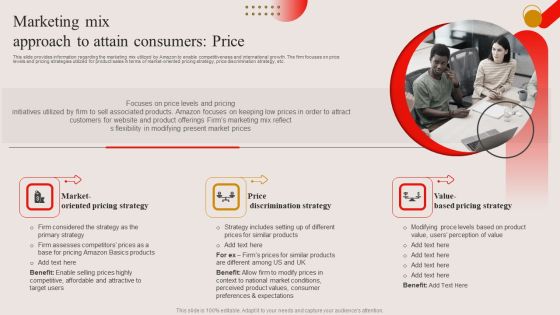
Marketing Mix Approach To Attain Consumers Price Ppt PowerPoint Presentation Diagram Graph Charts PDF
This slide provides information regarding the marketing mix utilized by Amazon to enable competitiveness and international growth. The firm focuses on price levels and pricing strategies utilized for product sales in terms of market-oriented pricing strategy, price discrimination strategy, etc. This Marketing Mix Approach To Attain Consumers Price Ppt PowerPoint Presentation Diagram Graph Charts PDF from Slidegeeks makes it easy to present information on your topic with precision. It provides customization options, so you can make changes to the colors, design, graphics, or any other component to create a unique layout. It is also available for immediate download, so you can begin using it right away. Slidegeeks has done good research to ensure that you have everything you need to make your presentation stand out. Make a name out there for a brilliant performance.

3d Horizontal Demonstration Using Arrows 8 Stages Slides Flow Charts PowerPoint
We present our 3d horizontal demonstration using arrows 8 stages Slides flow charts PowerPoint. Use our Marketing PowerPoint Templates because, they pinpoint the core values of your organization. Use our Shapes PowerPoint Templates because, Spread the light of knowledge around you, clear the doubts and enlighten the questioning minds with your brilliance and ability. Use our Business PowerPoint Templates because, Marketing Strategy Business Template: - Maximizing sales of your product is the intended destination. Use our Process and Flows PowerPoint Templates because, you have analyzed the illness and know the need. Use our Arrows PowerPoint Templates because; Reaffirm to your team your faith in maintaining the highest ethical standards. Use these PowerPoint slides for presentations relating to 3d, abstract, around, arrows, blue, border, business, center, circle, circular, concept, connections, copy, curve, cycle, directions, distribution, illustration, management, middle, objects, pieces, plan, pointing, process, recycle, rounded, shadows, space, system. The prominent colors used in the PowerPoint template are Blue navy, Black, Gray

Business Diagram Four Colorful Pie Charts For Data Representation Presentation Template
This diagram is designed with four colorful pie charts. Download this diagram to analyze the key points. This diagram offers a way for your audience to visually conceptualize the process.

 Home
Home