Value And Benefit
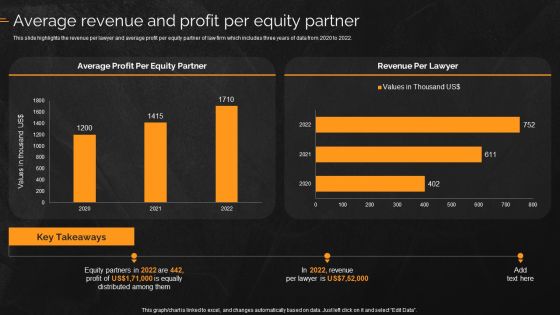
Law And Enforcement Company Profile Average Revenue And Profit Per Equity Partner Summary PDF
This slide highlights the revenue per lawyer and average profit per equity partner of law firm which includes three years of data from 2020 to 2022. Deliver and pitch your topic in the best possible manner with this Law And Enforcement Company Profile Average Revenue And Profit Per Equity Partner Summary PDF. Use them to share invaluable insights on Average Profit, Equity Partner, Revenue Per Lawyer and impress your audience. This template can be altered and modified as per your expectations. So, grab it now.

Real Estate Company Details Net Profit And Margin Analysis Ppt PowerPoint Presentation Model Images PDF
This slide represents the companys net profit and margin for five years which shows strong position due to reduced operating expenses, increased revenue, etc. that allow creditors to know about companys health.Deliver and pitch your topic in the best possible manner with this Real Estate Company Details Net Profit And Margin Analysis Ppt PowerPoint Presentation Model Images PDF. Use them to share invaluable insights on Profit Increased, Increased Revenue, Operating Expenses and impress your audience. This template can be altered and modified as per your expectations. So, grab it now.

Commercial And Urban Architect Business Profile Company Revenue And Profit For 2017 And 2022 Introduction PDF
This slide highlights the company revenue and profit increases with supply chain planning and automation which includes data of 2018 and 2022 through bar graph. Deliver and pitch your topic in the best possible manner with this Commercial And Urban Architect Business Profile Company Revenue And Profit For 2017 And 2022 Introduction PDF. Use them to share invaluable insights on Additional Costs, Revenue Increased, Profits and impress your audience. This template can be altered and modified as per your expectations. So, grab it now.

Average Revenue And Profit Per Equity Partner Multinational Legal Firm Company Profile Inspiration PDF
This slide highlights the revenue per lawyer and average profit per equity partner of law firm which includes three years of data from 2020 to 2022. Deliver and pitch your topic in the best possible manner with this Average Revenue And Profit Per Equity Partner Multinational Legal Firm Company Profile Inspiration PDF. Use them to share invaluable insights on Average Profit, Equity Partner, Revenue Per Lawyer and impress your audience. This template can be altered and modified as per your expectations. So, grab it now.
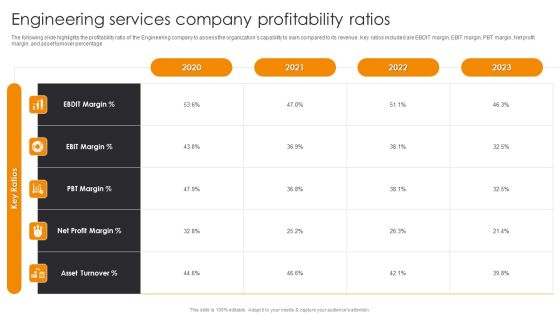
Engineering Services Company Profitability Ratios Engineering Company Financial Analysis Report Sample PDF
The following slide highlights the profitability ratio of the Engineering company to assess the organizations capability to earn compared to its revenue. Key ratios included are EBDIT margin, EBIT margin, PBT margin, Net profit margin, and asset turnover percentage.The best PPT templates are a great way to save time, energy, and resources. Slidegeeks have 100 precent editable powerpoint slides making them incredibly versatile. With these quality presentation templates, you can create a captivating and memorable presentation by combining visually appealing slides and effectively communicating your message. Download Engineering Services Company Profitability Ratios Engineering Company Financial Analysis Report Sample PDF from Slidegeeks and deliver a wonderful presentation.

Online Marketing And Social Media Platforms Pitch Deck Expected Profit Clipart PDF
This template covers the expected profit from all the social media channels. Crafting an eye catching presentation has never been more straightforward. Let your presentation shine with this tasteful yet straightforward Online Marketing And Social Media Platforms Pitch Deck Expected Profit Clipart PDF template. It offers a minimalistic and classy look that is great for making a statement. The colors have been employed intelligently to add a bit of playfulness while still remaining professional. Construct the ideal Online Marketing And Social Media Platforms Pitch Deck Expected Profit Clipart PDF that effortlessly grabs the attention of your audience Begin now and be certain to wow your customers.

Developing Pricing Strategies To Derive Profitability Ppt Inspiration Format Ideas PDF
This slide covers the details related to driving prices and determining true profitability The purpose of this template is to define price management strategies for increasing profitability. It covers information about price setting , contract pricing, promotions, price inquiry, analytics etc. Presenting Developing Pricing Strategies To Derive Profitability Ppt Inspiration Format Ideas PDF to dispense important information. This template comprises five stages. It also presents valuable insights into the topics including Pricing Strategies, Price Setting, Price Maintenance, Pricing Optimization. This is a completely customizable PowerPoint theme that can be put to use immediately. So, download it and address the topic impactfully.

Stocks Fundamental Trend Analysis Table Showing Profitability And Valuation Inspiration PDF
This slide represents the table showing the fundamental analysis of the stocks. It includes information related to key financials for four years along with profitability and valuation.Pitch your topic with ease and precision using this Stocks Fundamental Trend Analysis Table Showing Profitability And Valuation Inspiration PDF. This layout presents information on Profitability Valuation, Key Financials, Revenues. It is also available for immediate download and adjustment. So, changes can be made in the color, design, graphics or any other component to create a unique layout.

Software Company Quarterly Profitability Ratios Financial Performance Report Of Software Firm Icons PDF
The following slide highlights the profitability ratio of the software company to assess the organizations capability to earn compared to its revenue. Key ratios included are EBDIT margin, EBIT margin, PBT margin, Net profit margin, and asset turnover percentage. Make sure to capture your audiences attention in your business displays with our gratis customizable Software Company Quarterly Profitability Ratios Financial Performance Report Of Software Firm Icons PDF. These are great for business strategies, office conferences, capital raising or task suggestions. If you desire to acquire more customers for your tech business and ensure they stay satisfied, create your own sales presentation with these plain slides.

Monthly Profit And Loss Dashboard Reports With Expenses And Revenue Kpis Portrait PDF
This slide shows a dashboard of monthly profit and loss transactions of a company. It depicts last six months expenses, revenues, payment status and customer growth.Showcasing this set of slides titled Monthly Profit And Loss Dashboard Reports With Expenses And Revenue Kpis Portrait PDF. The topics addressed in these templates are Overall Profit Margin, Overall Outstanding Revenue, Customer Growth. All the content presented in this PPT design is completely editable. Download it and make adjustments in color, background, font etc. as per your unique business setting.

Restaurant Budget Management Profit And Loss Statement For 3 Years Microsoft PDF
This slide provide information about last three years restaurant finance management profit and loss report to analysis the business. It includes elements such as category, total sales, food, drinks, manageable expense, occupancy rate, net profit etc. Pitch your topic with ease and precision using this Restaurant Budget Management Profit And Loss Statement For 3 Years Microsoft PDF. This layout presents information on Management Expenditure, Management Expenditure, Occupancy Cost. It is also available for immediate download and adjustment. So, changes can be made in the color, design, graphics or any other component to create a unique layout.
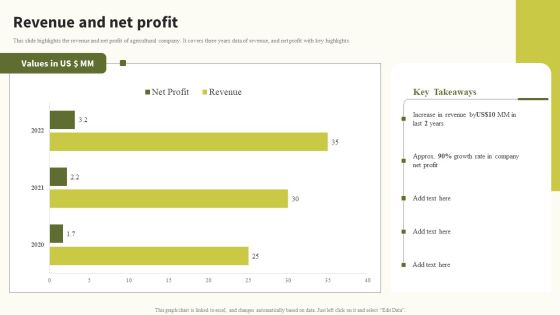
Revenue And Net Profit Global Food Products Company Profile Information PDF
This slide highlights the revenue and net profit of agricultural company. It covers three years data of revenue, and net profit with key highlights. Present like a pro with Revenue And Net Profit Global Food Products Company Profile Information PDF Create beautiful presentations together with your team, using our easy-to-use presentation slides. Share your ideas in real-time and make changes on the fly by downloading our templates. So whether you are in the office, on the go, or in a remote location, you can stay in sync with your team and present your ideas with confidence. With Slidegeeks presentation got a whole lot easier. Grab these presentations today.

Profit Split By Geography Life Science And Healthcare Solutions Company Profile Graphics PDF
The slide showcases the profit share for healthcare company based on the geographical location. It also depicts the historical trend for profit share for last five financial years. If your project calls for a presentation, then Slidegeeks is your go-to partner because we have professionally designed, easy-to-edit templates that are perfect for any presentation. After downloading, you can easily edit Profit Split By Geography Life Science And Healthcare Solutions Company Profile Graphics PDF and make the changes accordingly. You can rearrange slides or fill them with different images. Check out all the handy templates
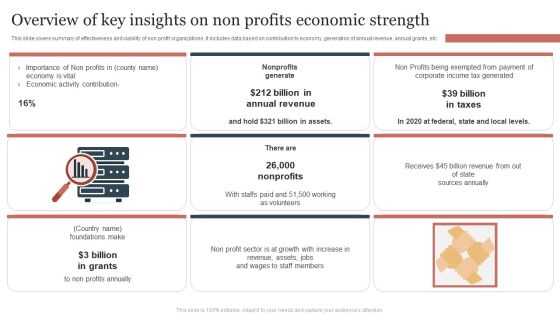
Overview Of Key Insights On Non Profits Economic Strength Summary PDF
This slide covers summary of effectiveness and viability of non profit organizations. It includes data based on contribution to economy, generation of annual revenue, annual grants, etc. Presenting Overview Of Key Insights On Non Profits Economic Strength Summary PDF to dispense important information. This template comprises threestages. It also presents valuable insights into the topics including Annual Revenue, Billion In Taxes, Non Profits. This is a completely customizable PowerPoint theme that can be put to use immediately. So, download it and address the topic impactfully.
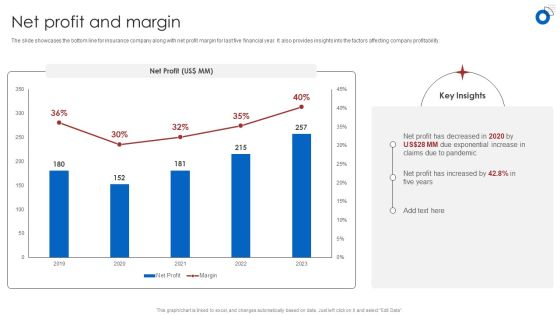
Insurance Business Financial Analysis Net Profit And Margin Ppt Gallery Ideas PDF
The slide showcases the bottom line for insurance company along with net profit margin for last five financial year. It also provides insights into the factors affecting company profitability. Make sure to capture your audiences attention in your business displays with our gratis customizable Insurance Business Financial Analysis Net Profit And Margin Ppt Gallery Ideas PDF. These are great for business strategies, office conferences, capital raising or task suggestions. If you desire to acquire more customers for your tech business and ensure they stay satisfied, create your own sales presentation with these plain slides.
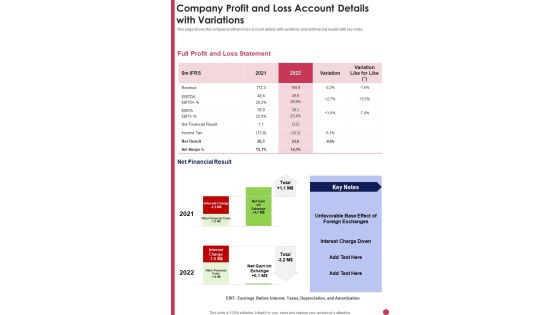
Company Profit And Loss Account Details With Variations Template 280 One Pager Documents
This page shows the company profit and loss account details with variations and net financial results with key notes. Presenting you an exemplary Company Profit And Loss Account Details With Variations Template 280 One Pager Documents. Our one-pager comprises all the must-have essentials of an inclusive document. You can edit it with ease, as its layout is completely editable. With such freedom, you can tweak its design and other elements to your requirements. Download this Company Profit And Loss Account Details With Variations Template 280 One Pager Documents brilliant piece now.

Supply Network Planning And Administration Tactics Company Revenue And Profit Estimation Summary PDF
This slide highlights the company revenue and profit increases with proper supply chain planning which includes two years of data showcasing the profit and revenue key performance indicator. Take your projects to the next level with our ultimate collection of Supply Network Planning And Administration Tactics Company Revenue And Profit Estimation Summary PDF. Slidegeeks has designed a range of layouts that are perfect for representing task or activity duration, keeping track of all your deadlines at a glance. Tailor these designs to your exact needs and give them a truly corporate look with your own brand colors they will make your projects stand out from the rest.

Food Company Financial Performance Summary Operating Profit And Margin Topics PDF
This slide illustrates a graph of operating profit in US dollar and gross margin in percentage for food company. Additionally, it shows operating profit of all business lines of the company food, beverage and dairy products. Find a pre-designed and impeccable Food Company Financial Performance Summary Operating Profit And Margin Topics PDF. The templates can ace your presentation without additional effort. You can download these easy-to-edit presentation templates to make your presentation stand out from others. So, what are you waiting for Download the template from Slidegeeks today and give a unique touch to your presentation.

Data Driven Marketing Solutions Firm Company Profile Gross Profit And Margin Information PDF
The following slide highlights the yearly gross profit from 2017 to 2023. it illustrates the changes in profit and margin along with the reasons for the increase or decrease Make sure to capture your audiences attention in your business displays with our gratis customizable Data Driven Marketing Solutions Firm Company Profile Gross Profit And Margin Information PDF. These are great for business strategies, office conferences, capital raising or task suggestions. If you desire to acquire more customers for your tech business and ensure they stay satisfied, create your own sales presentation with these plain slides.

Comprehensive Guide To Manage Brand Portfolio Mapping Future Profits Through Need State Analysis Introduction PDF
This slide covers a profit pool map illustrating the share of total profits by customer need state analysis. . It includes various segments of processed food customers such as cooking enthusiasts, variety seekers, simplicity seekers, convenience seekers, price sensitive, etc. There are so many reasons you need a Comprehensive Guide To Manage Brand Portfolio Mapping Future Profits Through Need State Analysis Introduction PDF. The first reason is you can not spend time making everything from scratch, Thus, Slidegeeks has made presentation templates for you too. You can easily download these templates from our website easily.

Comparison Analysis Of Profit Of Most Valuable Brands Based On Pictures PDF
This slide presents most valuable technologies in market based on profit comparison of multiple businesses, that provides insights on their operational efficiency and revenue generation. It includes Tech giants such as Apple, Google, Microsoft and Facebook. Showcasing this set of slides titled Comparison Analysis Of Profit Of Most Valuable Brands Based On Pictures PDF. The topics addressed in these templates are Apple Technology, Annual Profits Generated, Improved Cash Flow. All the content presented in this PPT design is completely editable. Download it and make adjustments in color, background, font etc. as per your unique business setting.

Investor Pitch Deck To Collect Capital From Subordinated Loan Income Statement Historical And Forecasted Results Diagrams PDF
The slide provides the historical last 5 years and forecasted coming 4 years numbers of the companys income statement including revenue, gross profit, expenses, operating profit, net profit etc. Deliver an awe-inspiring pitch with this creative investor pitch deck to collect capital from subordinated loan income statement historical and forecasted results diagrams pdf bundle. Topics like historical results, forecast period, income statement, texas, gross profit can be discussed with this completely editable template. It is available for immediate download depending on the needs and requirements of the user.

Stock Market Research Report Income Statement Of Target Company Background PDF
The purpose of the following slide is to display the organizations profit and loss statements Key Performance Indicators such as Net Sales, Expenses, EBITDA and Profit before and after tax. Deliver and pitch your topic in the best possible manner with this stock market research report income statement of target company background pdf. Use them to share invaluable insights on revenue, gross profit, operating expenses, research and development, sales and marketing and impress your audience. This template can be altered and modified as per your expectations. So, grab it now.

Insurance And Financial Product Projected Income Statement For Insurance Business Ideas PDF
The purpose of this slide is to provide glimpse about the projected profit and loss of the firm to visualize firms financial performance for upcoming three years. This is a Insurance And Financial Product Projected Income Statement For Insurance Business Ideas PDF template with various stages. Focus and dispense information on four stages using this creative set, that comes with editable features. It contains large content boxes to add your information on topics like Gross Profit, Goods Sold, Net Profit. You can also showcase facts, figures, and other relevant content using this PPT layout. Grab it now.
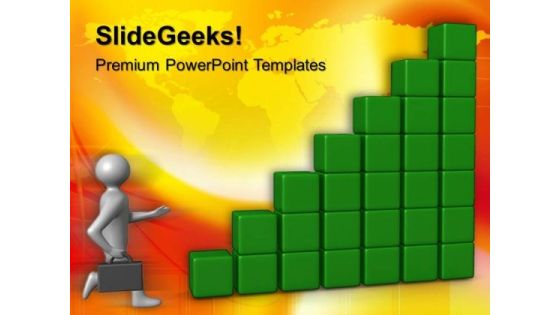
Man Run Towards Profit Business PowerPoint Templates And PowerPoint Themes 0512
Microsoft Powerpoint Templates and Background with run to success-Man Run Towards Profit Business PowerPoint Templates And PowerPoint Themes 0512-These PowerPoint designs and slide layouts can be used for themes relating to -Run to success, background, competition, finance, success, shapes

3d Man Run Towards Profit Global PowerPoint Templates And PowerPoint Themes 0512
Microsoft Powerpoint Templates and Background with businessman with briefcase run to success-These templates can be used for presentations relating to-Businessman with briefcase, global, background, business, success, competition-3d Man Run Towards Profit Global PowerPoint Templates And PowerPoint Themes 0512
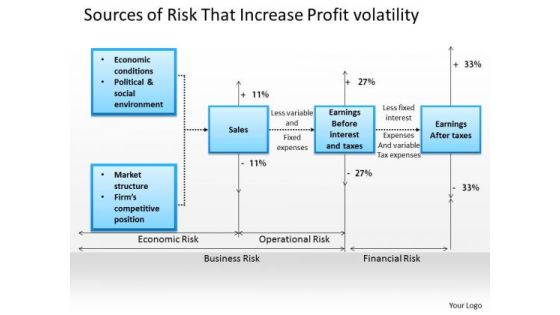
Business Framework Sources Of Risk That Increase Profit Volatility 2 PowerPoint Presentation
This PPT shows the sources of risk that increases profit volatility. This business framework power point template has been designed with graphic of text boxes in flow chart style. Use this PPT for business and marketing related topics.

Example Of Data Driven Marketing For Improved Profitability Diagram Powerpoint Guide
This is a example of data driven marketing for improved profitability diagram powerpoint guide. This is a five stage process. The stages in this process are customer acquisition, customer relation, customer upsell cross sell, lead customer reactivation, customer advocacy.

Horizontal Bar Graph With Profit Percentage Of Company Ppt PowerPoint Presentation Shapes
This is a horizontal bar graph with profit percentage of company ppt powerpoint presentation shapes. This is a five stage process. The stages in this process are business, strategy, marketing, analysis, slide bar, target.

Competitor Analysis Competitor Revenue And Profit Growth Ppt PowerPoint Presentation Slide Download
This is a competitor analysis competitor revenue and profit growth ppt powerpoint presentation slide download. This is a five stage process. The stages in this process are business, marketing, management, finance, growth.
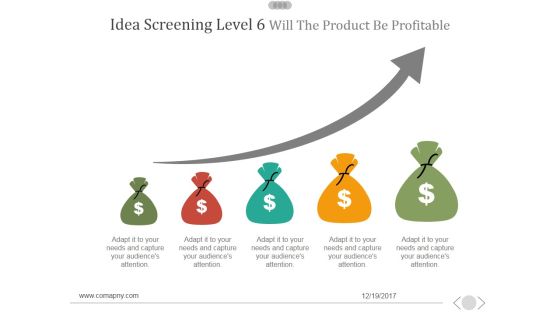
Idea Screening Level 6 Will The Product Be Profitable Ppt PowerPoint Presentation Ideas
This is a idea screening level 6 will the product be profitable ppt powerpoint presentation ideas. This is a five stage process. The stages in this process are business, marketing, success, currency, finance.

Competitor Analysis Competitor Revenue And Profit Growth Ppt PowerPoint Presentation Example 2015
This is a competitor analysis competitor revenue and profit growth ppt powerpoint presentation example 2015. This is a five stage process. The stages in this process are business, strategy, marketing, analysis, growth strategy.

Competitor Analysis Competitor Revenue And Profit Graph Ppt PowerPoint Presentation Gallery Vector
This is a competitor analysis competitor revenue and profit graph ppt powerpoint presentation gallery vector. This is a five stage process. The stages in this process are bar graph, marketing, management, business, presentation.

Competitor Revenue And Profit Template 1 Ppt PowerPoint Presentation Professional Slides
This is a competitor revenue and profit template 1 ppt powerpoint presentation professional slides. This is a five stage process. The stages in this process are business, marketing, circle, process, finance.

Competitor Revenue And Profit Template Ppt PowerPoint Presentation Model Design Inspiration
This is a competitor revenue and profit template ppt powerpoint presentation model design inspiration. This is a five stage process. The stages in this process are business, marketing, graph, success, growth.

Competitor Revenue And Profit Template 1 Ppt PowerPoint Presentation Professional Example File
This is a competitor revenue and profit template 1 ppt powerpoint presentation professional example file. This is a five stage process. The stages in this process are business, finance, marketing, strategy, analysis, growth.

Competitor Revenue And Profit Template 2 Ppt PowerPoint Presentation Styles Examples
This is a competitor revenue and profit template 2 ppt powerpoint presentation styles examples. This is a five stage process. The stages in this process are business, process, management, strategy, competitor.

Competitor Revenue And Profit Template 1 Ppt PowerPoint Presentation Layouts Display
This is a competitor revenue and profit template 1 ppt powerpoint presentation layouts display. This is a five stage process. The stages in this process are business, bar graph, finance, marketing, analysis.

Competitor Revenue And Profit Template 2 Ppt PowerPoint Presentation Infographics Styles
This is a competitor revenue and profit template 2 ppt powerpoint presentation infographics styles. This is a three stage process. The stages in this process are high, market attractiveness, low, weak, global market share, strong.

Profitability Ratios Template 4 Ppt PowerPoint Presentation Infographic Template Clipart Images
This is a profitability ratios template 4 ppt powerpoint presentation infographic template clipart images. This is a two stage process. The stages in this process are business, marketing, bar, finance, planning.

Profitability Ratios Template 5 Ppt PowerPoint Presentation Infographic Template Clipart Images
This is a profitability ratios template 5 ppt powerpoint presentation infographic template clipart images. This is a two stage process. The stages in this process are business, marketing, graph, roce, roa.

Business Profitability And Sales Growth Planning Ppt PowerPoint Presentation Inspiration Ideas
This is a business profitability and sales growth planning ppt powerpoint presentation inspiration ideas. This is a five stage process. The stages in this process are attention, focus area, target area.
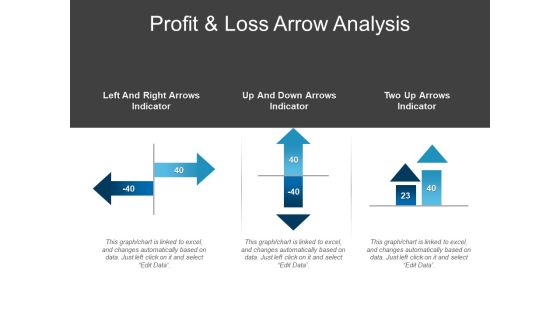
Profit And Loss Arrow Analysis Ppt PowerPoint Presentation Infographic Template Model
This is a profit and loss arrow analysis ppt powerpoint presentation infographic template model. This is a three stage process. The stages in this process are comparison chart, comparison table, comparison matrix.

Investment Planning Factors Economy Trade Profit Ppt PowerPoint Presentation Ideas Slide
This is a investment planning factors economy trade profit ppt powerpoint presentation ideas slide. This is a eight stage process. The stages in this process are financial management, wealth management, investment management.

Drivers Of Profitable Customer Relationship Management Ppt PowerPoint Presentation Inspiration Example Topics
This is a drivers of profitable customer relationship management ppt powerpoint presentation inspiration example topics. This is a three stage process. The stages in this process are decision tree, decision point, driver diagram.
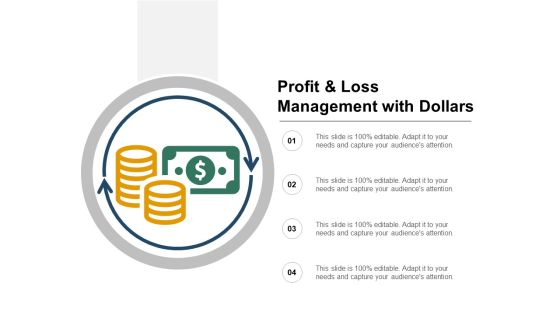
Profit And Loss Management With Dollars Ppt PowerPoint Presentation Portfolio Microsoft
This is a profit and loss management with dollars ppt powerpoint presentation portfolio microsoft. This is a four stage process. The stages in this process are revenue cycle, revenue circle.
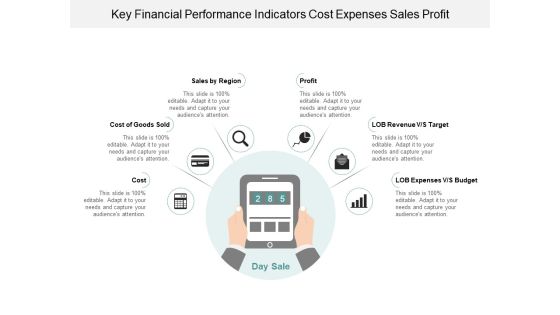
Key Financial Performance Indicators Cost Expenses Sales Profit Ppt Powerpoint Presentation Infographic Template Graphic Images
This is a key financial performance indicators cost expenses sales profit ppt powerpoint presentation infographic template graphic images. This is a six stage process. The stages in this process are dashboard, kpi, metrics.

Profitability Key Performance Indicators Financial Activities Cash Flow Ppt Powerpoint Presentation Portfolio Clipart Images
This is a profitability key performance indicators financial activities cash flow ppt powerpoint presentation portfolio clipart images. This is a five stage process. The stages in this process are dashboard, kpi, metrics.

break even point analysis profit cost and sales volume ppt powerpoint presentation ideas graphics download
This is a break even point analysis profit cost and sales volume ppt powerpoint presentation ideas graphics download. This is a four stage process. The stages in this process are break even point,break even analysis,break even level.

break even point calculation cost and profit analysis ppt powerpoint presentation outline graphics download
This is a break even point calculation cost and profit analysis ppt powerpoint presentation outline graphics download. This is a stage process. The stages in this process are break even point,break even analysis,break even level.

cost volume profit analysis break even point graph ppt powerpoint presentation professional shapes
This is a cost volume profit analysis break even point graph ppt powerpoint presentation professional shapes. This is a four stage process. The stages in this process are break even point,break even analysis,break even level.
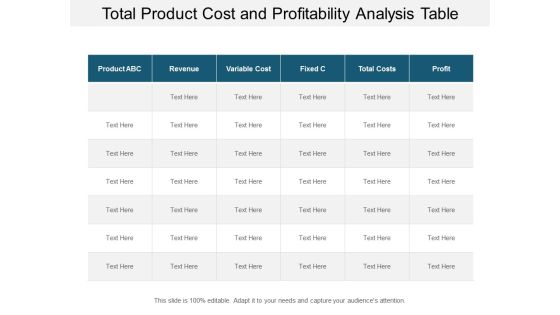
total product cost and profitability analysis table ppt powerpoint presentation summary grid
This is a total product cost and profitability analysis table ppt powerpoint presentation summary grid. This is a six stage process. The stages in this process are break even point,break even analysis,break even level.

Profitability Measures Of Different Departments Ppt PowerPoint Presentation Infographic Template Images
This is a profitability measures of different departments ppt powerpoint presentation infographic template images. This is a five stage process. The stages in this process are product distribution, distribution system, numeric distribution.
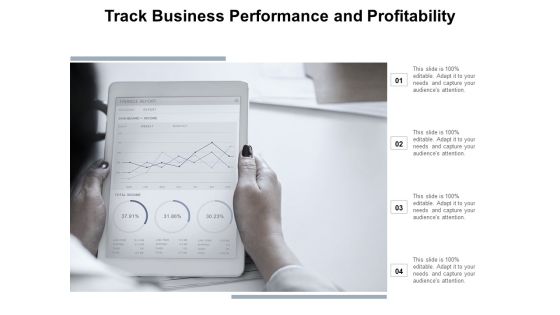
Track Business Performance And Profitability Ppt Powerpoint Presentation File Master Slide
This is a track business performance and profitability ppt powerpoint presentation file master slide. This is a four stage process. The stages in this process are business metrics, business kpi, business dashboard.

Financial Management Kpi Metrics Operating Profit Margin Ppt Powerpoint Presentation Infographic Template Images
This is a financial management kpi metrics operating profit margin ppt powerpoint presentation infographic template images. This is a three stage process. The stages in this process are finance, marketing, management, investment, analysis.
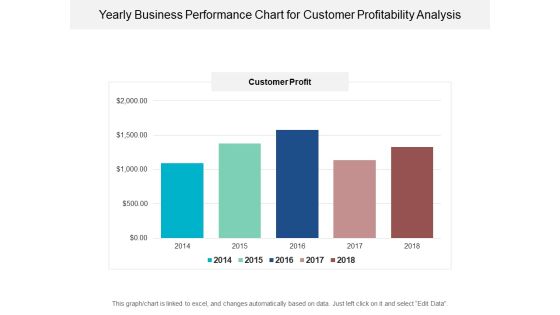
Yearly Business Performance Chart For Customer Profitability Analysis Ppt PowerPoint Presentation Ideas Picture
This is a yearly business performance chart for customer profitability analysis ppt powerpoint presentation ideas picture. This is a five stage process. The stages in this process are financial analysis, quantitative, statistical modelling.
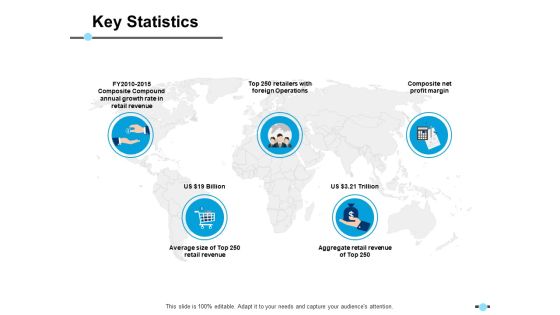
Key Statistics Composite Net Profit Margin Ppt PowerPoint Presentation Show Slides
This is a key statistics composite net profit margin ppt powerpoint presentation show slides. This is a five stage process. The stages in this process are business, location, strategy, analysis, marketing.

Dollar Signs With Growing Up Arrow For Profit Growth Ppt PowerPoint Presentation Layouts Examples
This is a dollar signs with growing up arrow for profit growth ppt powerpoint presentation layouts examples. This is a four stage process. The stages in this process are growth, increase sales, increase revenue.
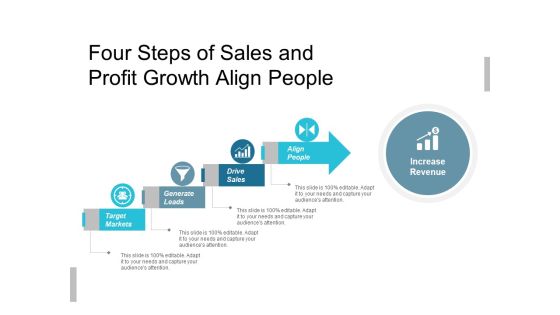
Four Steps Of Sales And Profit Growth Align People Ppt PowerPoint Presentation Infographic Template Deck
This is a four steps of sales and profit growth align people ppt powerpoint presentation infographic template deck. This is a four stage process. The stages in this process are growth, increase sales, increase revenue.
Profit And Financial Growth Arrow With Dollar Signs Ppt PowerPoint Presentation Icon Topics
This is a profit and financial growth arrow with dollar signs ppt powerpoint presentation icon topics. This is a three stage process. The stages in this process are growth, increase sales, increase revenue.
 Home
Home