Use Of Funds
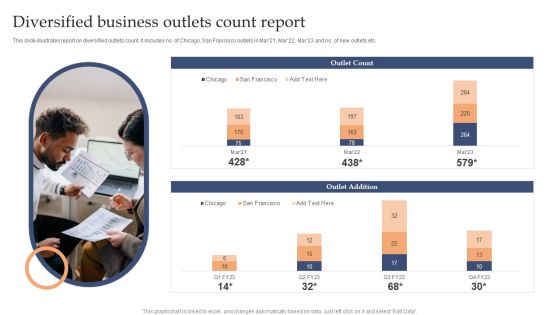
Diversified Business Outlets Count Report Background PDF
This slide illustrates report on diversified outlets count. It includes no. of Chicago, San Francisco outlets in Mar21, Mar22, Mar23 and no. of new outlets etc.Pitch your topic with ease and precision using this Diversified Business Outlets Count Report Background PDF. This layout presents information on Outlet Count, Outlet Addition, Chicago. It is also available for immediate download and adjustment. So, changes can be made in the color, design, graphics or any other component to create a unique layout.
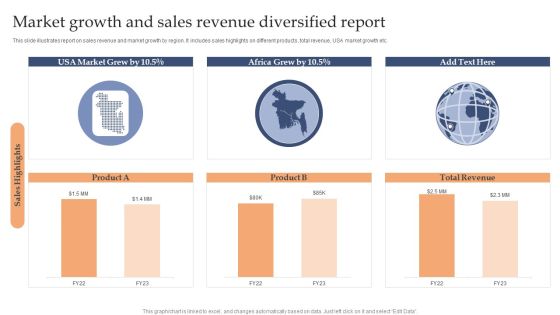
Market Growth And Sales Revenue Diversified Report Sample PDF
This slide illustrates report on sales revenue and market growth by region. It includes sales highlights on different products, total revenue, USA market growth etc.Pitch your topic with ease and precision using this Market Growth And Sales Revenue Diversified Report Sample PDF. This layout presents information on Market Grew, Africa Grew, Total Revenue. It is also available for immediate download and adjustment. So, changes can be made in the color, design, graphics or any other component to create a unique layout.
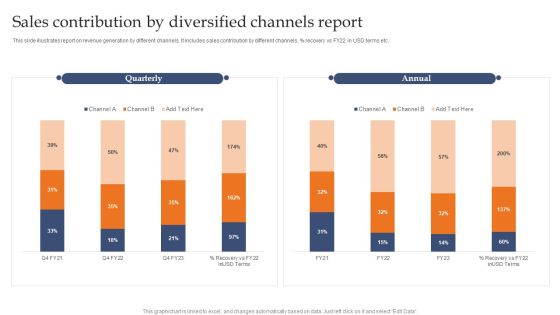
Sales Contribution By Diversified Channels Report Demonstration PDF
This slide illustrates report on revenue generation by different channels. It includes sales contribution by different channels, precent recovery vs FY22 in USD terms etc.Pitch your topic with ease and precision using this Sales Contribution By Diversified Channels Report Demonstration PDF. This layout presents information on Quarterly, Annual, Channel. It is also available for immediate download and adjustment. So, changes can be made in the color, design, graphics or any other component to create a unique layout.

Quarterly Information Dashboard For Website Performance Portrait PDF
This slide displays KPI dashboard to analyze website performance and overall experience of online customers. It includes details about loading speed, internal links, views and average time. Pitch your topic with ease and precision using this Quarterly Information Dashboard For Website Performance Portrait PDF. This layout presents information on Quarterly Information, Dashboard For Website Performance. It is also available for immediate download and adjustment. So, changes can be made in the color, design, graphics or any other component to create a unique layout.
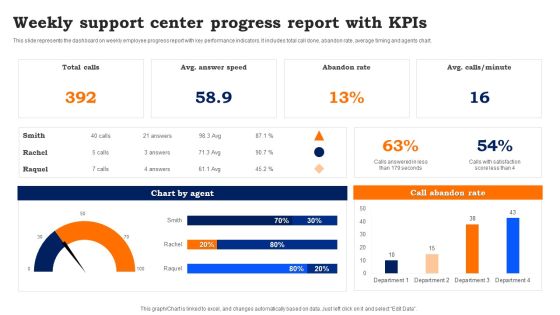
Weekly Support Center Progress Report With Kpis Template PDF
This slide represents the dashboard on weekly employee progress report with key performance indicators. It includes total call done, abandon rate, average timing and agents chart. Pitch your topic with ease and precision using this Weekly Support Center Progress Report With Kpis Template PDF. This layout presents information on Weekly Support, Center Progress Report. It is also available for immediate download and adjustment. So, changes can be made in the color, design, graphics or any other component to create a unique layout.

Corporate Hospitality Administration Dashboard With Occupancy Rate Guidelines PDF
This slide illustrates facts and figures related to hotel chain bookings and occupancy data. It includes visitors, occupancy rate, revenue, bookings comparison, occupancy type, etc.Pitch your topic with ease and precision using this Corporate Hospitality Administration Dashboard With Occupancy Rate Guidelines PDF. This layout presents information on Occupancy Rate, Average Daily Rate, Bookings Comparison. It is also available for immediate download and adjustment. So, changes can be made in the color, design, graphics or any other component to create a unique layout.

Annual Sales Growth Trend Of The Product Summary PDF
The slide shows an increasing trend year-on-year in the sales of the product. It include the sales from 2011 to 2021 with key takeaways.Pitch your topic with ease and precision using this Annual Sales Growth Trend Of The Product Summary PDF. This layout presents information on Increase Sales, Company Growing, Rise Population. It is also available for immediate download and adjustment. So, changes can be made in the color, design, graphics or any other component to create a unique layout.
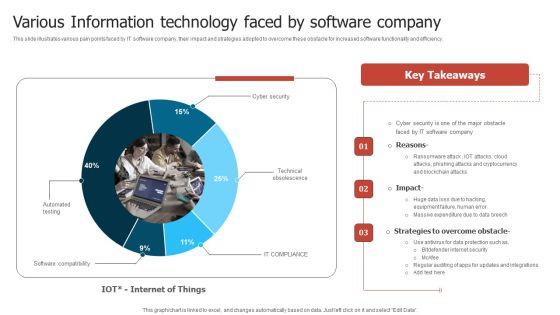
Various Information Technology Faced By Software Company Slides PDF
This slide illustrates various pain points faced by IT software company, their impact and strategies adopted to overcome these obstacle for increased software functionality and efficiency. Pitch your topic with ease and precision using this Various Information Technology Faced By Software Company Slides PDF. This layout presents information on Software Company, Phishing Attacks, Massive Expenditure. It is also available for immediate download and adjustment. So, changes can be made in the color, design, graphics or any other component to create a unique layout.
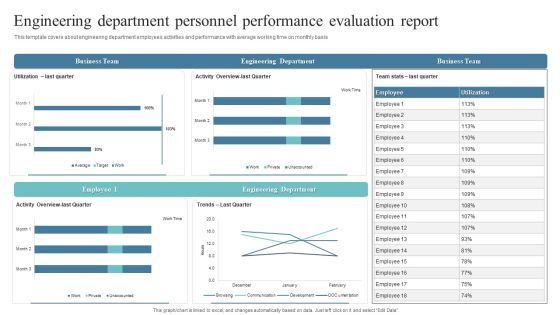
Engineering Department Personnel Performance Evaluation Report Formats PDF
This template covers about engineering department employees activities and performance with average working time on monthly basis. Pitch your topic with ease and precision using this Engineering Department Personnel Performance Evaluation Report Formats PDF. This layout presents information on Business Team, Engineering Department, Business Team. It is also available for immediate download and adjustment. So, changes can be made in the color, design, graphics or any other component to create a unique layout.
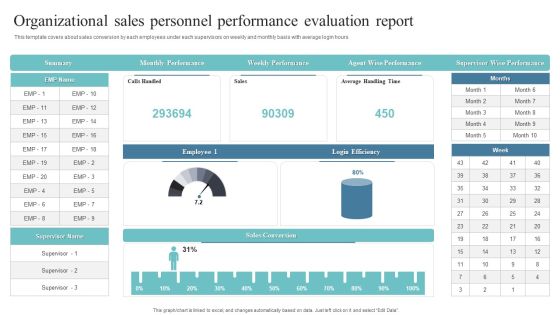
Organizational Sales Personnel Performance Evaluation Report Slides PDF
This template covers about sales conversion by each employees under each supervisors on weekly and monthly basis with average login hours.Pitch your topic with ease and precision using this Organizational Sales Personnel Performance Evaluation Report Slides PDF. This layout presents information on Weekly Performance, Wise Performance, Supervisor Wise Performance. It is also available for immediate download and adjustment. So, changes can be made in the color, design, graphics or any other component to create a unique layout.
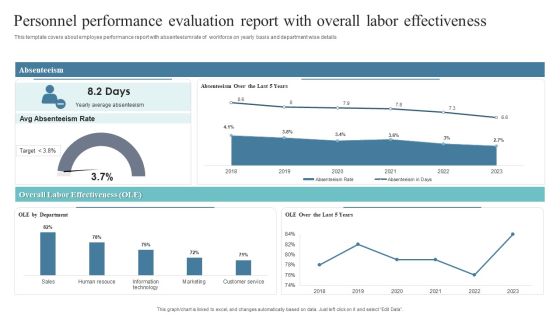
Personnel Performance Evaluation Report With Overall Labor Effectiveness Guidelines PDF
This template covers about employee performance report with absenteeism rate of workforce on yearly basis and department wise details.Pitch your topic with ease and precision using this Personnel Performance Evaluation Report With Overall Labor Effectiveness Guidelines PDF. This layout presents information on Average Absenteeism, Absenteeism Rate, Overall Labor Effectiveness. It is also available for immediate download and adjustment. So, changes can be made in the color, design, graphics or any other component to create a unique layout.
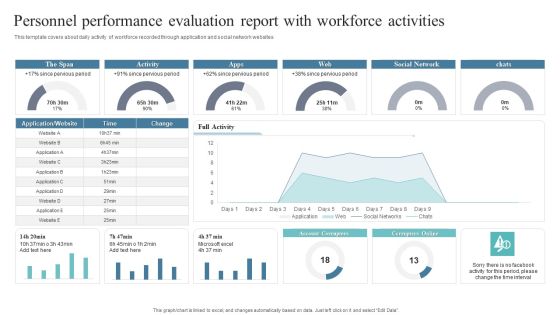
Personnel Performance Evaluation Report With Workforce Activities Designs PDF
This template covers about daily activity of workforce recorded through application and social network websites. Pitch your topic with ease and precision using this Personnel Performance Evaluation Report With Workforce Activities Designs PDF. This layout presents information on Pervious Period, Social Network, Account Corrupters. It is also available for immediate download and adjustment. So, changes can be made in the color, design, graphics or any other component to create a unique layout.

Internal Audit Metrics Dashboard And Status Ppt Layouts Graphic Images PDF
This slide covers the key performance indicator dashboard and status for internal audit. It includes information related to the audit status and risk rating. Pitch your topic with ease and precision using this Internal Audit Metrics Dashboard And Status Ppt Layouts Graphic Images PDF. This layout presents information on Audit Status, Risk Rating, Auditable Entry. It is also available for immediate download and adjustment. So, changes can be made in the color, design, graphics or any other component to create a unique layout.
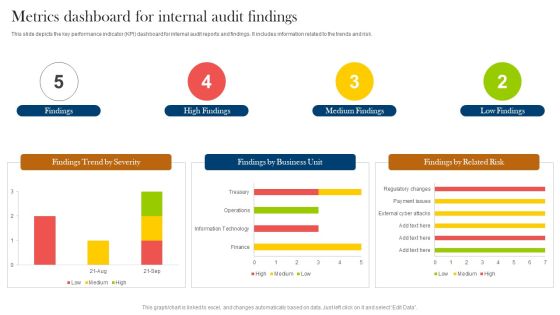
Metrics Dashboard For Internal Audit Findings Ppt Styles Gallery PDF
This slide depicts the key performance indicator KPI dashboard for internal audit reports and findings. It includes information related to the trends and risk. Pitch your topic with ease and precision using this Metrics Dashboard For Internal Audit Findings Ppt Styles Gallery PDF. This layout presents information on Findings, High Findings, Medium Findings, Low Findings. It is also available for immediate download and adjustment. So, changes can be made in the color, design, graphics or any other component to create a unique layout.

Multiplayer Startup Online Business Simulation Dashboard Demonstration PDF
This slide showcases multiplier startup business simulation dashboard. It provides information about individuals, statistics, team processes, adoption, effectiveness, meetings, alignment, communication, etc. Pitch your topic with ease and precision using this Multiplayer Startup Online Business Simulation Dashboard Demonstration PDF. This layout presents information on Individuals, Team Processes, Statistics. It is also available for immediate download and adjustment. So, changes can be made in the color, design, graphics or any other component to create a unique layout.

Online Business Simulation Activity Dashboard With Quarterly Performance Details Guidelines PDF
This slide shows business simulation tasks with performance information. It provides information about financial and production advisor comments, revenue, rivals, profit, strategies, etc. Pitch your topic with ease and precision using this Online Business Simulation Activity Dashboard With Quarterly Performance Details Guidelines PDF. This layout presents information on Financial Adviser, Production Adviser, Revenue. It is also available for immediate download and adjustment. So, changes can be made in the color, design, graphics or any other component to create a unique layout.
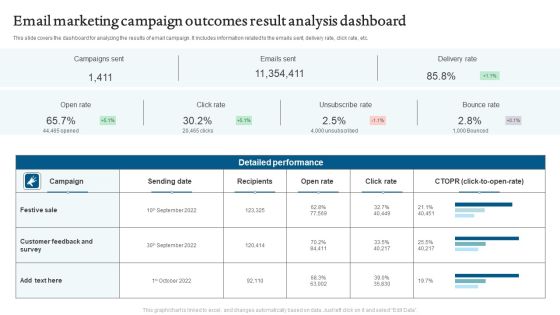
Email Marketing Campaign Outcomes Result Analysis Dashboard Mockup PDF
This slide covers the dashboard for analyzing the email campaign metrics. It includes information related to engagement a key performance indicator KPIs. Pitch your topic with ease and precision using this Email Marketing Campaign Outcomes Result Analysis Dashboard Mockup PDF. This layout presents information on Campaigns Sent, Emails Sent, Delivery Rate. It is also available for immediate download and adjustment. So, changes can be made in the color, design, graphics or any other component to create a unique layout.
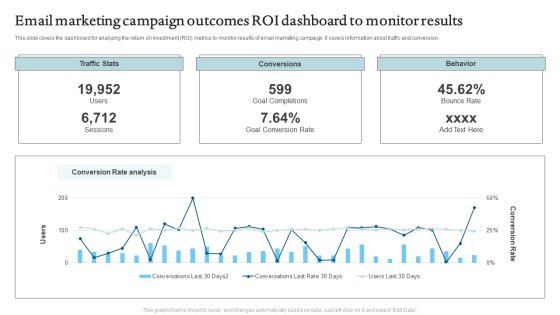
Email Marketing Campaign Outcomes ROI Dashboard To Monitor Results Formats PDF
This slide depicts the dashboard for analyzing the marketing results and campaign performance. It includes information related email sent, delivered, conversions, etc. Pitch your topic with ease and precision using this Email Marketing Campaign Outcomes ROI Dashboard To Monitor Results Formats PDF. This layout presents information on Traffic Stats, Conversions, Behavior. It is also available for immediate download and adjustment. So, changes can be made in the color, design, graphics or any other component to create a unique layout.
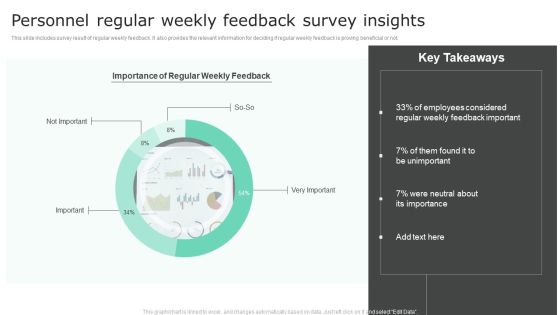
Personnel Regular Weekly Feedback Survey Insights Structure PDF
This slide includes survey result of regular weekly feedback. It also provides the relevant information for deciding if regular weekly feedback is proving beneficial or not. Pitch your topic with ease and precision using this Personnel Regular Weekly Feedback Survey Insights Structure PDF. This layout presents information on Feedback Important, Survey Insights. It is also available for immediate download and adjustment. So, changes can be made in the color, design, graphics or any other component to create a unique layout.

Personnel Survey Insights Analysis Dashboard Inspiration PDF
This slide includes a dashboard of employees survey result significant for understanding employee engagement. It is also important to determine the motivation levels of the employees. Pitch your topic with ease and precision using this Personnel Survey Insights Analysis Dashboard Inspiration PDF. This layout presents information on Employee Survey Result, Overall Survey Results. It is also available for immediate download and adjustment. So, changes can be made in the color, design, graphics or any other component to create a unique layout.

Brand Awareness And Popularity Assessment Dashboard Topics PDF
This slide illustrates graphical representation of facts and figures related with brand awareness. It includes popularity ratings, brand awareness graph, people ratings of brand slogans etc. Pitch your topic with ease and precision using thisBrand Awareness And Popularity Assessment Dashboard Topics PDF. This layout presents information on Customers By Age, Brand Ambassador Analysis, Brand Awareness. It is also available for immediate download and adjustment. So, changes can be made in the color, design, graphics or any other component to create a unique layout.

Artificial Intelligence Capabilities And Applications In Retail Sector Themes PDF
This slide illustrates statistics related to AI application in retail industry. It includes AI types like machine learning, chatbots, natural language processing and swarm intelligence etc. Pitch your topic with ease and precision using this Artificial Intelligence Capabilities And Applications In Retail Sector Themes PDF. This layout presents information on Capabilities And Applications, Retail Sector. It is also available for immediate download and adjustment. So, changes can be made in the color, design, graphics or any other component to create a unique layout.

Artificial Intelligence Sales Capabilities And Revenue Dashboard Portrait PDF
This slide illustrates artificial intelligence and business intelligence corporate revenue dashboard. It includes pipeline for Aug 2023, revenue for Sep 2023, AI augmented opportunities etc. Pitch your topic with ease and precision using this Artificial Intelligence Sales Capabilities And Revenue Dashboard Portrait PDF. This layout presents information on Sales Capabilities, Revenue Dashboard. It is also available for immediate download and adjustment. So, changes can be made in the color, design, graphics or any other component to create a unique layout.

Social Media Artificial Intelligence Data Visualization Capabilities Dashboard Inspiration PDF
This slide illustrates graphical representation of visualization abilities of artificial intelligence on social media. It includes total impressions, total clicks, performance review etc. Pitch your topic with ease and precision using this Social Media Artificial Intelligence Data Visualization Capabilities Dashboard Inspiration PDF. This layout presents information on Artificial Intelligence, Data Visualization Capabilities. It is also available for immediate download and adjustment. So, changes can be made in the color, design, graphics or any other component to create a unique layout.

Annual Sales Comparison Of Corporate Products Themes PDF
This slide covers the comparison of annual business sales. It shows that the sales of product A has been increased by 7 percent due to product improvement. Pitch your topic with ease and precision using this Annual Sales Comparison Of Corporate Products Themes PDF. This layout presents information on Annual Sales, Comparison Of Corporate Products. It is also available for immediate download and adjustment. So, changes can be made in the color, design, graphics or any other component to create a unique layout.
KPI Dashboard Of Client Support Icons PDF
This slide shows customer service delivery key performance indicators dashboard. It includes KPIs such as issues received, average time to close issues, first call resolution, top performers, etc. Pitch your topic with ease and precision using this KPI Dashboard Of Client Support Icons PDF. This layout presents information on KPI Dashboard, Client Support. It is also available for immediate download and adjustment. So, changes can be made in the color, design, graphics or any other component to create a unique layout.
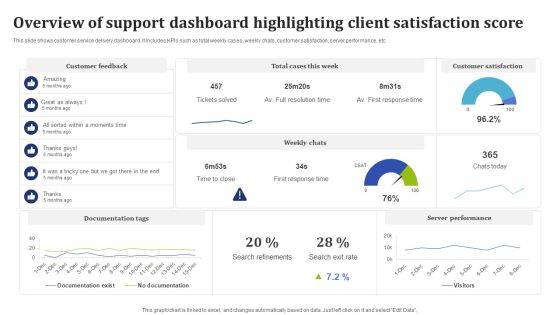
Overview Of Support Dashboard Highlighting Client Satisfaction Score Guidelines PDF
This slide shows customer service delivery dashboard. It includes KPIs such as total weekly cases, weekly chats, customer satisfaction, server performance, etc. Pitch your topic with ease and precision using this Overview Of Support Dashboard Highlighting Client Satisfaction Score Guidelines PDF. This layout presents information on Documentation Tags, Server Performance, Customer Satisfaction. It is also available for immediate download and adjustment. So, changes can be made in the color, design, graphics or any other component to create a unique layout.
Service Desk Tracker Sheet To Monitor Status Of Ticket Professional PDF
This slide showcases tracker sheet that includes ticket details. It includes ticket number, priority, description, reported date and responsible person. Pitch your topic with ease and precision using this Service Desk Tracker Sheet To Monitor Status Of Ticket Professional PDF. This layout presents information on Ticket Number, Description, Responsible Person. It is also available for immediate download and adjustment. So, changes can be made in the color, design, graphics or any other component to create a unique layout.
New Commodity Development Assessment Metrics Icons PDF
The following slide highlights the key metrics to evaluate product performance. It includes elements such as product wise revenue, time to the market etc.Pitch your topic with ease and precision using this New Commodity Development Assessment Metrics Icons PDF. This layout presents information on Annual Product, Wise Revenue, Shown Continuous. It is also available for immediate download and adjustment. So, changes can be made in the color, design, graphics or any other component to create a unique layout.
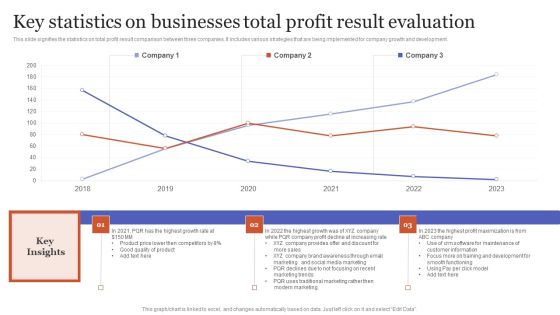
Key Statistics On Businesses Total Profit Result Evaluation Rules PDF
This slide signifies the statistics on total profit result comparison between three companies. It includes various strategies that are being implemented for company growth and development.Pitch your topic with ease and precision using this Key Statistics On Businesses Total Profit Result Evaluation Rules PDF. This layout presents information on Traditional Marketing, Modern Marketing, Training Development. It is also available for immediate download and adjustment. So, changes can be made in the color, design, graphics or any other component to create a unique layout.
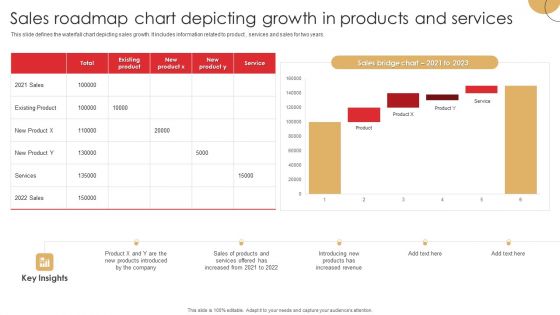
Sales Roadmap Chart Depicting Growth In Products And Services Ideas PDF
This slide defines the waterfall chart depicting sales growth. It includes information related to product , services and sales for two years.Pitch your topic with ease and precision using this Sales Roadmap Chart Depicting Growth In Products And Services Ideas PDF. This layout presents information on Products Introduced, Increased Revenue, Services Offered. It is also available for immediate download and adjustment. So, changes can be made in the color, design, graphics or any other component to create a unique layout.

Data And Analytics Impact Analysis On Business Slides PDF
This slide covers potential impact of data and analytics on location based services and other sectors. It also includes major barriers to adoption disrupting the process. Pitch your topic with ease and precision using this Data And Analytics Impact Analysis On Business Slides PDF. This layout presents information on Retail, Manufacturing, Location Based Data. It is also available for immediate download and adjustment. So, changes can be made in the color, design, graphics or any other component to create a unique layout.

Social Media Online Content Marketing Strategy Dashboard Clipart PDF
This slide represents dashboard for social media content marketing. It covers page visits, post reach, page overview, total click rate, post summary etc. Pitch your topic with ease and precision using this Social Media Online Content Marketing Strategy Dashboard Clipart PDF. This layout presents information on Social Media, Online Content Marketing, Strategy Dashboard. It is also available for immediate download and adjustment. So, changes can be made in the color, design, graphics or any other component to create a unique layout.

Brand Remodeling Strategy Of Financial Institutions Professional PDF
Following slide presents a statistical overview of branch transformation strategy of financial institutions. Major elements covered are branch design transformation, increase customer care executives, cross channel integration etc. Pitch your topic with ease and precision using this Brand Remodeling Strategy Of Financial Institutions Professional PDF. This layout presents information on Brand Remodeling Strategy, Financial Institutions. It is also available for immediate download and adjustment. So, changes can be made in the color, design, graphics or any other component to create a unique layout.
Pareto Analysis Shipping Tracking Metrics Dashboard Guidelines PDF
This slide showcases dashboard for analyzing on-time delivery trends. It also includes KPIs such as Pareto analysis and on-time deliveries by shipping organizations. Pitch your topic with ease and precision using this Pareto Analysis Shipping Tracking Metrics Dashboard Guidelines PDF. This layout presents information on Pareto Analysis, Deliveries Trends, Shipping Organization. It is also available for immediate download and adjustment. So, changes can be made in the color, design, graphics or any other component to create a unique layout.
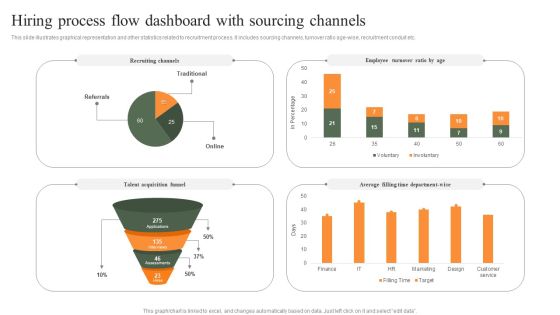
Hiring Process Flow Dashboard With Sourcing Channels Professional PDF
This slide illustrates graphical representation and other statistics related to recruitment process. It includes sourcing channels, turnover ratio age-wise, recruitment conduit etc. Pitch your topic with ease and precision using this Hiring Process Flow Dashboard With Sourcing Channels Professional PDF. This layout presents information on Employee Turnover Ratio, Recruiting Channels, Average. It is also available for immediate download and adjustment. So, changes can be made in the color, design, graphics or any other component to create a unique layout.
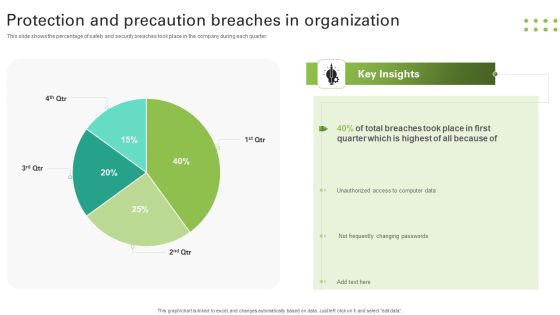
Protection And Precaution Breaches In Organization Slides PDF
This slide shows the percentage of safety and security breaches took place in the company during each quarter. Pitch your topic with ease and precision using this Protection And Precaution Breaches In Organization Slides PDF. This layout presents information on Breaches Took, Quarter, Unauthorized, Changing Passwords. It is also available for immediate download and adjustment. So, changes can be made in the color, design, graphics or any other component to create a unique layout.

Business Components Share Exploded Donut Circle Chart Elements PDF
This slide depicts the share of business components for a successful company and earn profits. It shows the percentage distribution of different components of business. Pitch your topic with ease and precision using this Business Components Share Exploded Donut Circle Chart Elements PDF. This layout presents information on Administration, Marketing, Customer Support. It is also available for immediate download and adjustment. So, changes can be made in the color, design, graphics or any other component to create a unique layout.

Countries Information Technology Export Share Circle Chart Inspiration PDF
This slide depicts IT export share chart of countries to determine global market share. It includes export market share percentage of different countries. Pitch your topic with ease and precision using this Countries Information Technology Export Share Circle Chart Inspiration PDF. This layout presents information on Countries Information Technology, Export Share Circle Chart. It is also available for immediate download and adjustment. So, changes can be made in the color, design, graphics or any other component to create a unique layout.

Employees Sales Performance Comparison Circle Chart Topics PDF
This slide shows the sales share percentage chart by salespersons to gain an understanding of the performance of employees. It includes teams and their sales percentage. Pitch your topic with ease and precision using this Employees Sales Performance Comparison Circle Chart Topics PDF. This layout presents information on Employees Sales Performance, Comparison Circle Chart. It is also available for immediate download and adjustment. So, changes can be made in the color, design, graphics or any other component to create a unique layout.

Software Sales Distribution Circle Chart Demonstration PDF
This slide shows sales distribution of software chart to determine market leader in IT industry. It shows quarterly software sales distribution in percentage. Pitch your topic with ease and precision using this Software Sales Distribution Circle Chart Demonstration PDF. This layout presents information on Software Sales Distribution, Circle Chart. It is also available for immediate download and adjustment. So, changes can be made in the color, design, graphics or any other component to create a unique layout.

USA Phone Market Share Circle Chart Sample PDF
This slide depicts phone market share chart of USA to determine market leader in United States of America. It includes market share of phone companies in USA. Pitch your topic with ease and precision using this USA Phone Market Share Circle Chart Sample PDF. This layout presents information on USA Phone Market, Share Circle Chart. It is also available for immediate download and adjustment. So, changes can be made in the color, design, graphics or any other component to create a unique layout.

Geographical Analysis Of Quarterly Sales Performance Of Business Portrait PDF
This slide displays sales record for different countries to implement marketing strategies. It also includes key insights for the statistics. Pitch your topic with ease and precision using this Geographical Analysis Of Quarterly Sales Performance Of Business Portrait PDF. This layout presents information on Geographical Analysis, Quarterly Sales, Performance Of Business. It is also available for immediate download and adjustment. So, changes can be made in the color, design, graphics or any other component to create a unique layout.

Quarterly Sales Performance Of Business Dashboard With Region And Product Wise Comparison Guidelines PDF
This slide displays sales analysis for different products and regions in each quarter. t also includes inter year comparisons. Pitch your topic with ease and precision using this Quarterly Sales Performance Of Business Dashboard With Region And Product Wise Comparison Guidelines PDF. This layout presents information on Product Wise Quarterly Sales, Comparison. It is also available for immediate download and adjustment. So, changes can be made in the color, design, graphics or any other component to create a unique layout.
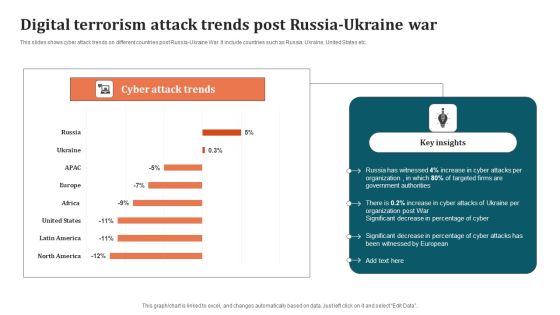
Digital Terrorism Attack Trends Post Russia Ukraine War Graphics PDF
This slides shows cyber attack trends on different countries post Russia-Ukraine War. It include countries such as Russia, Ukraine, United States etc. Pitch your topic with ease and precision using this Digital Terrorism Attack Trends Post Russia Ukraine War Graphics PDF. This layout presents information on Organization, Digital Terrorism Attack Trends. It is also available for immediate download and adjustment. So, changes can be made in the color, design, graphics or any other component to create a unique layout.
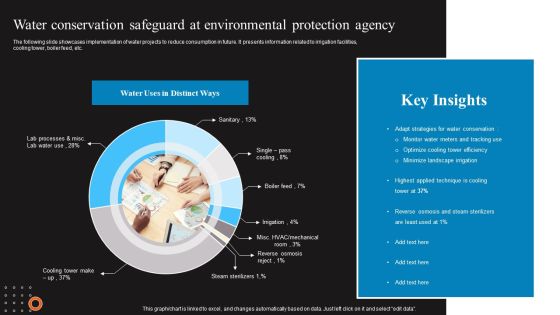
Water Conservation Safeguard At Environmental Protection Agency Sample PDF
The following slide showcases implementation of water projects to reduce consumption in future. It presents information related to irrigation facilities, cooling tower, boiler feed, etc. Pitch your topic with ease and precision using this Water Conservation Safeguard At Environmental Protection Agency Sample PDF. This layout presents information on Adapt Strategies, Applied Technique, Key Insights. It is also available for immediate download and adjustment. So, changes can be made in the color, design, graphics or any other component to create a unique layout.

Daily Guests And Subscribers Linear Chart Clipart PDF
This slide illustrates comparison chart of subscribers and guests on daily basis to measure website success. It includes days and number of subscribers Pitch your topic with ease and precision using this Daily Guests And Subscribers Linear Chart Clipart PDF. This layout presents information on Key Insight, Website, Subscribers Chart. It is also available for immediate download and adjustment. So, changes can be made in the color, design, graphics or any other component to create a unique layout.
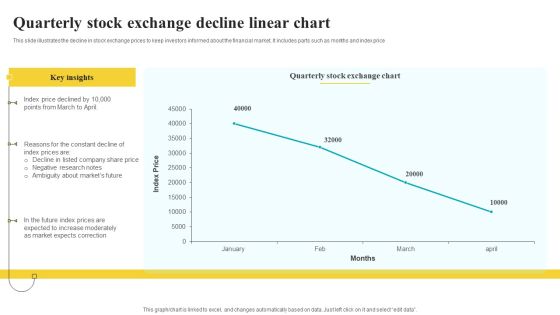
Quarterly Stock Exchange Decline Linear Chart Inspiration PDF
This slide illustrates the decline in stock exchange prices to keep investors informed about the financial market. It includes parts such as months and index price Pitch your topic with ease and precision using this Quarterly Stock Exchange Decline Linear Chart Inspiration PDF. This layout presents information on Key Insights, Exchange Chart, Correction. It is also available for immediate download and adjustment. So, changes can be made in the color, design, graphics or any other component to create a unique layout.
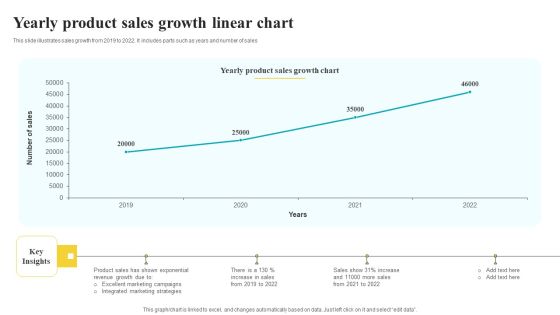
Yearly Product Sales Growth Linear Chart Pictures PDF
This slide illustrates sales growth from 2019 to 2022. It includes parts such as years and number of sales Pitch your topic with ease and precision using this Yearly Product Sales Growth Linear Chart Pictures PDF. This layout presents information on Sales Growth Chart, Key Insights, Strategies. It is also available for immediate download and adjustment. So, changes can be made in the color, design, graphics or any other component to create a unique layout.
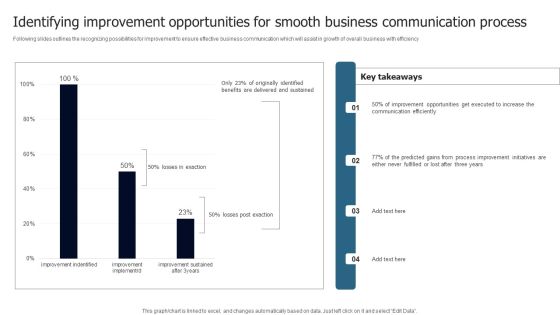
Identifying Improvement Opportunities For Smooth Business Communication Process Introduction PDF
Following slides outlines the recognizing possibilities for improvement to ensure effective business communication which will assist in growth of overall business with efficiency Pitch your topic with ease and precision using this Identifying Improvement Opportunities For Smooth Business Communication Process Introduction PDF. This layout presents information on Key Takeaways, Three Years, Efficiently. It is also available for immediate download and adjustment. So, changes can be made in the color, design, graphics or any other component to create a unique layout.
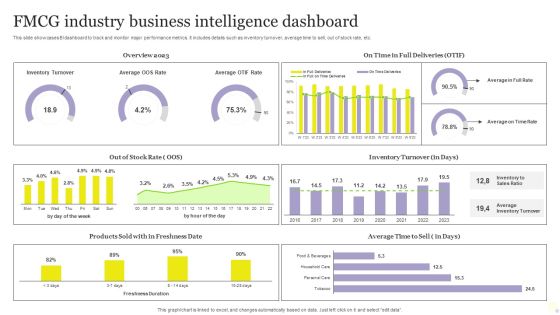
FMCG Industry Business Intelligence Dashboard Mockup PDF
This slide showcases BI dashboard to track and monitor major performance metrics. It includes details such as inventory turnover, average time to sell, out of stock rate, etc. Pitch your topic with ease and precision using this FMCG Industry Business Intelligence Dashboard Mockup PDF. This layout presents information on Average, Inventory Turnover, Business Intelligence Dashboard. It is also available for immediate download and adjustment. So, changes can be made in the color, design, graphics or any other component to create a unique layout.

Disaster Recovery Planning Strategic Reporting Inspiration PDF
Mentioned slide includes DRP strategy progress report to determine actions taken to solve business issues. It includes business areas such as systems, services, staff, supplier and sites Pitch your topic with ease and precision using this Disaster Recovery Planning Strategic Reporting Inspiration PDF. This layout presents information on Systems, Services, Staff. It is also available for immediate download and adjustment. So, changes can be made in the color, design, graphics or any other component to create a unique layout.
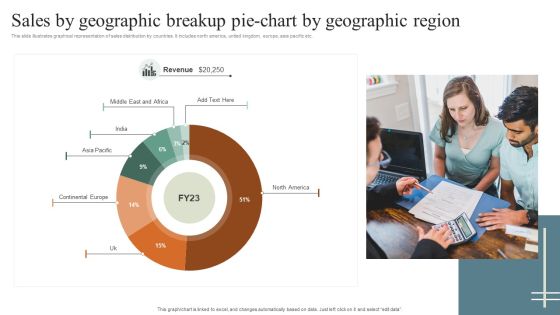
Sales By Geographic Breakup Pie Chart By Geographic Region Rules PDF
This slide illustrates graphical representation of sales distribution by countries. It includes north america, united kingdom, europe, asia pacific etc. Pitch your topic with ease and precision using this Sales By Geographic Breakup Pie Chart By Geographic Region Rules PDF. This layout presents information on Sales By Geographic, Geographic Region. It is also available for immediate download and adjustment. So, changes can be made in the color, design, graphics or any other component to create a unique layout.

Social Media Visibility Comparative Analysis Brochure PDF
The slide illustrates a comparative analysis survey to evaluate the presence of various companies on social media. Various social media platforms included are Facebook, Instagram and Twitter Pitch your topic with ease and precision using this Social Media Visibility Comparative Analysis Brochure PDF. This layout presents information on YYYYYYYYYYYYYYYYYYYYYYYYYYYYYYYYYYYYYYYYY. It is also available for immediate download and adjustment. So, changes can be made in the color, design, graphics or any other component to create a unique layout.

Pre And Post Process Results Of Cyber Security Process Changes Sample PDF
This slide shows reduction in threats percentage after adopting cyber security. It includes computer virus, data breach, DOS and phishing. Pitch your topic with ease and precision using this Pre And Post Process Results Of Cyber Security Process Changes Sample PDF. This layout presents information on Process Results, Process Changes, Key Insights. It is also available for immediate download and adjustment. So, changes can be made in the color, design, graphics or any other component to create a unique layout.

Corporate Bonus Payouts And Performance Incentives Dashboard Mockup PDF
This slide illustrates facts and figures related to performance bonus in a corporation. It includes total monthly payouts, eligible employee payout, target achievement analysis etc. Pitch your topic with ease and precision using this Corporate Bonus Payouts And Performance Incentives Dashboard Mockup PDF. This layout presents information on Monthly Payouts, Employee Payout, Average Employee. It is also available for immediate download and adjustment. So, changes can be made in the color, design, graphics or any other component to create a unique layout.

Call Center Kpis Customer Service Dashboard Pictures PDF
This slide covers contact center customer service metrics KPI dashboard. It involves details such as ticket status, chats created, self serve performance and customer feedback. Pitch your topic with ease and precision using this Call Center Kpis Customer Service Dashboard Pictures PDF. This layout presents information on Response Time, Customer, Dashboard. It is also available for immediate download and adjustment. So, changes can be made in the color, design, graphics or any other component to create a unique layout.

Call Center Kpis Dashboard With Routine Tasks Structure PDF
This slide covers contact center daily operational metrics KPI dashboard. It involves metrics such as ticket status, ticket solved by agents, response time and full resolution time. Pitch your topic with ease and precision using this Call Center Kpis Dashboard With Routine Tasks Structure PDF. This layout presents information on Agent, Response Time, Routine Tasks. It is also available for immediate download and adjustment. So, changes can be made in the color, design, graphics or any other component to create a unique layout.

Call Center Kpis Reporting And Analytics Dashboard Download PDF
This slide covers contact center reporting and analytics metrics dashboard. It involves metrics such as total unsuccessful calls, competence, activity, agent details and quality rate. Pitch your topic with ease and precision using this Call Center Kpis Reporting And Analytics Dashboard Download PDF. This layout presents information on Activity, Quality, Dashboard. It is also available for immediate download and adjustment. So, changes can be made in the color, design, graphics or any other component to create a unique layout.
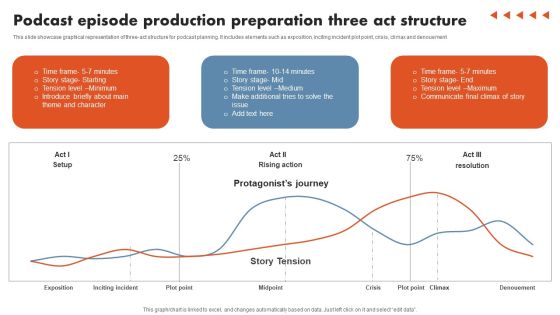
Podcast Episode Production Preparation Three Act Structure Elements PDF
This slide showcase graphical representation of three-act structure for podcast planning. It includes elements such as exposition, inciting incident plot point, crisis, climax and denouement. Pitch your topic with ease and precision using this Podcast Episode Production Preparation Three Act Structure Elements PDF. This layout presents information on Podcast Episode Production, Preparation Three Act Structure. It is also available for immediate download and adjustment. So, changes can be made in the color, design, graphics or any other component to create a unique layout.


 Continue with Email

 Home
Home


