AI PPT Maker
Templates
PPT Bundles
Design Services
Business PPTs
Business Plan
Management
Strategy
Introduction PPT
Roadmap
Self Introduction
Timelines
Process
Marketing
Agenda
Technology
Medical
Startup Business Plan
Cyber Security
Dashboards
SWOT
Proposals
Education
Pitch Deck
Digital Marketing
KPIs
Project Management
Product Management
Artificial Intelligence
Target Market
Communication
Supply Chain
Google Slides
Research Services
 One Pagers
All Categories
-
Home
- Customer Favorites
- Use Of Funds
Use Of Funds

Business Framework Relationship Diagram PowerPoint Presentation
This diagram is an effective tool to convey processes, relationships and connections. Use this diagram to present a clear visual structure to your audience so that you can highlight important points. This diagram will help you catch your audiences attention.
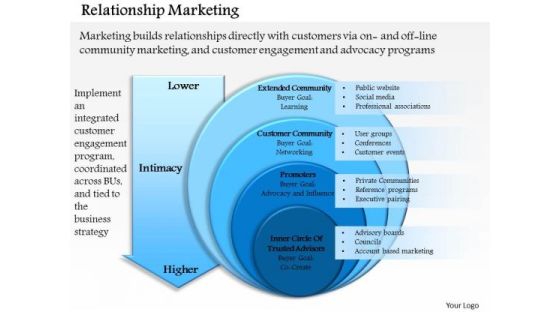
Business Framework Relationship Marketing 1 PowerPoint Presentation
This business framework diagram displays layout of relationship marketing. Use this diagram in your presentations to express views on relationship marketing. This diagram is perfect to make professional presentations.
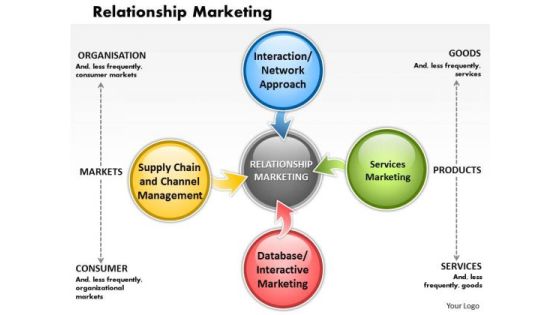
Business Framework Relationship Marketing PowerPoint Presentation
This business framework diagram displays layout of relationship marketing. Use this diagram in your presentations to express views on relationship marketing. This diagram is perfect to make professional presentations.
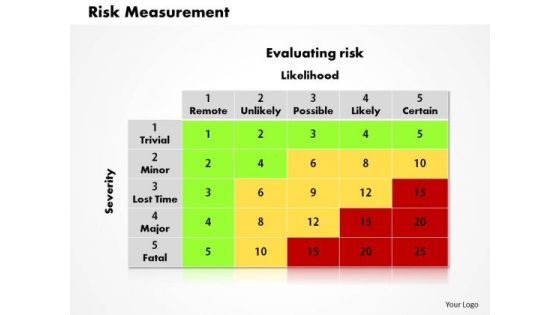
Business Framework Risk Measurement PowerPoint Presentation
The above slide has framework of risk measurement. Use this diagram for giving a clear message in a structured manner. This template helps you to grab the attention of your listener.
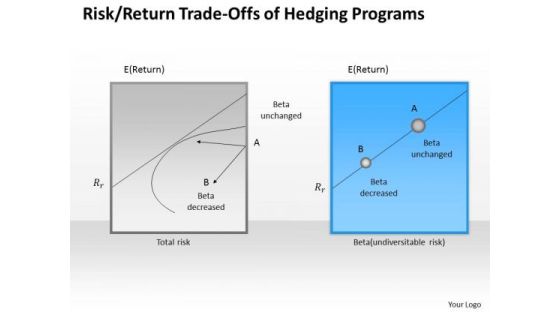
Business Framework Risk Return Trade Offs Of Hedging Programs PowerPoint Presentation
This diagram displays risk return tradeoffs of hedging programs. Use this diagram in your presentation and make it more effective. This pre designed high quality business diagram will make your presentation simply the best.
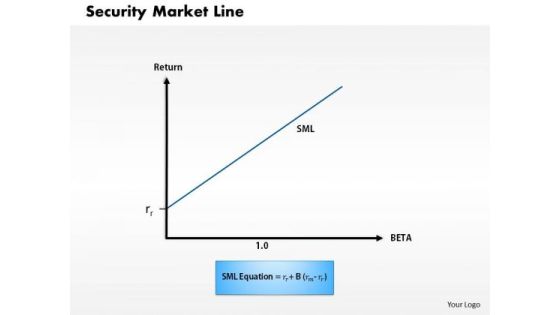
Business Framework Security Market Line 1 PowerPoint Presentation
This diagram displays graph of security market line. You can use line graph to plot changes in data over time, such as monthly revenue and earnings changes or daily changes in stock market prices.

Business Framework Security Market Line 11 PowerPoint Presentation
This diagram displays graph of security market line. You can use line graph to plot changes in data over time, such as monthly revenue and earnings changes or daily changes in stock market prices.
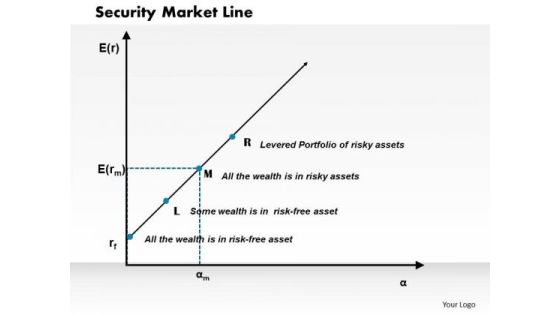
Business Framework Security Market Line PowerPoint Presentation
This diagram displays graph of security market line. You can use line graph to plot changes in data over time, such as monthly revenue and earnings changes or daily changes in stock market prices.

Business Framework Seo Value Proposition 4 Layers PowerPoint Presentation
Download this business diagram to give presentations on search engine optimization. Above diagram displays SEO value proposition with 4 layers. Use this professional and customized business diagram for PowerPoint.
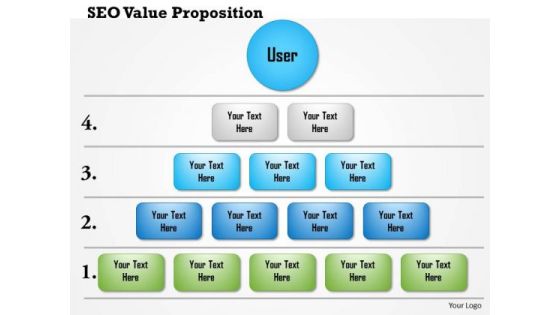
Business Framework Seo Value Proposition 5 Layers PowerPoint Presentation
Download this business diagram to give presentations on search engine optimization. Above diagram displays SEO value proposition with 5 layers. Use this professional and customized business diagram for PowerPoint.
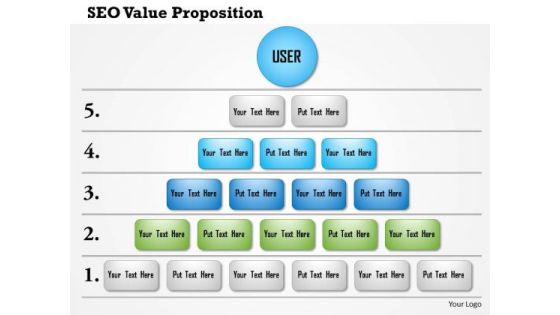
Business Framework Seo Value Proposition 6 Layers PowerPoint Presentation
Download this business diagram to give presentations on search engine optimization. Above diagram displays SEO value proposition with 6 layers. Use this professional and customized business diagram for PowerPoint.
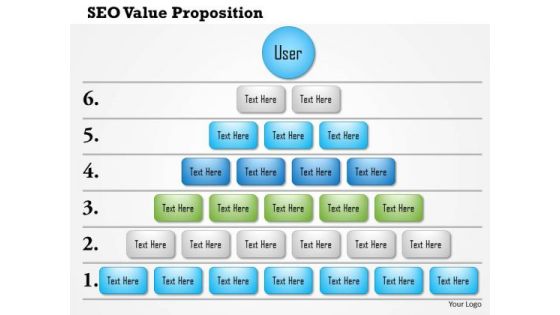
Business Framework Seo Value Proposition 7 Layers PowerPoint Presentation
Download this business diagram to give presentations on search engine optimization. Above diagram displays SEO value proposition with 7 layers. Use this professional and customized business diagram for PowerPoint.
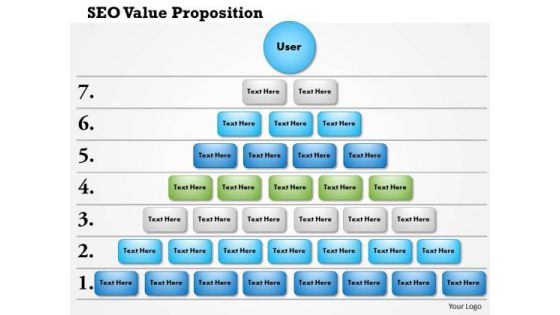
Business Framework Seo Value Proposition 8 Layers PowerPoint Presentation
Download this business diagram to give presentations on search engine optimization. Above diagram displays SEO value proposition with 8 layers. Use this professional and customized business diagram for PowerPoint.
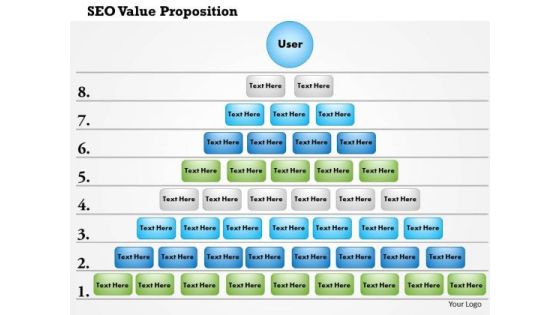
Business Framework Seo Value Proposition 9 Layers PowerPoint Presentation
Download this business diagram to give presentations on search engine optimization. Above diagram displays SEO value proposition with 9 layers. Use this professional and customized business diagram for PowerPoint.

Business Diagram Percentage Pie Chart On Computer Tablet Presentation Slide Template
This business diagram power point template has been designed with graphic of pie chart. This pie chart contains the various percentage values for business result analysis. Use this pie chart for your business result display related presentations.
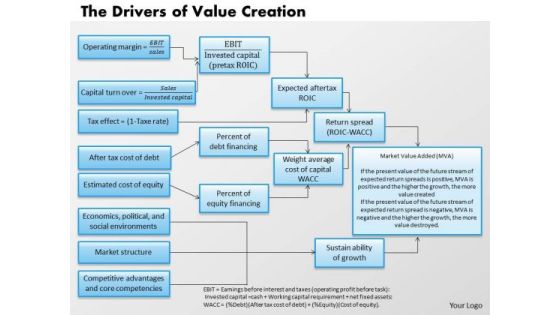
Business Framework The Drivers Of Value Creation PowerPoint Presentation
Above diagram provides framework for the drivers of value creation. It contains flow-chart depicting formula and steps for value creation. Use this professional and customized business diagram for PowerPoint presentations.
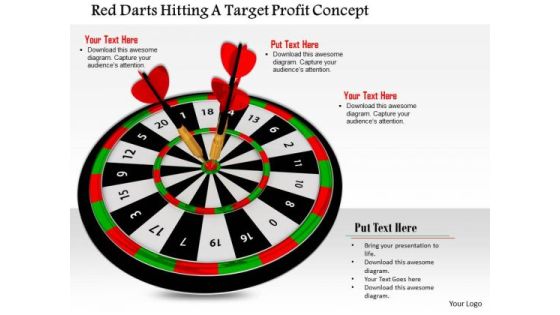
Stock Photo Red Darts Hitting A Target Profit Concept PowerPoint Slide
This image slide is designed with red darts hitting a target. This image contains darts on target board depicting concepts of business achievements and targets. Use this amazing layout to make outstanding presentations.

Stock Photo Smartphone Shopping Cart Credit Card PowerPoint Slide
This image slide is designed with graphics of smart phone with credit card. This image depicts shopping through mobile apps. You may use this layout to display your content in an interesting, eye-catching manner.

Stock Photo Basketball White Grey Background PowerPoint Slide
This image slide has been crafted with graphic of basketball and white grey background. This slide contains the concept of gaming and success. Use this image for entertainment and game related presentations.

Stock Photo Basketballs In Line White Background Game PowerPoint Slide
This PowerPoint slide has been designed with graphic of basketballs in line on white background. This slide contains the concept of basketball game. Use this image for your success and game related presentations.
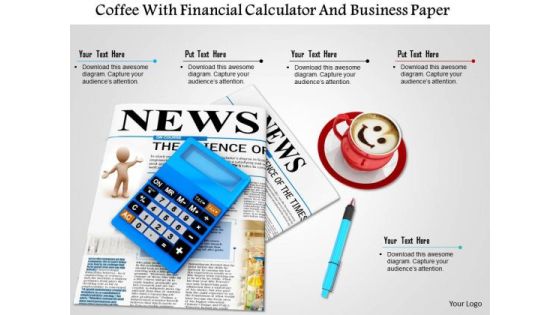
Stock Photo Coffee With Financial Calculator And Business Paper PowerPoint Slide
This image slide is designed with graphic of financial calculator with coffee cup and news paper. This image explains the concept of workplace and coffee break with its suitable graphics. Use this image to make business presentations.
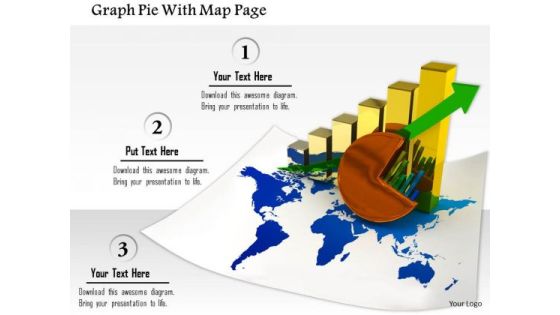
Stock Photo Graph Pie With Map Page PowerPoint Slide
This image slide contains business charts on world map. This image is designed with bar graph and pie chart on world map depicting global economy. Use this image slide to represent financial growth in any business presentation.

Business Diagram Pstm Mobile Network With Base Stations And Atm Bsc Presentation Template
This lside displays pstm mobile network with base stations and atm bsc. explain the working of pstm mobile network with base station. This diagram also include atm bsc process. Use this diagram slide to build quality presentation.
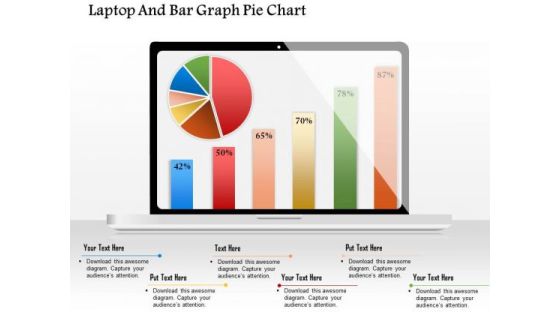
Business Diagram Laptop And Bar Graph Pie Chart Presentation Template
This Power Point template has been designed with graphic of target dart. This PPT diagram contains the concept of information communication. Use this PPT in your business communication related presentations.
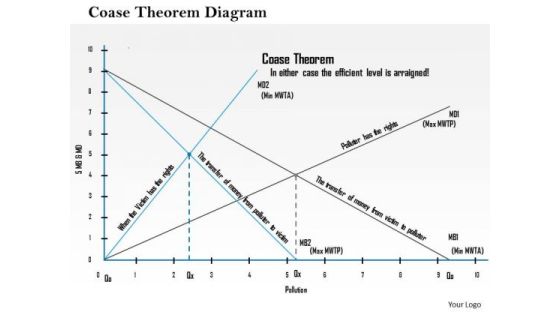
Business Framework Coase Theorem Diagram PowerPoint Presentation
This professional power point template has been crafted with graphic of cloud with laptop and application icons. This PPt shows the concept of cloud computing for devices. Use this PPT for your technology and business related topics.
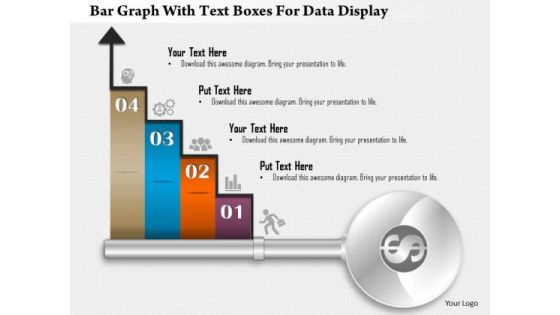
Business Diagram Bar Graph With Text Boxes For Data Display Presentation Template
Our above business diagram displays bar graph. It contains four steps on bar graph with icons. Use this diagram to display four stages of business growth. Download this Power Point slide to build quality presentation for your viewers.

Stock Photo Balloons Inside The Gift Box Fo Celebration PowerPoint Slide
Concept of celebration has been displayed in this power point template. This slide contains the graphic of balloons and gift box. Use this image slide to express your views on party and celebrations.

Stock Photo Dollars Covered With Lock And Chain PowerPoint Slide
This Power Point image template has been designed with graphic of dollar and chain. In this image dollar is covered with chain which shows the concept of safety. Use this image template financial security related presentations.

Business Diagram Golden Silver And Gold Trophy For Champions And Gold Medal Presentation Template
This business diagram has been designed with graphic of trophies. This business slide contains the concept of success and victory. Use this diagram to present your views in a wonderful manner.
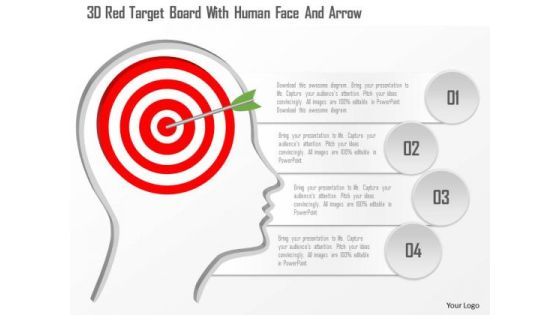
Busines Diagram 3d Red Target Board With Human Face And Arrow Presentation Template
This business diagram has been designed with graphic of 3d red target board on human face. This business slide helps to portray the concept of target achievement. Use this awesome slide for business and marketing target related presentations.
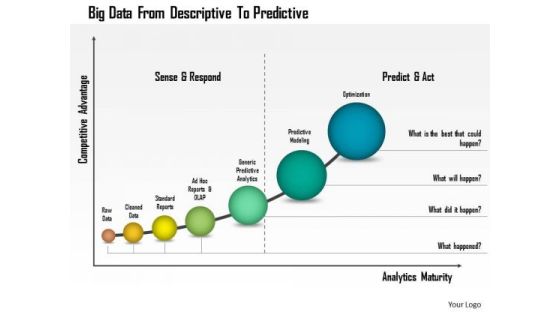
Business Diagram Big Data From Descriptive To Predictive Presentation Template
This business diagram has been designed with graphic of linear bar graph. This growing bar graph depicts the concept of big data analysis. Use this professional diagram for your financial and business analysis.
Business Diagram Five Staged Business Process Diagram With Icons Presentation Template
Our above slide displays five staged business process diagram. Download our above diagram to express information in a visual way. Use this diagram and get good comments for data related presentations.

Business Diagram Bull And Bear Marketing Technology Presentation Template
This power point template slide has been designed with graphic of bull and bear. This PPT contains the concept of growth and decay. Use this PPT for business and marketing related presentations.

Business Diagram Thermometer Graphics Indicating Progress Presentation Template
This power point template diagram has been designed with graphic of thermometer and bar graph. This PPT contains the concept of growth analysis. Use this PPT for business and marketing related presentations.
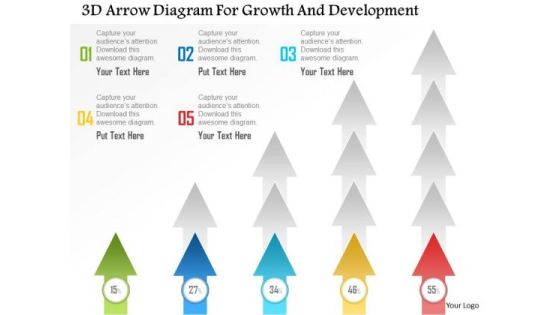
Business Diagram 3d Arrow Diagram For Growth And Development Presentation Template
This power point template diagram has been designed with graphic of 3d arrow. This PPt contains the concept of growth and development. Use this PPT for business and marketing related presentations.
Business Diagram Pie Chart With Icons For Financial Analysis Presentation Template
This professional business diagram slide has been designed with pie chart and icons. It contains concept of financial analysis. Use this slide to build exclusive presentations for your viewers.
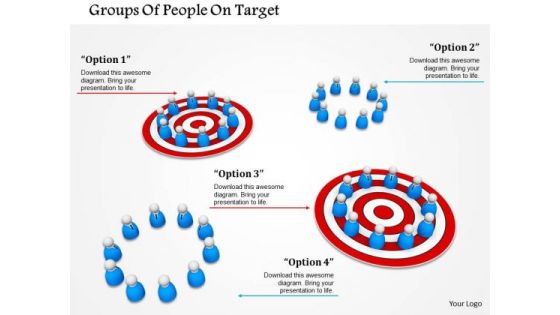
Stock Photo Groups Of People On Target PowerPoint Slide
This image slide contains groups of people on target. Download this image to portray concepts like team targets and communication. Use this image to enhance the beauty of your words.
Business Diagram Cloud Icon For Data Storage Presentation Template
Concept of cloud computing and data storage has been defined in this power point template. This business diagram contains the graphic of clouds. Use this diagram for business and technology related presentations.

Business Diagram Folders For Financial Review Presentation Template
This business diagram has been designed with graphics of colored folders. You may download this slide for financial review. Use this slide to create an impact on your viewers.
Business Diagram Modern Icons On Pie Chart Presentation Template
Download this diagram to displays marketing strategy. This business diagram contains the graphic of icons on pie graph. Use this template to highlight the key issues of your presentation.
Business Diagram Icons Around Pie Chart Presentation Template
Strategy and planning can be displayed with this business diagram. This slide contains the graphic of icons around pie chart Use this editable slide to build quality presentation for your viewers.
Business Diagram Icons And Charts For Business Growth Presentation Template
Our above slide contains graphics of business charts and icons. It helps to display business reports and analysis. Use this diagram to impart more clarity to data and to create more sound impact on viewers.
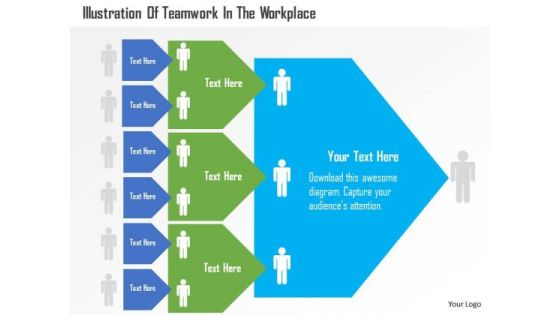
Business Diagram Illustration Of Teamwork In The Workplace Presentation Template
Our above business diagram illustrates teamwork in workplace. This slide is suitable for teamwork related presentations. Use this business diagram to present your work in a more smart and precise manner.

Business Diagram Matrix Chart For Financial Review Presentation Template
Our above business diagram has been designed with graphics of matrix chart. This slide is suitable to present financial review. Use this business diagram to present your work in a more smart and precise manner.

Bars Displaying Percentage Growth PowerPoint Templates
Our above PPT slide contains bar graph displaying percentage growth. This diagram of bar graph helps to depict statistical information. Use this diagram to impart more clarity to data and to create more sound impact on viewers.
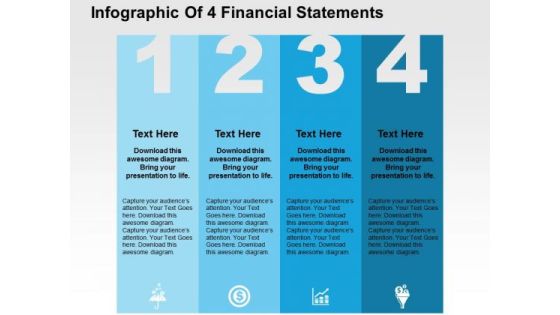
Infographic Of 4 Financial Statements PowerPoint Template
Four financial statements can be displayed in this business diagram. This slide contains the graphic of four text boxes with icons Use this editable slide to build quality presentation for your viewers.

Bar Graph With Five Icons Powerpoint Slides
This PowerPoint slide contains diagram bar graph with icons. This PPT slide helps to exhibit concepts of financial deal and planning. Use this business slide to make impressive presentations.

Circle Chart With Percentage Value Analysis Powerpoint Slides
This PowerPoint template has been designed with circular process diagram. This business diagram helps to exhibit financial process control and analysis. Use this diagram to visually support your content.
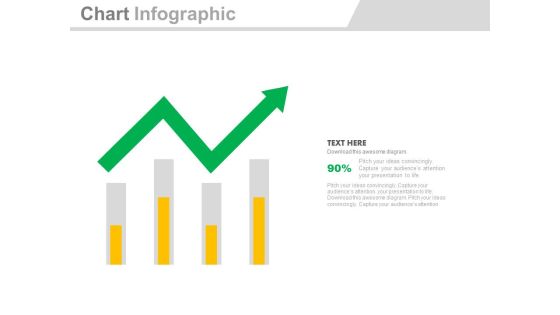
Four Bars With Green Growth Arrow Powerpoint Slides
Four bars with green arrow have been displayed in this business slide. This business diagram helps to exhibit process of business planning. Use this diagram to build an exclusive presentation.

Four Circles With Percentage Data Display Powerpoint Slides
This PowerPoint template has been designed with graphics of four circles. Download this PPT slide to display percentage data display. Use this professional template to build an exclusive presentation.
Four Colored Text Boxes With Icons Powerpoint Slides
This PowerPoint template has been designed with graphics of four text boxes. Download this PPT slide to display percentage data display. Use this professional template to build an exclusive presentation.
Four Linear Steps And Icons Powerpoint Slides
This PPT slide has been designed with four linear text boxes with icons. This PowerPoint template helps to exhibit process of business planning. Use this diagram slide to build an exclusive presentation.

Four Tags For Financial Review And Analysis Powerpoint Slides
This PowerPoint template has been designed with four tags and financial values. This PowerPoint template helps to exhibit financial review and analysis. Use this diagram slide to build an exclusive presentation.

Red Green Teams Comparison Chart Powerpoint Slides
This PPT slide displays graphics of two red and green teams. Use this PPT design to display comparison of teams performances. This PowerPoint template can be customized as per requirements of business education or any other theme.

Table For Total Sales Analysis Powerpoint Slides
This PowerPoint template has been designed with four steps table chart. Use this PPT slide to display total sales analysis. Download this template to leave permanent impression on your audience.

Triangle With Two Segments And Percentage Values Powerpoint Slides
This PowerPoint template contains graphics of triangle with two segments and percentage values. You may use this PPT slide for financial planning. The color coding of this template is specifically designed to highlight you points.
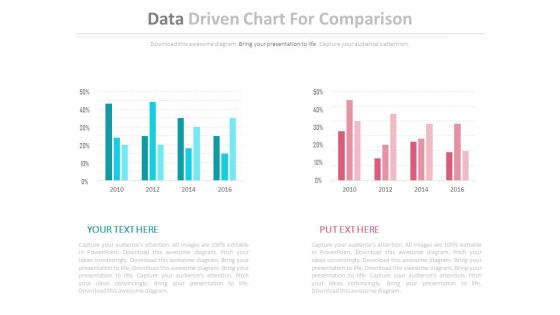
Two Data Driven Comparison Charts Powerpoint Slides
This PowerPoint template contains diagram of two data driven charts. You may use this PPT slide to depict strategic analysis for business. The color coding of this template is specifically designed to highlight you points.
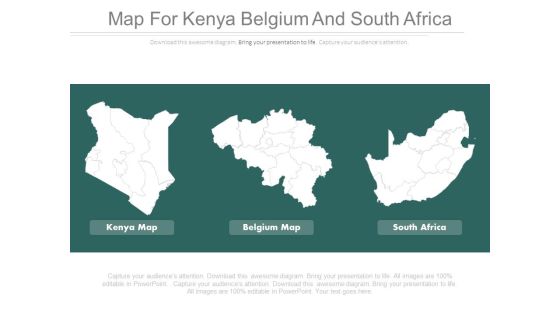
Maps For Kenya Belgium And South Africa Powerpoint Slides
This PowerPoint template has been designed with maps of Kenya, Belgium and South Africa. You may use this PPT slide depict area comparison of these three countries. Above slide provide ideal backdrop to make impressive presentations.

Dashboards For Profit Growth Analysis Powerpoint Slides
This PowerPoint template has been designed with graphics of dashboard. You may use this dashboard slide design to exhibit profit growth analysis. This PPT slide is powerful tool to describe your ideas.
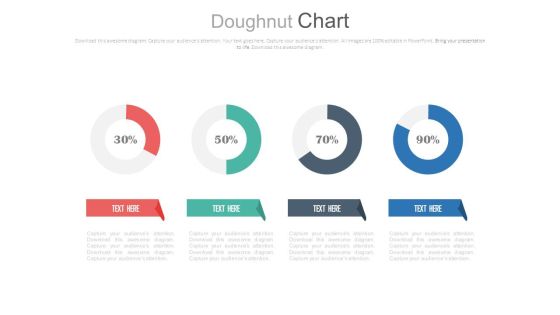
Four Circle Chart With Percentage Ratios Powerpoint Slides
This PowerPoint template has been designed with graphics of four circles and percentage ratios. You may use this dashboard slide design for topics like profit growth and financial planning. This PPT slide is powerful tool to describe your ideas.
