Upsell
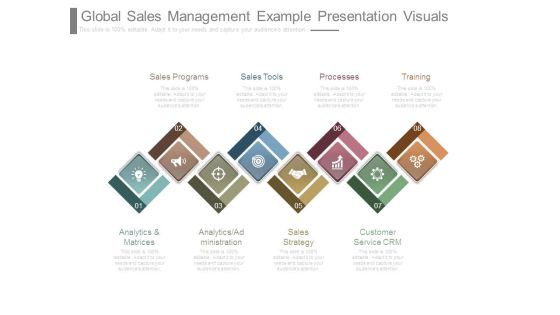
Global Sales Management Example Presentation Visuals
This is a global sales management example presentation visuals. This is a eight stage process. The stages in this process are sales programs, sales tools, processes, training, analytics and matrices, analytics administration, sales strategy, customer service crm.

Improve Sales Efficiency Template Ppt Slide Show
This is a improve sales efficiency template ppt slide show. This is a four stage process. The stages in this process are experience, knowledge, sales capacity, sales productivity, sales people.

Sales Management Services Template Ppt Samples Download
This is a sales management services template ppt samples download. This is a four stage process. The stages in this process are sales strategy, sales analysis, coaching, sales accompaniments.

Sales Metrics And Kpi Examples Presentation Slides
This is a sales metrics and kpi examples presentation slides. This is a five stage process. The stages in this process are sales growth, sales opportunities, product performance, average profit margin, sales target.

Sales Force Structure Ppt PowerPoint Presentation Show
This is a sales force structure ppt powerpoint presentation show. This is a four stage process. The stages in this process are area sales manager, sales officer, zonal sales manager.

Sales Process Management To Boost Business Effectiveness Key Impacts Of Poor Sales Pipeline Management Mockup PDF
This slide shows the impacts of poor pipeline management on the companys operations. Major impacts include growing reporting and administration time, difficulty in sales forecast, decline in opportunity to win ratio etc.This is a Sales Process Management To Boost Business Effectiveness Key Impacts Of Poor Sales Pipeline Management Mockup PDF template with various stages. Focus and dispense information on four stages using this creative set, that comes with editable features. It contains large content boxes to add your information on topics like Growing Reporting, Decline Opportunity, Difficult Forecast. You can also showcase facts, figures, and other relevant content using this PPT layout. Grab it now.

Content Promotion Marketing Sales Funnel Introduce Promotion Plan To Enhance Sales Growth Information PDF
This slide represents content marketing sales funnel. It includes stages such as awareness, evaluation and conversion of target customers.This is a Content Promotion Marketing Sales Funnel Introduce Promotion Plan To Enhance Sales Growth Information PDF template with various stages. Focus and dispense information on three stages using this creative set, that comes with editable features. It contains large content boxes to add your information on topics like Promotion Campaigns, Middle Funnel, Potential Audience. You can also showcase facts, figures, and other relevant content using this PPT layout. Grab it now.

Sales Optimization Best Practices To Close More Deals Daily Reports Analysis Of Various Sales Representatives Sales Introduction PDF
Deliver and pitch your topic in the best possible manner with this sales optimization best practices to close more deals daily reports analysis of various sales representatives sales introduction pdf. Use them to share invaluable insights on opportunities, sales and impress your audience. This template can be altered and modified as per your expectations. So, grab it now.

Tools For Improving Sales Plan Effectiveness Current Length Of Sales Cycle In Absence Of Effective Sales Strategy Formats PDF
This slide shows details about the increasing Sales Cycle Length of the Company in the past 3 years. The reasons for increasing Sales cycle Length are poor lead generation, poor sales process optimization, using cold calling technique most of the times etc. Deliver an awe inspiring pitch with this creative tools for improving sales plan effectiveness current length of sales cycle in absence of effective sales strategy formats pdf bundle. Topics like technique, sales, process, optimization can be discussed with this completely editable template. It is available for immediate download depending on the needs and requirements of the user.
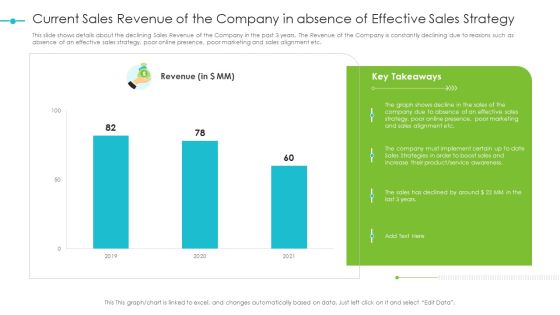
Tools For Improving Sales Plan Effectiveness Current Sales Revenue Of The Company In Absence Of Effective Sales Strategy Download PDF
This slide shows details about the declining Sales Revenue of the Company in the past 3 years. The Revenue of the Company is constantly declining due to reasons such as absence of an effective sales strategy, poor online presence, poor marketing and sales alignment etc. Deliver and pitch your topic in the best possible manner with this tools for improving sales plan effectiveness current sales revenue of the company in absence of effective sales strategy download pdf. Use them to share invaluable insights on marketing, sales, strategy, effective, awareness and impress your audience. This template can be altered and modified as per your expectations. So, grab it now.
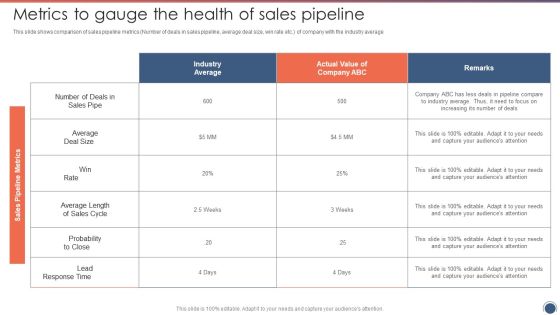
Metrics To Gauge The Health Of Sales Pipeline Sales Funnel Management Strategies To Increase Sales Elements PDF
This slide shows comparison of sales pipeline metrics Number of deals in sales pipeline, average deal size, win rate etc.of company with the industry average.Deliver an awe inspiring pitch with this creative Metrics To Gauge The Health Of Sales Pipeline Sales Funnel Management Strategies To Increase Sales Elements PDF bundle. Topics like Probability Close, Average Length, Average Deal can be discussed with this completely editable template. It is available for immediate download depending on the needs and requirements of the user.
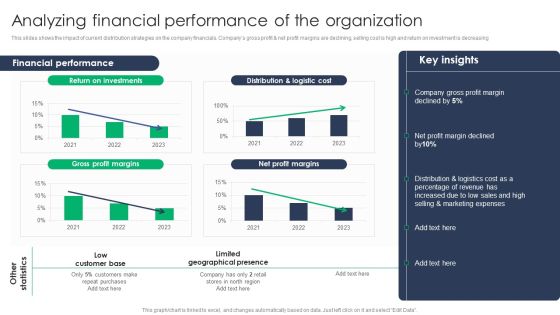
Criterion For Choosing Distribution Channel For Efficient Sales Administration Analyzing Financial Performance Of The Organization Microsoft PDF
This slides shows the impact of current distribution strategies on the company financials. Companys gross profit And net profit margins are declining, selling cost is high and return on investment is decreasing. Find a pre-designed and impeccable Criterion For Choosing Distribution Channel For Efficient Sales Administration Analyzing Financial Performance Of The Organization Microsoft PDF. The templates can ace your presentation without additional effort. You can download these easy-to-edit presentation templates to make your presentation stand out from others. So, what are you waiting for. Download the template from Slidegeeks today and give a unique touch to your presentation.

Manage Sales Performance Diagram Powerpoint Ideas
This is a manage sales performance diagram powerpoint ideas. This is a eight stage process. The stages in this process are sales management, selecting sales team members and stimulating individual talent, developing, training and coaching, sustaining commitment to the organization, manage sales performance, budgets and targets, stimulate and manage change, develop and mange sales strategies, support the sales effort and instill discipline, create manage sales systems, processes and protocols.\n\n

Maximizing Profitability Earning Through Sales Initiatives Estimated Sales Revenue Of The Company After Sales Strategy Implementation Inspiration PDF
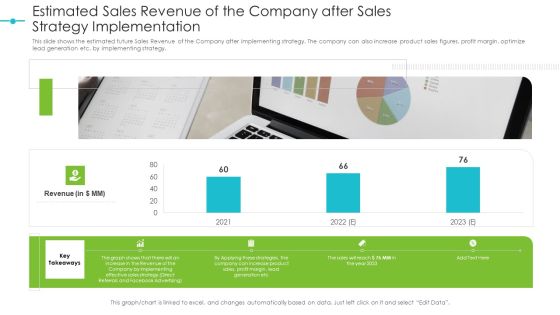
This slide shows the estimated future Sales Revenue of the Company after implementing strategy. The company can also increase product sales figures, profit margin, optimize lead generation etc. by implementing strategy. Deliver an awe inspiring pitch with this creative maximizing profitability earning through sales initiatives estimated sales revenue of the company after sales strategy implementation inspiration pdf bundle. Topics like revenue, 2020 to 2021, product sales, profit margin, strategies can be discussed with this completely editable template. It is available for immediate download depending on the needs and requirements of the user.

Maximizing Profitability Earning Through Sales Initiatives Length Of Sales Cycle After Implementing An Effective Sales Strategy Portrait PDF
This slide shows the estimated future Sales Cycle length of the Company after implementing strategy. Other benefits of using strategy are high lead generation, decreased advertising efforts, improved user engagement rate etc. Deliver and pitch your topic in the best possible manner with this maximizing profitability earning through sales initiatives length of sales cycle after implementing an effective sales strategy portrait pdf Use them to share invaluable insights on sales cycle length, sales strategy, products as implementing and impress your audience. This template can be altered and modified as per your expectations. So, grab it now.
Tools For Improving Sales Plan Effectiveness Estimated Sales Revenue Of The Company After Sales Strategy Implementation Diagrams PDF
This slide shows the estimated future Sales Revenue of the Company after implementing strategy. The company can also increase product sales figures, profit margin, optimize lead generation etc. by implementing strategy. Deliver an awe inspiring pitch with this creative tools for improving sales plan effectiveness estimated sales revenue of the company after sales strategy implementation diagrams pdf bundle. Topics like strategy, implementing, effective, sales, revenue can be discussed with this completely editable template. It is available for immediate download depending on the needs and requirements of the user.

Strategic Plan To Increase Sales Volume And Revenue Estimated Sales Revenue Of The Company After Sales Strategy Implementation Background PDF
This slide shows the estimated future Sales Revenue of the Company after implementing strategy. The company can also increase product sales figures, profit margin, optimize lead generation etc. by implementing strategy. Deliver an awe inspiring pitch with this creative strategic plan to increase sales volume and revenue estimated sales revenue of the company after sales strategy implementation background pdf bundle. Topics like strategy, implementing, effective, sales, revenue can be discussed with this completely editable template. It is available for immediate download depending on the needs and requirements of the user.

Business Growth Globe PowerPoint Template 0510
3d illustration of three up arrows on a flat box chart

Change Answer Transportation PowerPoint Template 0610
Business slogans on a road and street signs sign exit

Growth Business PowerPoint Template 0610
diverse happy business hands growing in success

Market Crisis Finance PowerPoint Template 0610
Market chart with graph and stack of money
Adjusting The Data PowerPoint Icon C
3d illustration of a simple wrench turning/adjusting the elements on a multi-colored bar chart
Adjusting The Data PowerPoint Icon Cc
3d illustration of a simple wrench turning/adjusting the elements on a multi-colored bar chart
Adjusting The Data PowerPoint Icon F
3d illustration of a simple wrench turning/adjusting the elements on a multi-colored bar chart
Adjusting The Data PowerPoint Icon R
3d illustration of a simple wrench turning/adjusting the elements on a multi-colored bar chart
Adjusting The Data PowerPoint Icon S
3d illustration of a simple wrench turning/adjusting the elements on a multi-colored bar chart

Analyzing The Data PowerPoint Icon C
3d illustration of a magnifying glass hovering over a three-dimensional multi-colored bar chart

Analyzing The Data PowerPoint Icon Cc
3d illustration of a magnifying glass hovering over a three-dimensional multi-colored bar chart

Analyzing The Data PowerPoint Icon F
3d illustration of a magnifying glass hovering over a three-dimensional multi-colored bar chart

Analyzing The Data PowerPoint Icon R
3d illustration of a magnifying glass hovering over a three-dimensional multi-colored bar chart

Analyzing The Data PowerPoint Icon S
3d illustration of a magnifying glass hovering over a three-dimensional multi-colored bar chart

Up Arrows Business PowerPoint Template 0610
Six red arrows pointing upward on a grid
Business Data Graph PowerPoint Icon C
Increasing Bar Chart - Business Data Graph With World Map
Business Data Graph PowerPoint Icon Cc
Increasing Bar Chart - Business Data Graph With World Map
Business Data Graph PowerPoint Icon S
Increasing Bar Chart - Business Data Graph With World Map
Business Diagram PowerPoint Icon C
business diagram it is isolated on a white background
Business Diagram PowerPoint Icon Cc
business diagram it is isolated on a white background
Business Diagram PowerPoint Icon S
business diagram it is isolated on a white background
Bar Arrow Chart PowerPoint Icon C
business bar chart with arrows isolated on a white background.
Bar Arrow Chart PowerPoint Icon Cc
business bar chart with arrows isolated on a white background.
Bar Arrow Chart PowerPoint Icon S
business bar chart with arrows isolated on a white background.
Bar Graph PowerPoint Icon C
3D style of a vector bar graph .
Bar Graph PowerPoint Icon Cc
3D style of a vector bar graph .
Bar Graph PowerPoint Icon S
3D style of a vector bar graph .

Bar Graph Business PowerPoint Template 0810
3d illustration of growing graph and arrow

Graph Chart Business PowerPoint Template 0810
illustration composed by charts word map and globe

Graph Success PowerPoint Template 0810
business success concept computer generated illustration for special design

Planning Business PowerPoint Template 0810
business woman drawing a business plan isolated over a white background

Graph Business PowerPoint Template 0910
Business 3d graph multi colored with spiral arrows around bars.

Bar Chart Business PowerPoint Template 0810
3D illustration of a colorful multi-segment bar chart over top of a light blue textured background with plenty of open space for your text

Graph 2011 Business PowerPoint Template 0810
2010 2011 Business graph with world background. Vector File also available

Arrow Business PowerPoint Template 0910
Results improvement: two arrows pointing up. Digital illustration.

Marketing And Strategy Business PowerPoint Template 0910
Business slogans on a road and street signs

Bus Chart Business PowerPoint Template 1010
Business strategy organizational charts and graphs for success

Business Chart Globe PowerPoint Template 1010
illustration composed by charts word map and globe

Business Data Business PowerPoint Template 1010
illustration of data against bar and world mapbackground

Accessing The Data Security PowerPoint Template 1010
3d illustration of a large brass key and lock protruding from a simple pie chart

Target Achieved Business PowerPoint Template 1110
3d rendering of the arrow and target

Dollar Sign Finance PowerPoint Background And Template 1210
Microsoft PowerPoint Template and Background with Three-dimensional graphic representation. High quality and technics of execution. Dollar.3d
Euro Money Graph Business PowerPoint Background And Template 1210
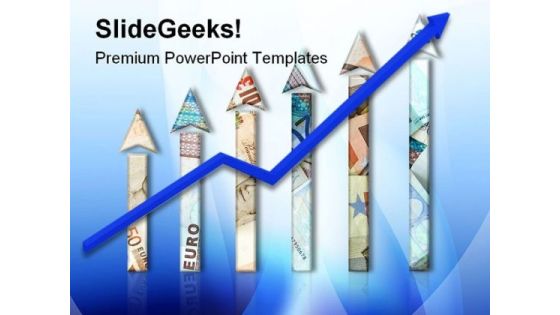
Microsoft PowerPoint Template and Background with Money growth chart
 Home
Home