Two Year Roadmap
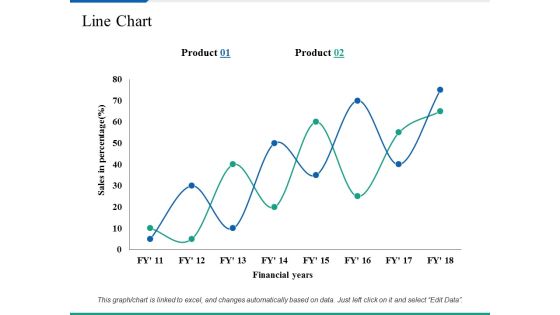
Line Chart Ppt PowerPoint Presentation Summary Clipart Images
This is a line chart ppt powerpoint presentation summary clipart images. This is a two stage process. The stages in this process are business, marketing, sales in percentage, financial years, strategy.

Bar Graph Ppt PowerPoint Presentation Styles Skills
This is a bar graph ppt powerpoint presentation styles skills. This is a two stage process. The stages in this process are bar graph, product, in year, in percentage, business.

Conversion Rate Template 1 Ppt PowerPoint Presentation Visual Aids Files
This is a conversion rate template 1 ppt powerpoint presentation visual aids files. This is a two stage process. The stages in this process are net revenue gross revenue from last year.

Clustered Column Ppt PowerPoint Presentation Icon Design Inspiration
This is a clustered column ppt powerpoint presentation icon design inspiration. This is a two stage process. The stages in this process are product, financial year, sales in percentage, clustered column.
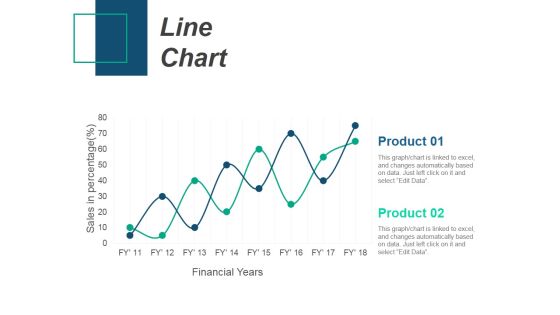
Line Chart Ppt PowerPoint Presentation Infographic Template Introduction
This is a line chart ppt powerpoint presentation infographic template introduction. This is a two stage process. The stages in this process are product, sales in percentage, financial years, line chart.
Line Chart Ppt PowerPoint Presentation Infographic Template Icons
This is a line chart ppt powerpoint presentation infographic template icons. This is a two stage process. The stages in this process are sales in percentage, financial years, product, line chart.

Line Chart Ppt PowerPoint Presentation Professional Smartart
This is a line chart ppt powerpoint presentation professional smartart. This is a two stage process. The stages in this process are in percentage, in years, product, finance, business.

Market Opportunity Cost Ppt PowerPoint Presentation Example 2015
This is a market opportunity cost ppt powerpoint presentation example 2015. This is a two stage process. The stages in this process are today, year, time planning, dollar, symbol.

Brand Performance Dashboard Ppt PowerPoint Presentation Gallery
This is a brand performance dashboard ppt powerpoint presentation gallery. This is a two stage process. The stages in this process are intensity by state last hour, emerging topics, new customer, later this year, film.

Line Chart Ppt PowerPoint Presentation Model Design Templates
This is a line chart ppt powerpoint presentation model design templates. This is a two stage process. The stages in this process are sales in percentage, financial years, product.

Area Chart Ppt PowerPoint Presentation Show Layout Ideas
This is a area chart ppt powerpoint presentation show layout ideas. This is a two stage process. The stages in this process are product, in percentage, financial year, growth.

Area Chart Ppt PowerPoint Presentation Professional Designs
This is a area chart ppt powerpoint presentation professional designs. This is a two stage process. The stages in this process are in percentage, product, in years, strategy, business, marketing.

Line Chart Ppt PowerPoint Presentation Layouts Professional
This is a line chart ppt powerpoint presentation layouts professional. This is a two stage process. The stages in this process are in percentage, product, in years, strategy, marketing, business.
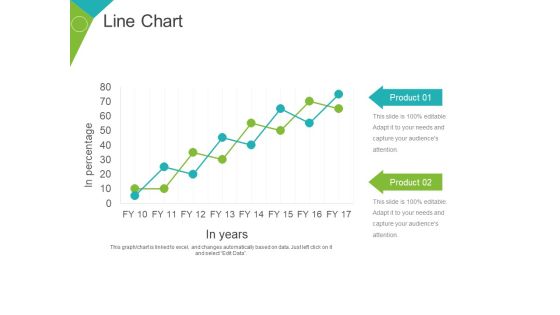
Line Chart Ppt PowerPoint Presentation Gallery Objects
This is a line chart ppt powerpoint presentation gallery objects. This is a two stage process. The stages in this process are product, business, marketing, growth, in years, in percentage.

Area Chart Ppt PowerPoint Presentation Gallery Icons
This is a area chart ppt powerpoint presentation gallery icons. This is a two stage process. The stages in this process are financial year, sales in percentage, product, finance, graph.
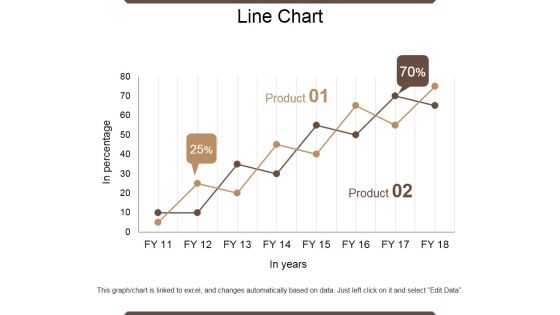
Line Chart Ppt PowerPoint Presentation Outline Infographic Template
This is a line chart ppt powerpoint presentation outline infographic template. This is a two stage process. The stages in this process are in percentage, product, in year, growth, success.

Area Chart Ppt PowerPoint Presentation Pictures Files
This is a area chart ppt powerpoint presentation pictures files. This is a two stage process. The stages in this process are product, sales, in percentage, financial year, business.

Area Chart Ppt PowerPoint Presentation Layouts Vector
This is a area chart ppt powerpoint presentation layouts vector. This is a two stage process. The stages in this process are area chart, product, sales in percentage, financial year.
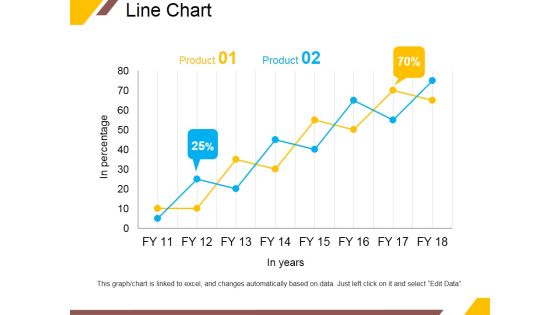
Line Chart Ppt PowerPoint Presentation Portfolio Infographic Template
This is a line chart ppt powerpoint presentation portfolio infographic template. This is a two stage process. The stages in this process are product, in years, business, percentage, growth.

Area Chart Ppt PowerPoint Presentation File Graphic Tips
This is a area chart ppt powerpoint presentation file graphic tips. This is a two stage process. The stages in this process are product, in percentage, financial year, business, growth.
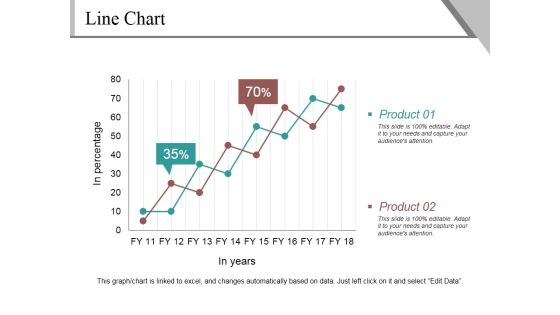
Line Chart Ppt PowerPoint Presentation Infographics Example
This is a line chart ppt powerpoint presentation infographics example. This is a two stage process. The stages in this process are product, in percentage, in years, finance, growth.

Line Chart Ppt PowerPoint Presentation Portfolio Design Templates
This is a line chart ppt powerpoint presentation portfolio design templates. This is a two stage process. The stages in this process are in percentage, in years, percentage, business, graph.
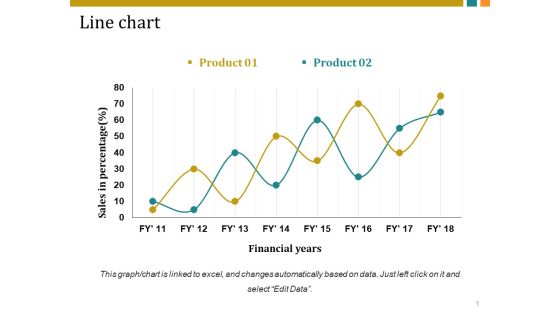
Line Chart Ppt PowerPoint Presentation Inspiration Vector
This is a line chart ppt powerpoint presentation inspiration vector. This is a two stage process. The stages in this process are sales in percentage, financial years, business, marketing, growth.

Line Chart Ppt PowerPoint Presentation Infographics Graphic Images
This is a line chart ppt powerpoint presentation infographics graphic images. This is a two stage process. The stages in this process are sales in percentage, financial years, growth, business, marketing.

Column Chart Ppt PowerPoint Presentation Gallery Graphics Example
This is a column chart ppt powerpoint presentation gallery graphics example. This is a two stage process. The stages in this process are expenditure in, years, business, marketing, growth.

Column Chart Ppt PowerPoint Presentation Gallery Background
This is a column chart ppt powerpoint presentation gallery background. This is a two stage process. The stages in this process are product, sales in percentage, financial year, graph, success.

Line Chart Ppt PowerPoint Presentation Professional Graphics Design
This is a line chart ppt powerpoint presentation professional graphics design. This is a two stage process. The stages in this process are financial years, sales in percentage, product, growth, success.

Line Chart Ppt PowerPoint Presentation Pictures Templates
This is a line chart ppt powerpoint presentation pictures templates. This is a two stage process. The stages in this process are sales in percentage, financial years, business, marketing, growth.
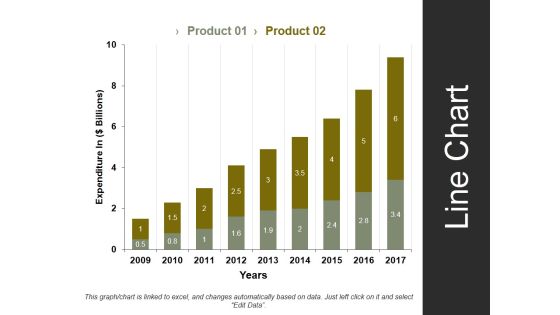
Line Chart Template 1 Ppt PowerPoint Presentation Styles Summary
This is a line chart template 1 ppt powerpoint presentation styles summary. This is a two stage process. The stages in this process are expenditure in, years, business, marketing, strategy.

Line Chart Ppt PowerPoint Presentation Infographics Infographics
This is a line chart ppt powerpoint presentation infographics infographics. This is a two stage process. The stages in this process are product, sales in percentage, financial year, line chart, finance.

Column Chart Ppt PowerPoint Presentation Model Graphics Download
This is a column chart ppt powerpoint presentation model graphics download. This is a two stage process. The stages in this process are product, financial year, sales in percentage, bar graph, success.

Line Chart Ppt PowerPoint Presentation Layouts Example
This is a line chart ppt powerpoint presentation layouts example. This is a two stage process. The stages in this process are sales in percentage, product, financial years, growth, success.

Line Chart Ppt PowerPoint Presentation File Example File
This is a line chart ppt powerpoint presentation file example file. This is a two stage process. The stages in this process are product, in percentage, in years, growth, success.

Column Chart Ppt PowerPoint Presentation Infographics Deck
This is a column chart ppt powerpoint presentation infographics deck. This is a two stage process. The stages in this process are product, expenditure in, years, bar graph, growth.
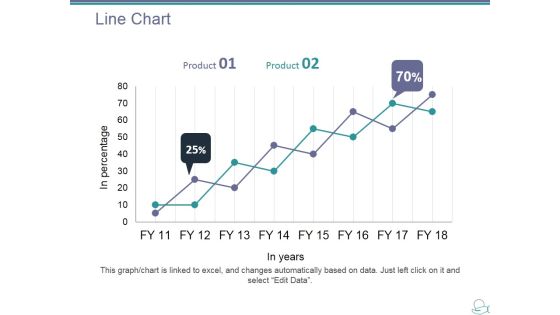
Line Chart Ppt PowerPoint Presentation Layouts Show
This is a line chart ppt powerpoint presentation layouts show. This is a two stage process. The stages in this process are product, in years, in percentage, line chart, growth.
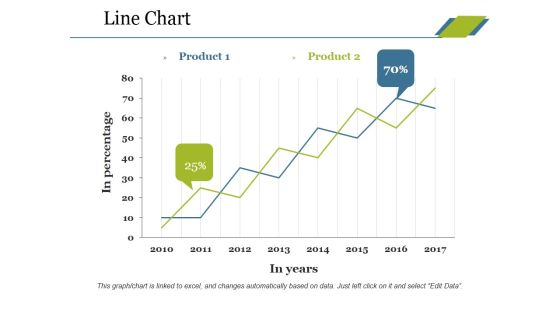
Line Chart Ppt PowerPoint Presentation Professional Tips
This is a line chart ppt powerpoint presentation professional tips. This is a two stage process. The stages in this process are product, in percentage, in years, growth, success.
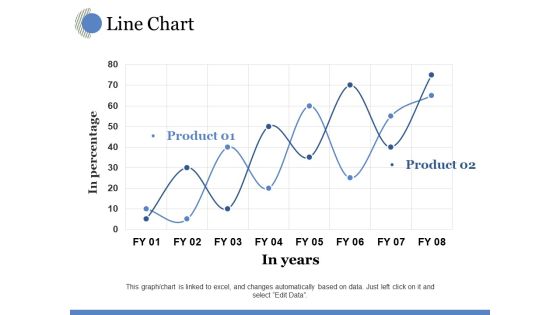
Line Chart Ppt PowerPoint Presentation Model Visual Aids
This is a line chart ppt powerpoint presentation model visual aids. This is a two stage process. The stages in this process are in years, in percentage, growth, business, marketing.

Line Chart Ppt PowerPoint Presentation Slides Ideas
This is a line chart ppt powerpoint presentation slides ideas. This is a two stage process. The stages in this process are product, in percentage, in years, growth, success.

Column Chart Ppt PowerPoint Presentation Portfolio Slide Download
This is a column chart ppt powerpoint presentation portfolio slide download. This is a two stage process. The stages in this process are product, year, bar graph, success, business.

Line Chart Ppt PowerPoint Presentation Show Guide
This is a line chart ppt powerpoint presentation show guide. This is a two stage process. The stages in this process are product, sales in percentage, financial years, growth, success.
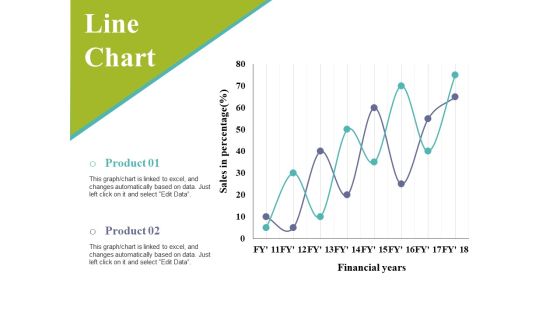
Line Chart Ppt PowerPoint Presentation Infographic Template Slides
This is a line chart ppt powerpoint presentation infographic template slides. This is a two stage process. The stages in this process are sales in percentage, financial years, business, marketing, graph.
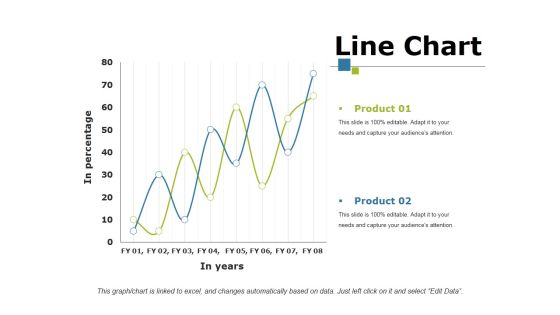
Line Chart Ppt PowerPoint Presentation Portfolio Mockup
This is a line chart ppt powerpoint presentation portfolio mockup. This is a two stage process. The stages in this process are product, in percentage, in year, growth, success.

Column Chart Ppt PowerPoint Presentation Layouts Graphics Example
This is a column chart ppt powerpoint presentation layouts graphics example. This is a two stage process. The stages in this process are product, year, bar graph, business, finance.
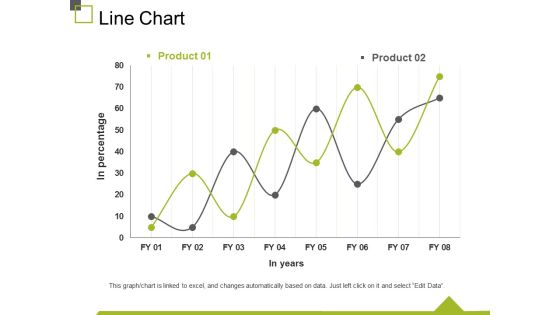
Line Chart Ppt PowerPoint Presentation Infographics Display
This is a line chart ppt powerpoint presentation infographics display. This is a two stage process. The stages in this process are in percentage, in years, chart, business, marketing.

Line Chart Ppt PowerPoint Presentation Styles Themes
This is a line chart ppt powerpoint presentation styles themes. This is a two stage process. The stages in this process are business, marketing, financial years, sales in percentage.

Column Chart Ppt PowerPoint Presentation Gallery Slide Portrait
This is a column chart ppt powerpoint presentation gallery slide portrait. This is a two stage process. The stages in this process are sales in percentage, financial year, product, bar graph, growth.

Line Chart Ppt PowerPoint Presentation Gallery Templates
This is a line chart ppt powerpoint presentation gallery templates. This is a two stage process. The stages in this process are product, financial years, sales in percentage, line chart.

Column Chart Ppt PowerPoint Presentation Styles Graphics Design
This is a column chart ppt powerpoint presentation styles graphics design. This is a two stage process. The stages in this process are expenditure in, product, years, growth, success.

Column Chart Ppt PowerPoint Presentation File Summary
This is a column chart ppt powerpoint presentation file summary. This is a two stage process. The stages in this process are product, dollars, in years, bar graph, growth.

Column Chart Ppt PowerPoint Presentation Ideas Vector
This is a column chart ppt powerpoint presentation ideas vector. This is a two stage process. The stages in this process are column chart, product, financial years, sales in percentage, growth.

Column Chart Ppt PowerPoint Presentation Pictures Graphic Images
This is a column chart ppt powerpoint presentation pictures graphic images. This is a two stage process. The stages in this process are product, years, growth, success, bar graph.

Line Chart Ppt PowerPoint Presentation Slides Mockup
This is a line chart ppt powerpoint presentation slides mockup. This is a two stage process. The stages in this process are in percentage, in years, product, growth, success.

Column Chart Ppt PowerPoint Presentation Infographics Guidelines
This is a column chart ppt powerpoint presentation infographics guidelines. This is a two stage process. The stages in this process are product, expenditure in, years, business, bar graph.
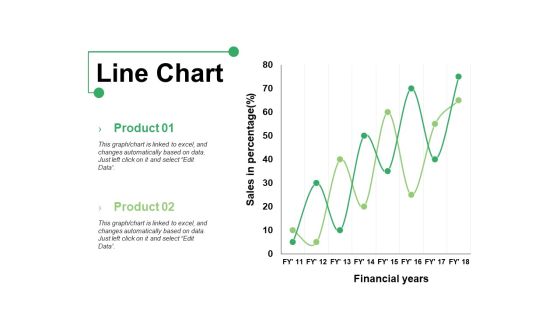
Line Chart Ppt PowerPoint Presentation Show Graphics Example
This is a line chart ppt powerpoint presentation show graphics example. This is a two stage process. The stages in this process are product, line chart, financial years, sales in percentage.

Bar Chart Ppt PowerPoint Presentation Infographics Format Ideas
This is a bar chart ppt powerpoint presentation infographics format ideas. This is a two stage process. The stages in this process are bar graph, product, financial year, sales in percentage.

Line Chart Ppt PowerPoint Presentation Professional Grid
This is a line chart ppt powerpoint presentation professional grid. This is a two stage process. The stages in this process are sales in percentage, financial years, product, line chart.
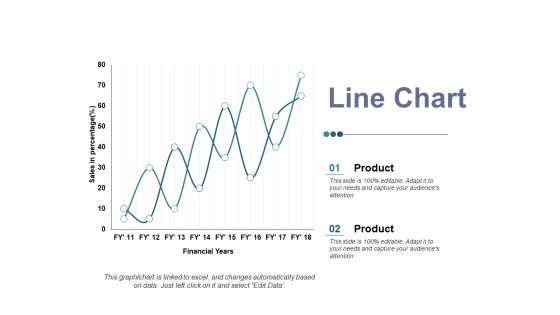
Line Chart Ppt PowerPoint Presentation Ideas Elements
This is a line chart ppt powerpoint presentation ideas elements. This is a two stage process. The stages in this process are product, sales in percentage, financial year, business, line chart.

Line Chart Ppt PowerPoint Presentation Infographic Template Master Slide
This is a line chart ppt powerpoint presentation infographic template master slide. This is a two stage process. The stages in this process are product, financial years, sales in percentage.
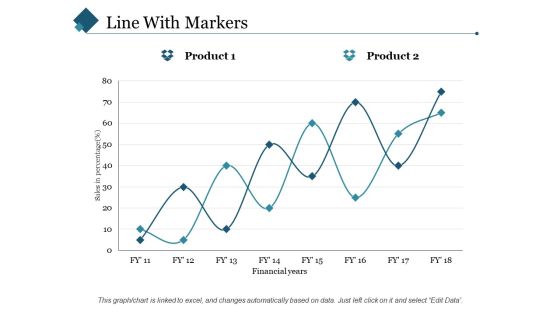
Line With Markers Ppt PowerPoint Presentation Styles Slide Portrait
This is a line with markers ppt powerpoint presentation styles slide portrait. This is a two stage process. The stages in this process are sales in percentage, financial years, product.

Area Chart Ppt PowerPoint Presentation Icon Summary
This is a area chart ppt powerpoint presentation icon summary. This is a two stage process. The stages in this process are financial year, area chart, in percentage, product.
 Home
Home