Two Year Roadmap
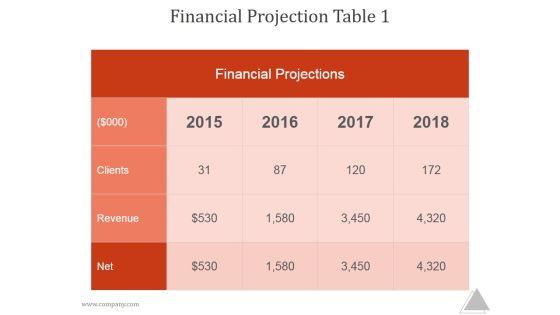
Financial Projection Table 1 Ppt PowerPoint Presentation Ideas
This is a financial projection table 1 ppt powerpoint presentation ideas. This is a four stage process. The stages in this process are client, revenue, net, financial projection.

Feasible Set Of Portfolio Ppt Slides
This is a feasible set of portfolio ppt slides. This is a one stage process. The stages in this process are success, business, time Planning.
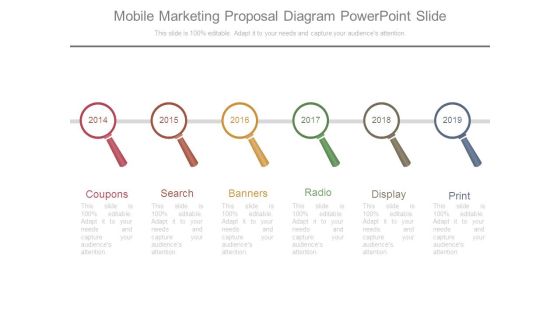
Mobile Marketing Proposal Diagram Powerpoint Slide
This is a mobile marketing proposal diagram powerpoint slide. This is a six stage process. The stages in this process are coupons, search, banners, radio, display, print.

New Future Plans Powerpoint Slides
This is a new future plans powerpoint slides. This is a six stage process. The stages in this process are business, marketing, goal, target, success.

Corporate Profile IT Organization Companys Long Term Financials Goals Elements PDF
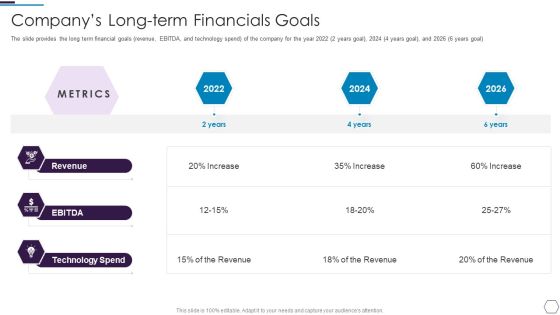
The slide provides the long term financial goals revenue, EBITDA, and technology spend of the company for the year 2022 2 years goal, 2024 4 years goal, and 2026 6 years goal. Deliver and pitch your topic in the best possible manner with this corporate profile it organization companys long term financials goals elements pdf. Use them to share invaluable insights on revenue, ebitda, technology spend and impress your audience. This template can be altered and modified as per your expectations. So, grab it now.
Information Technology Firm Report Example Companys Long Term Financials Goals Diagrams PDF
The slide provides the long term financial goals revenue, EBITDA, and technology spend of the company for the year 2022 2 years goal, 2024 4 years goal, and 2026 6 years goal. This is a Information Technology Firm Report Example Companys Long Term Financials Goals Diagrams PDF template with various stages. Focus and dispense information on four stages using this creative set, that comes with editable features. It contains large content boxes to add your information on topics like Revenue, Technology Spend, Increase You can also showcase facts, figures, and other relevant content using this PPT layout. Grab it now.

Business Overview Of An Information Technology Company Companys Long Term Financials Goals Guidelines PDF
The slide provides the long term financial goals revenue, EBITDA, and technology spend of the company for the year 2022 2 years goal, 2024 4 years goal, and 2026 6 years goal Deliver an awe inspiring pitch with this creative Business Overview Of An Information Technology Company Companys Long Term Financials Goals Guidelines PDF bundle. Topics like Technology Spend, Revenue, Increase can be discussed with this completely editable template. It is available for immediate download depending on the needs and requirements of the user.

Stock Photo Blue Win And Red Lose Switches PowerPoint Slide
This is a conceptual power point image slide. This image slide contains the graphic of two switches which are showing the two concepts; one is win and other is lose. Use this dual concept image slide in your business presentations and display two concepts in a single slide.

Column Chart Ppt PowerPoint Presentation Infographics Portrait
This is a column chart ppt powerpoint presentation infographics portrait. This is a two stage process. The stages in this process are product, year, time planning, business, step.

Comparison Ppt PowerPoint Presentation Guide
This is a comparison ppt powerpoint presentation guide. This is a two stage process. The stages in this process are business, marketing, year, finance, percentage.

Comparison Ppt PowerPoint Presentation Pictures Objects
This is a comparison ppt powerpoint presentation pictures objects. This is a two stage process. The stages in this process are comparison, percentage, year, business, marketing.

Comparison Ppt PowerPoint Presentation Gallery Slides
This is a comparison ppt powerpoint presentation gallery slides. This is a two stage process. The stages in this process are comparison, percentage, year, business.

Comparison Ppt PowerPoint Presentation Styles Graphics Example
This is a comparison ppt powerpoint presentation styles graphics example. This is a two stage process. The stages in this process are year, comparison, technology, mobile, million.

Comparison Ppt PowerPoint Presentation File Visual Aids
This is a comparison ppt powerpoint presentation file visual aids. This is a two stage process. The stages in this process are comparison, years, percentage, business, marketing.

Comparison Ppt PowerPoint Presentation File Graphics Template
This is a comparison ppt powerpoint presentation file graphics template. This is a two stage process. The stages in this process are comparison, years, business, marketing, strategy, percentage.

Comparison Ppt PowerPoint Presentation Infographics Templates
This is a comparison ppt powerpoint presentation infographics templates. This is a two stage process. The stages in this process are business, comparison, years, marketing, planning.

Comparison Ppt PowerPoint Presentation Gallery Topics
This is a comparison ppt powerpoint presentation gallery topics. This is a two stage process. The stages in this process are comparison, finance, year, business, marketing.

Comparison Ppt PowerPoint Presentation Layouts Example
This is a comparison ppt powerpoint presentation layouts example. This is a two stage process. The stages in this process are sales, year, success, growth, business.

Comparison Ppt PowerPoint Presentation Outline Guidelines
This is a comparison ppt powerpoint presentation outline guidelines. This is a two stage process. The stages in this process are male, years, business, female, marketing.
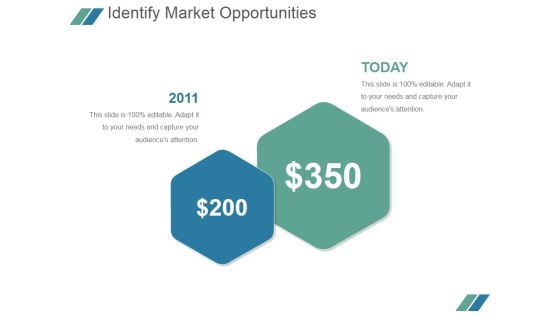
Identify Market Opportunities Ppt PowerPoint Presentation Guidelines
This is a identify market opportunities ppt powerpoint presentation guidelines. This is a two stage process. The stages in this process are year, finance, dollar, market, growth.

Column Chart Ppt PowerPoint Presentation Show Visuals
This is a column chart ppt powerpoint presentation show visuals. This is a two stage process. The stages in this process are product, year, success, step, business.

Real Estate Sales Growth Ppt PowerPoint Presentation Infographics Skills
This is a real estate sales growth ppt powerpoint presentation infographics skills. This is a two stage process. The stages in this process are growth, year, marketing, business.

Area Chart Ppt PowerPoint Presentation Show Backgrounds
This is a area chart ppt powerpoint presentation show backgrounds. This is a two stage process. The stages in this process are financial year, product, in percentage.

Bar Chart Ppt PowerPoint Presentation Portfolio Inspiration
This is a bar chart ppt powerpoint presentation portfolio inspiration. This is a two stage process. The stages in this process are product, in percentage, in years.

Portfolio Revision And Evaluation Powerpoint Themes
This is a portfolio revision and evaluation powerpoint themes. This is a two stage process. The stages in this process are business, management, year, marketing, finance.

Area Stacked Ppt PowerPoint Presentation Show Mockup
This is a area stacked ppt powerpoint presentation show mockup. This is a two stage process. The stages in this process are area stacked, product, percentage, year, finance.
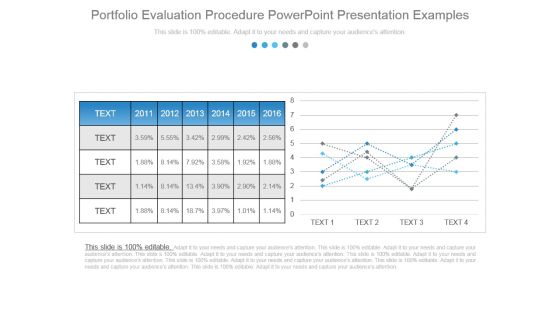
Portfolio Evaluation Procedure Powerpoint Presentation Examples
This is a portfolio evaluation procedure powerpoint presentation examples. This is a two stage process. The stages in this process are year, business, marketing, percentage, table.
Stacked Area With Markers Ppt PowerPoint Presentation Icon
This is a stacked area with markers ppt powerpoint presentation icon. This is a two stage process. The stages in this process are business, growth, success, marketing, year.

Area Chart Ppt PowerPoint Presentation Summary Deck
This is a area chart ppt powerpoint presentation summary deck. This is a two stage process. The stages in this process are sales in percentage, financial year.

Product Wise Performance Ppt PowerPoint Presentation Show Themes
This is a product wise performance ppt powerpoint presentation show themes. This is a two stage process. The stages in this process are year, percentage, finance, business, marketing.

Column Chart Ppt PowerPoint Presentation Infographic Template Inspiration
This is a column chart ppt powerpoint presentation infographic template inspiration. This is a two stage process. The stages in this process are bar, years, business, marketing, success.

Capital Spending Ppt PowerPoint Presentation Portfolio Styles
This is a capital spending ppt powerpoint presentation portfolio styles. This is a two stage process. The stages in this process are business, finance, percentage, year, marketing.
Sales Forecast Ppt PowerPoint Presentation Icon Slide
This is a sales forecast ppt powerpoint presentation icon slide. This is a two stage process. The stages in this process are sales, forecast, year, business, marketing, finance.

Column Chart Ppt PowerPoint Presentation Inspiration Deck
This is a column chart ppt powerpoint presentation inspiration deck. This is a two stage process. The stages in this process are years, business, marketing, graph, finance, product.

Column Chart Ppt PowerPoint Presentation Outline Themes
This is a column chart ppt powerpoint presentation outline themes. This is a two stage process. The stages in this process are years, business, graph, marketing, finance.

Column Chart Ppt PowerPoint Presentation Gallery Styles
This is a column chart ppt powerpoint presentation gallery styles. This is a two stage process. The stages in this process are years, graph, business, marketing, finance.
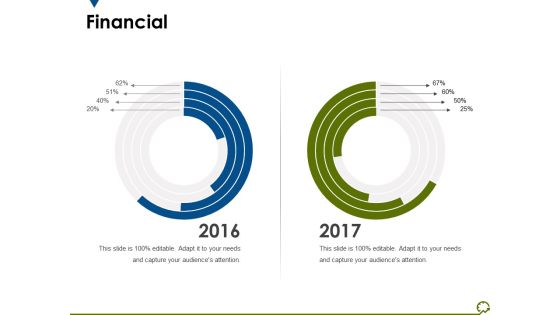
Financial Ppt PowerPoint Presentation Infographic Template Demonstration
This is a financial ppt powerpoint presentation infographic template demonstration. This is a two stage process. The stages in this process are finance, years, business, marketing, percentage.
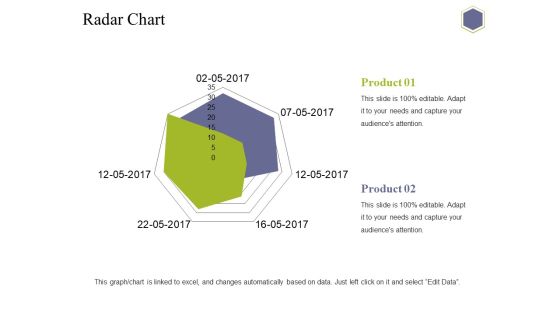
Radar Chart Ppt PowerPoint Presentation Professional Demonstration
This is a radar chart ppt powerpoint presentation professional demonstration. This is a two stage process. The stages in this process are chart, finance, business, marketing, years.

Area Chart Ppt PowerPoint Presentation Ideas Tips
This is a area chart ppt powerpoint presentation ideas tips. This is a two stage process. The stages in this process are in percentage, financial, year, business, marketing.

Bar Graph Ppt PowerPoint Presentation Model Vector
This is a bar graph ppt powerpoint presentation model vector. This is a two stage process. The stages in this process are graph, financial, year, business, marketing.

Column Chart Ppt PowerPoint Presentation Summary Slides
This is a column chart ppt powerpoint presentation summary slides. This is a two stage process. The stages in this process are finance, marketing, business, graph, years.

Column Chart Ppt PowerPoint Presentation Summary Deck
This is a column chart ppt powerpoint presentation summary deck. This is a two stage process. The stages in this process are expenditure in, years, business, marketing, graph.

Column Chart Ppt PowerPoint Presentation File Inspiration
This is a column chart ppt powerpoint presentation file inspiration. This is a two stage process. The stages in this process are business, marketing, years, expenditure in, graph.

Column Chart Ppt PowerPoint Presentation Show Example
This is a column chart ppt powerpoint presentation show example. This is a two stage process. The stages in this process are business, marketing, expenditure in, finance, years.

Column Chart Ppt PowerPoint Presentation Outline Deck
This is a column chart ppt powerpoint presentation outline deck. This is a two stage process. The stages in this process are business, marketing, expenditure in, years, graph.

Column Chart Ppt PowerPoint Presentation Ideas Deck
This is a column chart ppt powerpoint presentation ideas deck. This is a two stage process. The stages in this process are business, marketing, dollars, in years, graph.

Column Chart Ppt PowerPoint Presentation Ideas Graphics
This is a column chart ppt powerpoint presentation ideas graphics. This is a two stage process. The stages in this process are business, chart, years, marketing, finance.

Bar Chart Ppt PowerPoint Presentation Gallery Demonstration
This is a bar chart ppt powerpoint presentation gallery demonstration. This is a two stage process. The stages in this process are business, bar chart, years, marketing, finance.
Radar Chart Ppt PowerPoint Presentation Icon Format
This is a radar chart ppt powerpoint presentation icon format. This is a two stage process. The stages in this process are business, radar chart, finance, strategy, years.

Column Chart Ppt PowerPoint Presentation Inspiration Picture
This is a column chart ppt powerpoint presentation inspiration picture. This is a two stage process. The stages in this process are business, marketing, years, expenditure in, chart.
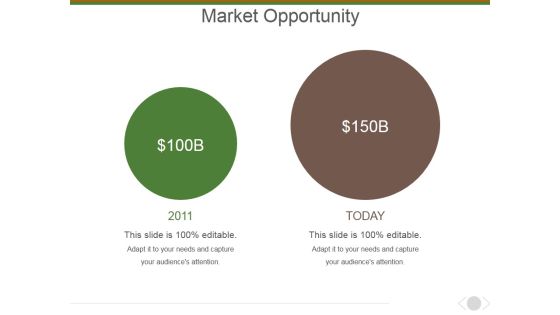
Market Opportunity Ppt PowerPoint Presentation Layouts Background Image
This is a market opportunity ppt powerpoint presentation layouts background image. This is a two stage process. The stages in this process are market, business, circular, year, plan.

Market Opportunity Analysis Ppt PowerPoint Presentation Templates
This is a market opportunity analysis ppt powerpoint presentation templates. This is a two stage process. The stages in this process are today, business, marketing, year, financial.
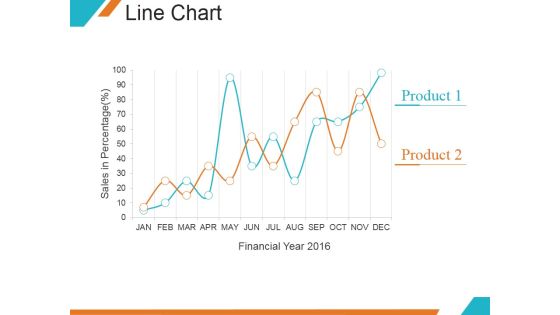
Line Chart Ppt PowerPoint Presentation Samples
This is a line chart ppt powerpoint presentation samples. This is a two stage process. The stages in this process are financial year, product, growth, marketing.

Area Chart Ppt PowerPoint Presentation Summary Example
This is a area chart ppt powerpoint presentation summary example. This is a two stage process. The stages in this process are financial year, in percentage, product.

Area Stacked Ppt PowerPoint Presentation Infographics Designs Download
This is a area stacked ppt powerpoint presentation infographics designs download. This is a two stage process. The stages in this process are years, growth, success, business, marketing.

Line Chart Ppt PowerPoint Presentation Layouts Background Image
This is a line chart ppt powerpoint presentation layouts background image. This is a two stage process. The stages in this process are in percentage, in years, product.

Area Chart Ppt Powerpoint Presentation Ideas Templates
This is a area chart ppt powerpoint presentation ideas templates. This is a two stage process. The stages in this process are product, financial year, in percentage, graph.

Line Chart Ppt PowerPoint Presentation Pictures Maker
This is a line chart ppt powerpoint presentation pictures maker. This is a two stage process. The stages in this process are financial years, product, growth, success.

Column Chart Ppt PowerPoint Presentation Infographics Model
This is a column chart ppt powerpoint presentation infographics model. This is a two stage process. The stages in this process are bar graph, growth, product, percentage, year.

Column Chart Ppt PowerPoint Presentation Model Visuals
This is a column chart ppt powerpoint presentation model visuals. This is a two stage process. The stages in this process are product, year, graph, business, finance.

 Home
Home