Two Sections

Clustered Bar Ppt PowerPoint Presentation Summary Design Inspiration
This is a clustered bar ppt powerpoint presentation summary design inspiration. This is a two stage process. The stages in this process are product, clustered bar, profit, business, marketing.
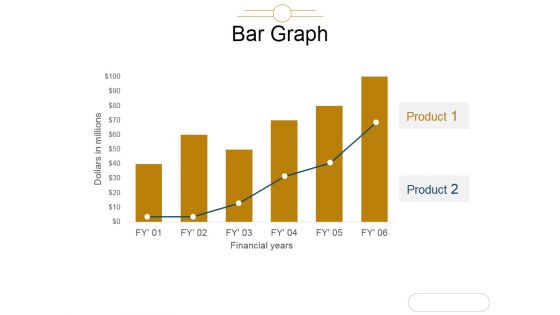
Bar Graph Ppt PowerPoint Presentation Model Graphic Tips
This is a bar graph ppt powerpoint presentation model graphic tips. This is a two stage process. The stages in this process are we are dollars in millions, financials years, bar graph, product, business.
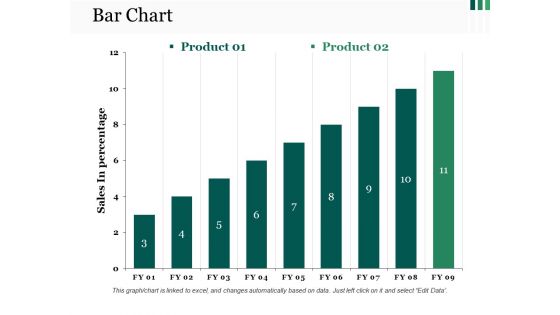
Bar Chart Ppt PowerPoint Presentation Show Format Ideas
This is a bar chart ppt powerpoint presentation show format ideas. This is a two stage process. The stages in this process are bar graph, growth, success, business, marketing.

Stacked Bar Chart Ppt PowerPoint Presentation Infographics Elements
This is a stacked bar chart ppt powerpoint presentation infographics elements. This is a two stage process. The stages in this process are stacked bar chart, product, unit count, in year.
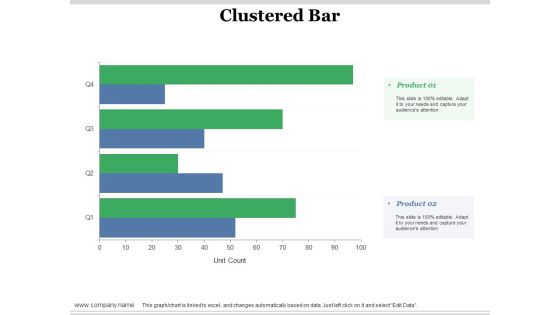
Clustered Bar Ppt PowerPoint Presentation Slides Example Topics
This is a clustered bar ppt powerpoint presentation slides example topics. This is a two stage process. The stages in this process are clustered bar, product, unit count, business, marketing.

x bar and r chart ppt powerpoint presentation portfolio elements
This is a x bar and r chart ppt powerpoint presentation portfolio elements. This is a two stage process. The stages in this process are finance, business, marketing, growth.
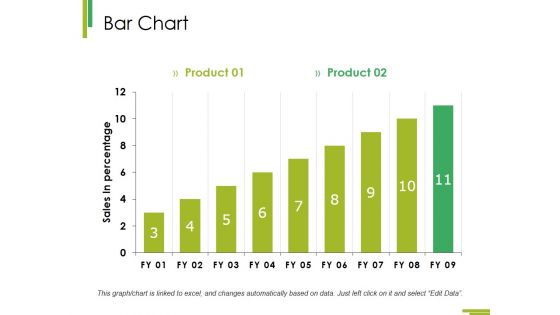
Bar Chart Ppt PowerPoint Presentation Infographic Template Master Slide
This is a bar chart ppt powerpoint presentation infographic template master slide. This is a two stage process. The stages in this process are growth, finance, business, analysis, marketing.

Bar Graph Ppt PowerPoint Presentation Gallery Example File
This is a bar graph ppt powerpoint presentation gallery example file. This is a two stage process. The stages in this process are column, bar graph, business, marketing, management.
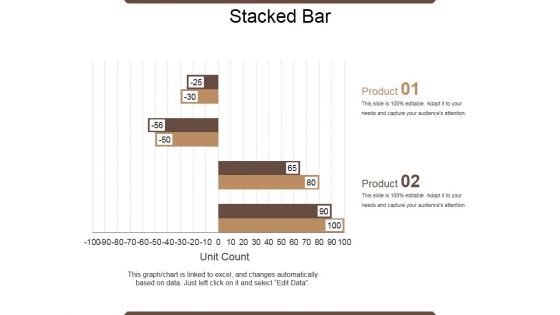
Stacked Bar Template 1 Ppt PowerPoint Presentation Layouts Templates
This is a stacked bar template 1 ppt powerpoint presentation layouts templates. This is a two stage process. The stages in this process are product, unit count, business, marketing.

Stacked Bar Template 1 Ppt PowerPoint Presentation Ideas Design Templates
This is a stacked bar template 1 ppt powerpoint presentation ideas design templates. This is a two stage process. The stages in this process are product, finance, percentage, business, marketing.
Clustered Bar Chart Finance Ppt PowerPoint Presentation Icon Tips
This is a clustered bar chart finance ppt powerpoint presentation icon tips. This is a two stage process. The stages in this process are analysis, finance, marketing, management, investment.
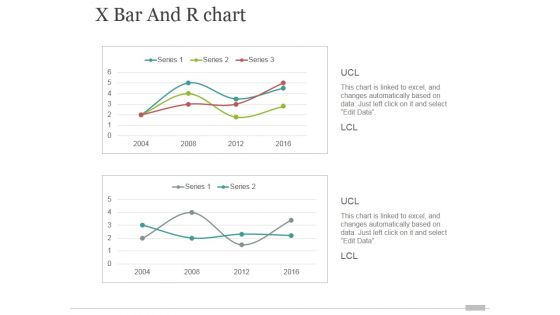
X Bar And R Chart Ppt PowerPoint Presentation Background Designs
This is a x bar and r chart ppt powerpoint presentation background designs. This is a two stage process. The stages in this process are chart, business, marketing, strategy, success.
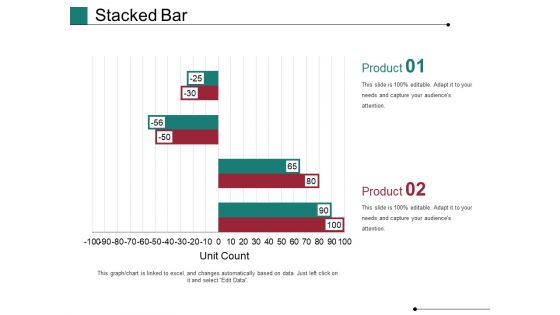
Stacked Bar Template 1 Ppt PowerPoint Presentation Show Slides
This is a stacked bar template 1 ppt powerpoint presentation show slides. This is a two stage process. The stages in this process are Unit Count, Business, Marketing, Graph, Finance.

Stacked Bar Template 1 Ppt PowerPoint Presentation Gallery Clipart
This is a stacked bar template 1 ppt powerpoint presentation gallery clipart. This is a two stage process. The stages in this process are percentage, graph, business, marketing, finance.

Stacked Bar Template 1 Ppt PowerPoint Presentation Outline Good
This is a stacked bar template 1 ppt powerpoint presentation outline good. This is a two stage process. The stages in this process are in percentage, business, marketing, graph, strategy.

Stacked Bar Ppt PowerPoint Presentation Ideas Graphics Tutorials
This is a stacked bar ppt powerpoint presentation ideas graphics tutorials. This is a two stage process. The stages in this process are unit count, graph, business, marketing, strategy.

Bar Chart Ppt PowerPoint Presentation Visual Aids Diagrams
This is a bar chart ppt powerpoint presentation visual aids diagrams. This is a two stage process. The stages in this process are business, marketing, financial years, sales in percentage, graph.

Bar Chart Ppt PowerPoint Presentation Inspiration Background Image
This is a bar chart ppt powerpoint presentation inspiration background image. This is a two stage process. The stages in this process are business, marketing, strategy, finance, in years, in percentage.
Stacked Bar Template 1 Ppt PowerPoint Presentation Icon Portfolio
This is a stacked bar template 1 ppt powerpoint presentation icon portfolio. This is a two stage process. The stages in this process are business, marketing, finance, graph, strategy.
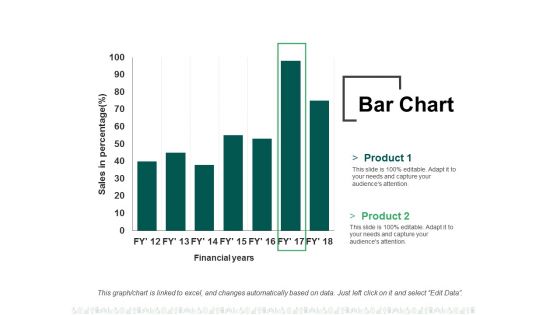
Bar Chart Ppt PowerPoint Presentation Summary File Formats
This is a bar chart ppt powerpoint presentation summary file formats. This is a two stage process. The stages in this process are business, finance, financial years, sales in percentage, graph.

Bar Chart Finance Ppt PowerPoint Presentation Model Master Slide
This is a bar chart finance ppt powerpoint presentation model master slide. This is a two stage process. The stages in this process are finance, marketing, management, investment, analysis.

Bar Graph Finance Ppt PowerPoint Presentation Infographics Background Designs
This is a bar graph finance ppt powerpoint presentation infographics background designs. This is a two stage process. The stages in this process are finance, analysis, business, investment, marketing.
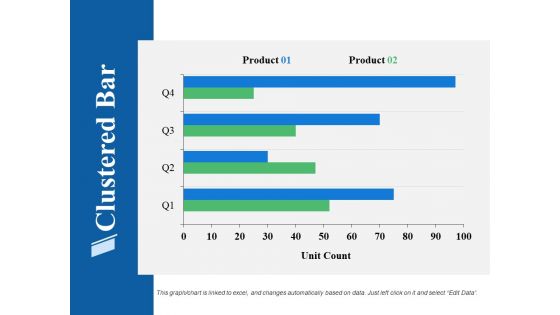
Clustered Bar Finance Ppt PowerPoint Presentation Show Background Image
This is a clustered bar finance ppt powerpoint presentation show background image. This is a two stage process. The stages in this process are finance, analysis, business, investment, marketing.
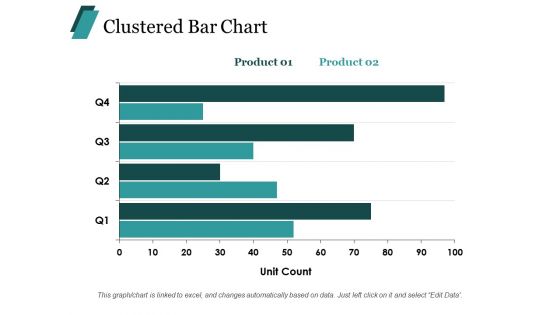
Clustered Bar Chart Finance Ppt PowerPoint Presentation Summary Layouts
This is a clustered bar chart finance ppt powerpoint presentation summary layouts. This is a two stage process. The stages in this process are finance, marketing, management, investment, analysis.

Stacked Bar Finance Management Ppt Powerpoint Presentation Infographics Graphics Design
This is a stacked bar finance management ppt powerpoint presentation infographics graphics design. This is a two stage process. The stages in this process are finance, marketing, management, investment, analysis.

Stacked Bar Chart Percentage Ppt PowerPoint Presentation Portfolio Mockup
This is a stacked bar chart percentage ppt powerpoint presentation portfolio mockup. This is a two stage process. The stages in this process are business, marketing, management, percentage, product.
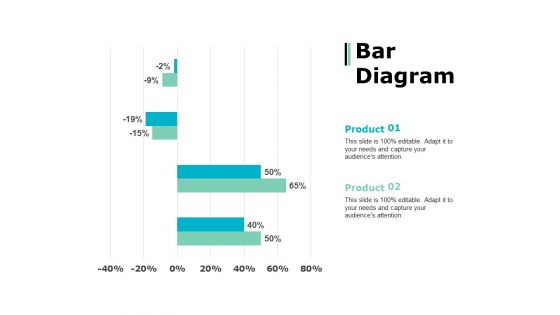
Bar Diagram Percentage Product Ppt PowerPoint Presentation Show Topics
This is a bar diagram percentage product ppt powerpoint presentation show topics. This is a two stage process. The stages in this process are percentage, product, business, management, marketing.
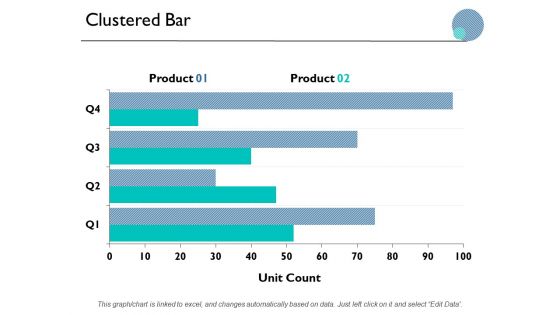
Clustered Bar Finance Marketing Ppt PowerPoint Presentation Inspiration Infographics
This is a clustered bar finance marketing ppt powerpoint presentation inspiration infographics. This is a two stage process. The stages in this process are finance, marketing, management, investment, analysis.
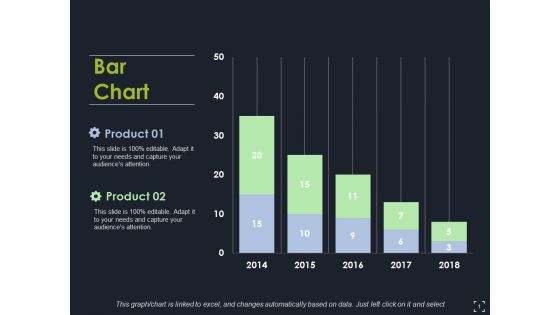
Bar Chart Ppt PowerPoint Presentation Model Clipart Images
This is a bar chart ppt powerpoint presentation model clipart images. This is a two stage process. The stages in this process are bar chart, finance, marketing, strategy, analysis.

Bar Chart Percentage Product Ppt PowerPoint Presentation Layouts Designs Download
This is a bar chart percentage product ppt powerpoint presentation layouts designs download. This is a two stage process. The stages in this process are percentage, product, business, management.
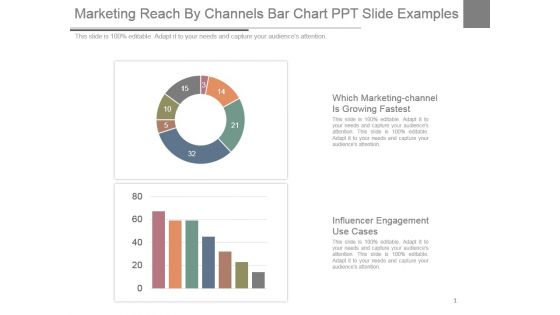
Marketing Reach By Channels Bar Chart Ppt Slide Examples
This is a marketing reach by channels bar chart ppt slide examples. This is a two stage process. The stages in this process are which marketing-channel is growing fastest, influencer engagement use cases.
Numbers Blocks In Sequential Flow Ppt PowerPoint Presentation Outline Graphics Design
This is a numbers blocks in sequential flow ppt powerpoint presentation outline graphics design. This is a two stage process. The stages in this process are numeric boxes, counting blocks, block numbers.
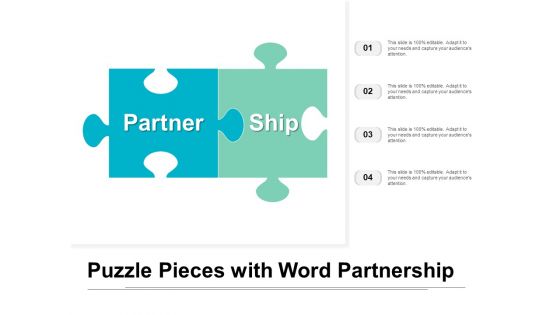
Puzzle Pieces With Word Partnership Ppt PowerPoint Presentation Infographic Template Styles
This is a puzzle pieces with word partnership ppt powerpoint presentation infographic template styles. This is a two stage process. The stages in this process are handshake, relationship, partnership.
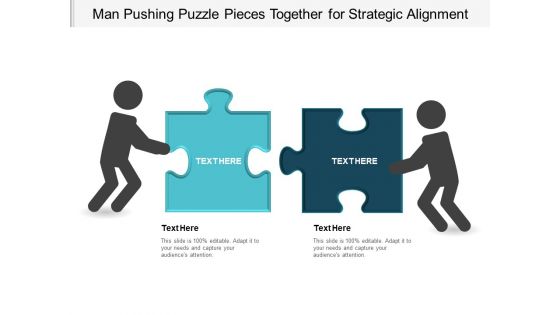
Man Pushing Puzzle Pieces Together For Strategic Alignment Ppt Powerpoint Presentation Portfolio Format Ideas
This is a man pushing puzzle pieces together for strategic alignment ppt powerpoint presentation portfolio format ideas. This is a two stage process. The stages in this process are strategic alignment, business alignment, process alignment.
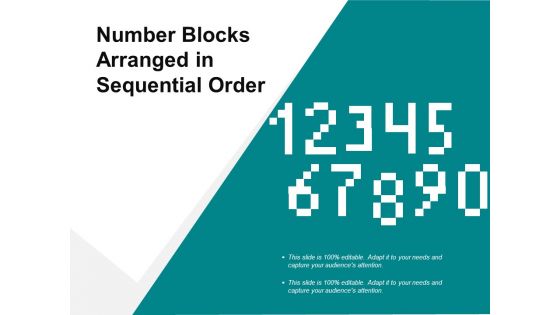
Number Blocks Arranged In Sequential Order Ppt PowerPoint Presentation Ideas Designs Download
This is a number blocks arranged in sequential order ppt powerpoint presentation ideas designs download. This is a two stage process. The stages in this process are numeric boxes, counting blocks, block numbers.

Business Diagram 3d Puzzle With One Blue Piece And 3d Business Men Presentation Template
This business slide displays two business men shaking hands with puzzle in background. This slide helps to depict successful business deal. Download our above diagram to express information in a visual way.
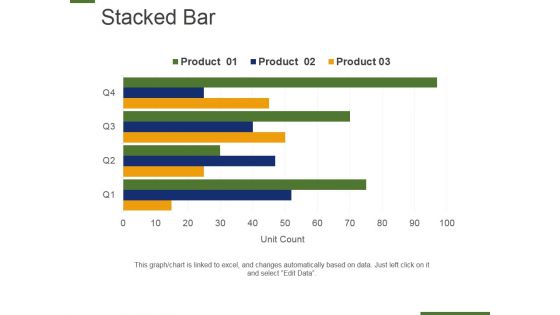
Stacked Bar Template 2 Ppt PowerPoint Presentation Visual Aids Background Images
This is a stacked bar template 2 ppt powerpoint presentation visual aids background images. This is a two stage process. The stages in this planning, management, strategy, marketing, business.
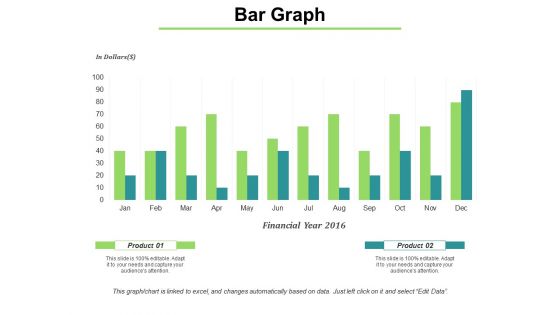
Bar Graph Shows Financial Values Ppt PowerPoint Presentation Infographic Template Gridlines
This is a bar graph shows financial values ppt powerpoint presentation infographic template gridlines. This is a two stage process. The stages in this process are bar, marketing, strategy, finance, planning.
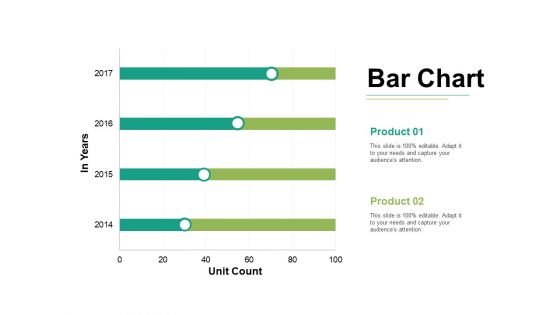
Bar Chart Ppt PowerPoint Presentation Styles Graphics Tutorials Ppt PowerPoint Presentation Slides Gallery
This is a bar chart ppt powerpoint presentation styles graphics tutorials ppt powerpoint presentation slides gallery. This is a two stage process. The stages in this process are bar graph, growth, success, business, marketing.

Bar Chart With Growth Arrow For Business Expansion Ppt Powerpoint Presentation File Vector
This is a bar chart with growth arrow for business expansion ppt powerpoint presentation file vector. This is a two stage process. The stages in this process are expanding, business development, business expansion.

Quantitative Bar Chart For Data Analysis Ppt PowerPoint Presentation Model Graphic Tips
This is a quantitative bar chart for data analysis ppt powerpoint presentation model graphic tips. This is a two stage process. The stages in this process are financial analysis, quantitative, statistical modelling.
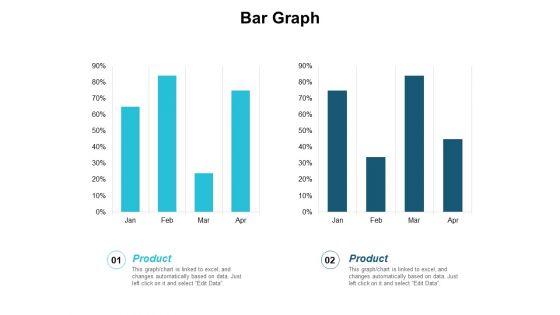
Bar Graph Finance Planning Ppt PowerPoint Presentation Infographic Template Master Slide
This is a bar graph finance planning ppt powerpoint presentation infographic template master slide. This is a two stage process. The stages in this process are finance, analysis, business, investment, marketing.

Financial Highlights Template 2 Ppt PowerPoint Presentation Slides Ideas
This is a financial highlights template 2 ppt powerpoint presentation slides ideas. This is a two stage process. The stages in this process are bar graph, growth, success, business, marketing.
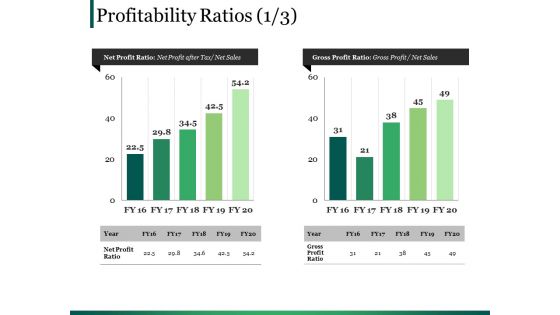
Profitability Ratios Template 2 Ppt PowerPoint Presentation Summary Graphics
This is a profitability ratios template 2 ppt powerpoint presentation summary graphics. This is a two stage process. The stages in this process are business, marketing, bar, finance, planning.
Clustered Column Template 2 Ppt PowerPoint Presentation Icon
This is a clustered column template 2 ppt powerpoint presentation icon. This is a two stage process. The stages in this process are bar graph, marketing, strategy, analysis, business, success.

Clustered Column Template 2 Ppt PowerPoint Presentation Summary Smartart
This is a clustered column template 2 ppt powerpoint presentation summary smartart. This is a two stage process. The stages in this process are product, bar graph, in percentage, clustered column, growth.
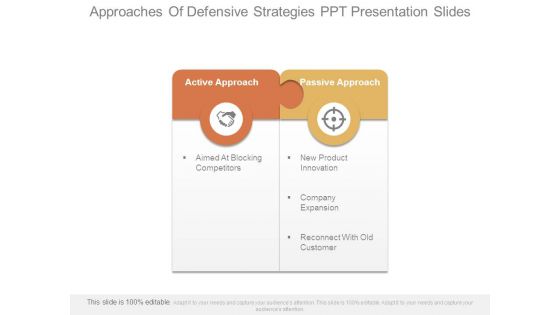
Approaches Of Defensive Strategies Ppt Presentation Slides
This is a approaches of defensive strategies ppt presentation slides. This is a two stage process. The stages in this process are active approach, passive approach, aimed at blocking competitors, new product innovation, company expansion, reconnect with old customer.
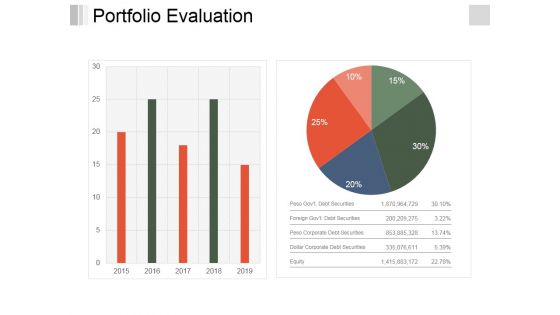
Portfolio Evaluation Ppt PowerPoint Presentation Infographics Objects
This is a portfolio evaluation ppt powerpoint presentation infographics objects. This is a two stage process. The stages in this process are business, finance, bar graph, pie chart, marketing, analysis, investment.

Clustered Column Ppt PowerPoint Presentation File Slide
This is a clustered column ppt powerpoint presentation file slide. This is a two stage process. The stages in this process are product, financial year, sales in percentage, bar graph.
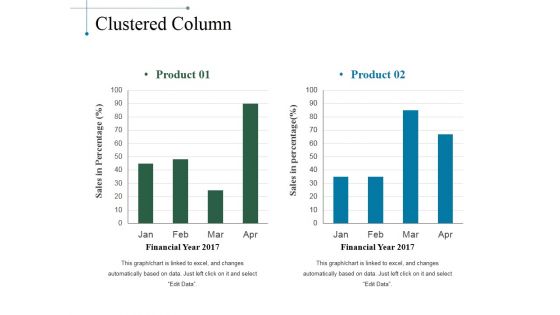
Clustered Column Ppt PowerPoint Presentation Slides Smartart
This is a clustered column ppt powerpoint presentation slides smartart. This is a two stage process. The stages in this process are product, sales in percentage, financial year, bar graph.
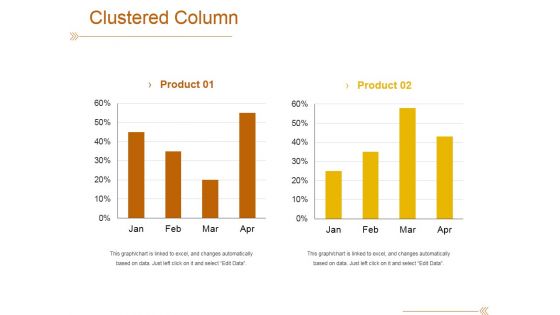
Clustered Column Template 1 Ppt PowerPoint Presentation Outline File Formats
This is a clustered column template 1 ppt powerpoint presentation outline file formats. This is a two stage process. The stages in this process are product, bar graph, success, growth, finance.

Quarter Track Record Ppt PowerPoint Presentation File Clipart Images
This is a quarter track record ppt powerpoint presentation file clipart images. This is a two stage process. The stages in this process are bar graph, growth, success, business, marketing.
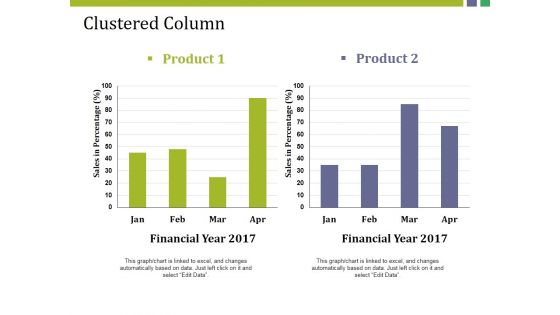
Clustered Column Ppt PowerPoint Presentation Gallery Structure
This is a clustered column ppt powerpoint presentation gallery structure. This is a two stage process. The stages in this process are product, sales in percentage, financial year, bar graph, finance.

Clustered Column Ppt PowerPoint Presentation Pictures Graphics Template
This is a clustered column ppt powerpoint presentation pictures graphics template. This is a two stage process. The stages in this process are product, growth, success, business, bar graph.
Clustered Column Ppt PowerPoint Presentation Icon Objects
This is a clustered column ppt powerpoint presentation icon objects. This is a two stage process. The stages in this process are clustered column, product, growth, finance, bar graph.
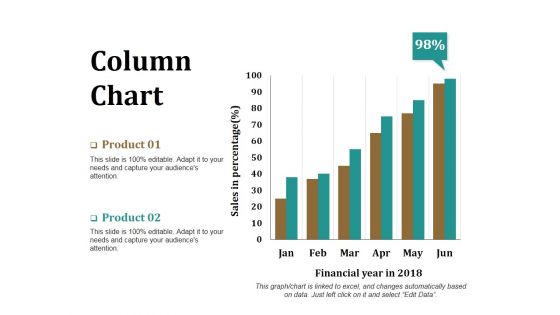
Column Chart Ppt PowerPoint Presentation Model Graphics Download
This is a column chart ppt powerpoint presentation model graphics download. This is a two stage process. The stages in this process are product, financial year, sales in percentage, bar graph, success.

Column Chart Ppt PowerPoint Presentation Gallery Slide Portrait
This is a column chart ppt powerpoint presentation gallery slide portrait. This is a two stage process. The stages in this process are sales in percentage, financial year, product, bar graph, growth.

Project Progress And Reasons For Delay Ppt PowerPoint Presentation Designs Download
This is a project progress and reasons for delay ppt powerpoint presentation designs download. This is a two stage process. The stages in this process are business, marketing, success, bar graph, management.

Crowdfunding Statistics Template 1 Ppt PowerPoint Presentation Good
This is a crowdfunding statistics template 1 ppt powerpoint presentation good. This is a two stage process. The stages in this process are business, location, geographical, finance, bar graph, marketing.
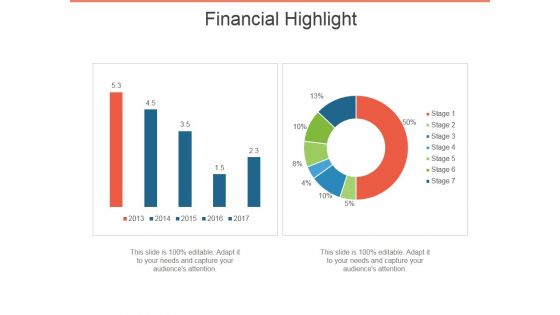
Financial Highlight Template 1 Ppt PowerPoint Presentation Ideas Themes
This is a financial highlight template 1 ppt powerpoint presentation ideas themes. This is a two stage process. The stages in this process are financial, highlight, business, bar graph, marketing.
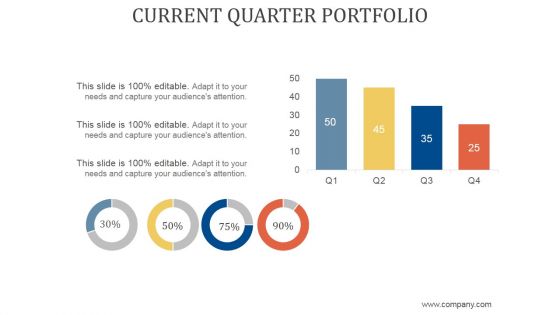
Current Quarter Portfolio Ppt PowerPoint Presentation Visual Aids
This is a current quarter portfolio ppt powerpoint presentation visual aids. This is a two stage process. The stages in this process are business, strategy, marketing, finance, growth strategy, bar graph.
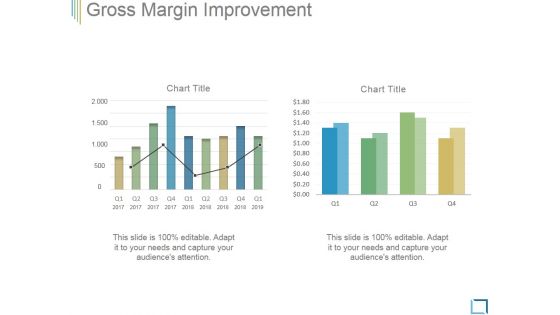
Gross Margin Improvement Ppt PowerPoint Presentation Guidelines
This is a gross margin improvement ppt powerpoint presentation guidelines. This is a two stage process. The stages in this process are business, bar graph, investment, marketing, strategy, success.
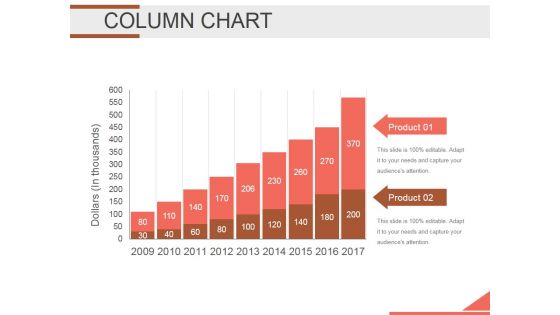
Column Chart Ppt PowerPoint Presentation Background Designs
This is a column chart ppt powerpoint presentation background designs. This is a two stage process. The stages in this process are bar graph, finance, marketing, strategy, analysis, business.
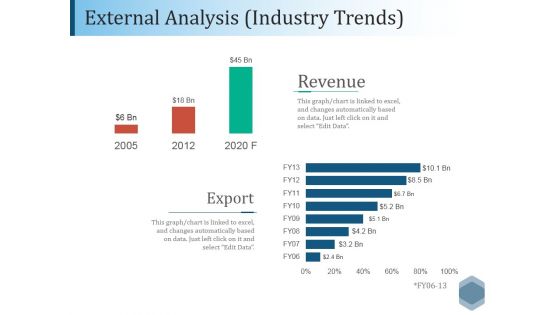
External Analysis Industry Trends Ppt PowerPoint Presentation File Outfit
This is a external analysis industry trends ppt powerpoint presentation file outfit. This is a two stage process. The stages in this process are revenue, export, bar, finance, analysis.
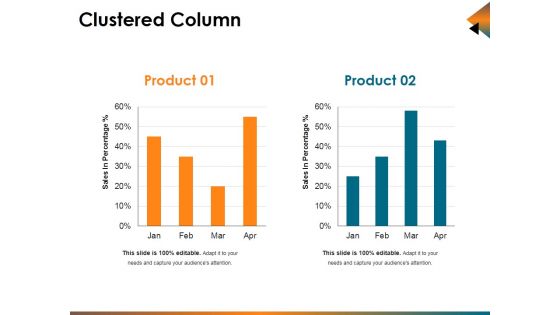
Clustered Column Ppt PowerPoint Presentation Infographic Template Background Designs
This is a clustered column ppt powerpoint presentation infographic template background designs. This is a two stage process. The stages in this process are sales in percentage, bar, business, marketing, planning.

Quarter Track Record Ppt PowerPoint Presentation Gallery Images
This is a quarter track record ppt powerpoint presentation gallery images. This is a two stage process. The stages in this process are series, bar graph, growth, success, business.

Column Chart Ppt PowerPoint Presentation Infographics Design Inspiration
This is a column chart ppt powerpoint presentation infographics design inspiration. This is a two stage process. The stages in this process are slide bar, marketing, strategy, finance, planning.

Clustered Column Ppt PowerPoint Presentation Visual Aids Show
This is a clustered column ppt powerpoint presentation visual aids show. This is a two stage process. The stages in this process are product, profit, business, bar graph, finance.
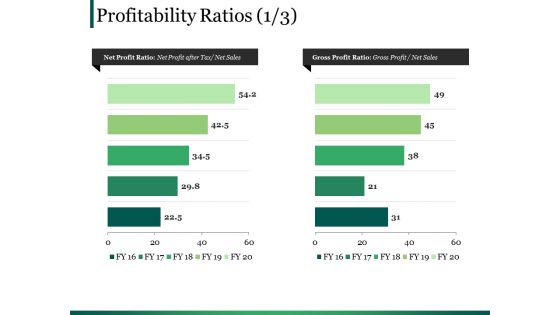
Profitability Ratios Template 1 Ppt PowerPoint Presentation Portfolio Display
This is a profitability ratios template 1 ppt powerpoint presentation portfolio display. This is a two stage process. The stages in this process are business, marketing, bar, finance, planning.
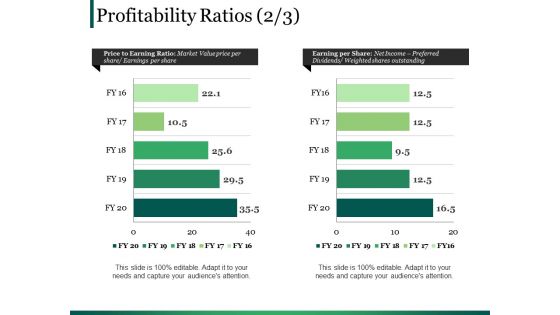
Profitability Ratios Template 3 Ppt PowerPoint Presentation Slides Good
This is a profitability ratios template 3 ppt powerpoint presentation slides good. This is a two stage process. The stages in this process are business, marketing, bar, finance, planning.
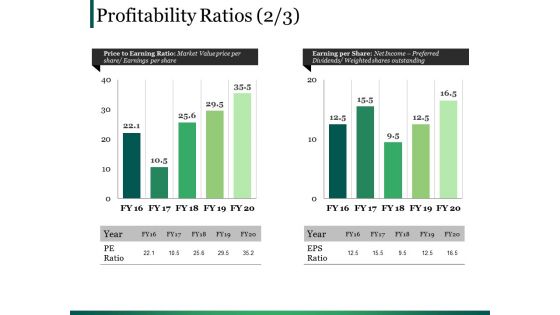
Profitability Ratios Template 4 Ppt PowerPoint Presentation Infographic Template Clipart Images
This is a profitability ratios template 4 ppt powerpoint presentation infographic template clipart images. This is a two stage process. The stages in this process are business, marketing, bar, finance, planning.

Volume High Low Close Chart Ppt PowerPoint Presentation Visual Aids Slides
This is a volume high low close chart ppt powerpoint presentation visual aids slides. This is a two stage process. The stages in this process are bar graph, marketing, strategy, finance, planning.
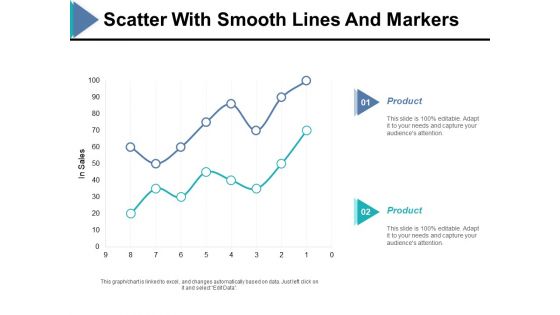
Scatter With Smooth Lines And Markers Ppt PowerPoint Presentation Ideas Example
This is a scatter with smooth lines and markers ppt powerpoint presentation ideas example. This is a two stage process. The stages in this process are in sales, finance, bar graph, product, business.
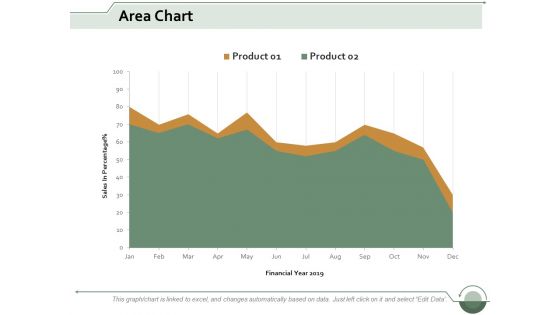
Area Chart Finance Ppt Powerpoint Presentation Infographic Template Clipart Images
This is a area chart finance ppt powerpoint presentation infographic template clipart images. This is a two stage process. The stages in this process are area bar, finance, marketing, management, analysis.
Analysis Techniques Pareto Analysis Ppt PowerPoint Presentation Professional Icons
This is a analysis techniques pareto analysis ppt powerpoint presentation professional icons. This is a two stage process. The stages in this process are bar chart, finance, marketing, business, analysis.

Clustered Column Finance Ppt PowerPoint Presentation Pictures Inspiration
This is a clustered column finance ppt powerpoint presentation pictures inspiration. This is a two stage process. The stages in this process are bar chart, finance, marketing, business, analysis.
Data Collection Histograms Ppt PowerPoint Presentation Icon Slides
This is a data collection histograms ppt powerpoint presentation icon slides. This is a two stage process. The stages in this process are bar chart, finance, marketing, business, analysis.

Monthly Run Revenue Ppt PowerPoint Presentation Design Ideas
This is a monthly run revenue ppt powerpoint presentation design ideas. This is a two stage process. The stages in this process are business, marketing, success, bar graph, growth.

Stacked Line With Marker Ppt PowerPoint Presentation Ideas Themes
This is a stacked line with marker ppt powerpoint presentation ideas themes. This is a two stage process. The stages in this process are profit, stacked bar, product, business, marketing.

Stock Chart Template 1 Ppt PowerPoint Presentation Infographic Template Objects
This is a stock chart template 1 ppt powerpoint presentation infographic template objects. This is a two stage process. The stages in this process are product, profit, bar graph, growth, success.
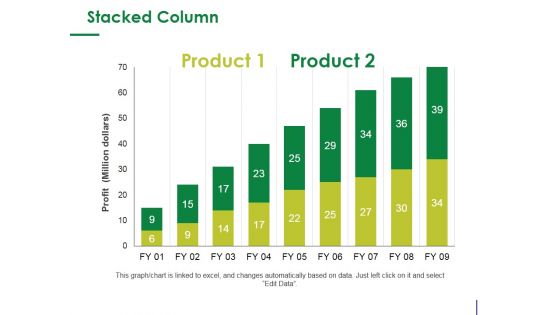
Stacked Column Ppt PowerPoint Presentation Infographic Template Design Ideas
This is a stacked column ppt powerpoint presentation infographic template design ideas. This is a two stage process. The stages in this process are product, profit, bar graph, growth, success.
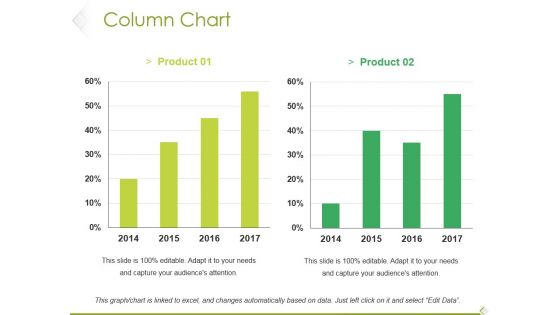
Column Chart Ppt PowerPoint Presentation Model Clipart Images
This is a column chart ppt powerpoint presentation model clipart images. This is a two stage process. The stages in this process are product, bar graph, growth, success, business.
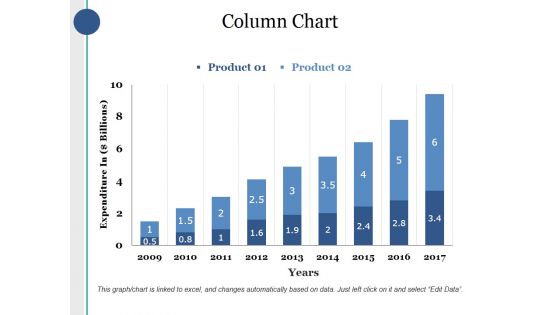
Column Chart Ppt PowerPoint Presentation Infographics Deck
This is a column chart ppt powerpoint presentation infographics deck. This is a two stage process. The stages in this process are product, expenditure in, years, bar graph, growth.

Combo Chart Ppt PowerPoint Presentation File Visual Aids
This is a combo chart ppt powerpoint presentation file visual aids. This is a two stage process. The stages in this process are bar graph, business, marketing, finance, planning.

Column Chart Ppt PowerPoint Presentation Portfolio Slide Download
This is a column chart ppt powerpoint presentation portfolio slide download. This is a two stage process. The stages in this process are product, year, bar graph, success, business.

Competitors Average Price Product Ppt PowerPoint Presentation File Show
This is a competitors average price product ppt powerpoint presentation file show. This is a two stage process. The stages in this process are bar graph, marketing, strategy, finance, planning.

Stacked Column Ppt PowerPoint Presentation Layouts Example
This is a stacked column ppt powerpoint presentation layouts example. This is a two stage process. The stages in this process are product, stacked column, bar graph, growth, success.

Column Chart Ppt PowerPoint Presentation Layouts Graphics Example
This is a column chart ppt powerpoint presentation layouts graphics example. This is a two stage process. The stages in this process are product, year, bar graph, business, finance.

Stacked Column Ppt PowerPoint Presentation Styles Graphic Tips
This is a stacked column ppt powerpoint presentation styles graphic tips. This is a two stage process. The stages in this process are product, in million, bar graph, growth, success.
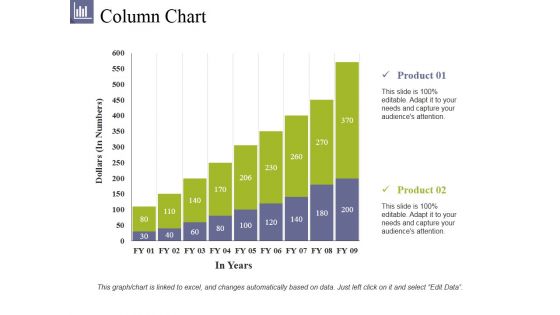
Column Chart Ppt PowerPoint Presentation File Summary
This is a column chart ppt powerpoint presentation file summary. This is a two stage process. The stages in this process are product, dollars, in years, bar graph, growth.
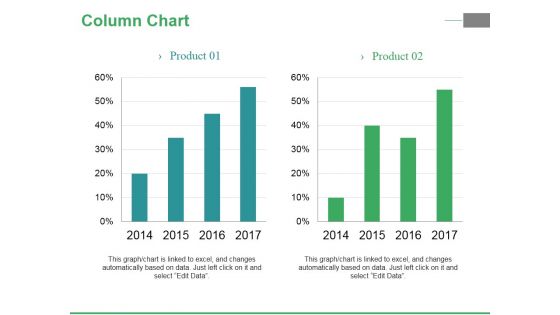
Column Chart Ppt PowerPoint Presentation Pictures Graphic Images
This is a column chart ppt powerpoint presentation pictures graphic images. This is a two stage process. The stages in this process are product, years, growth, success, bar graph.
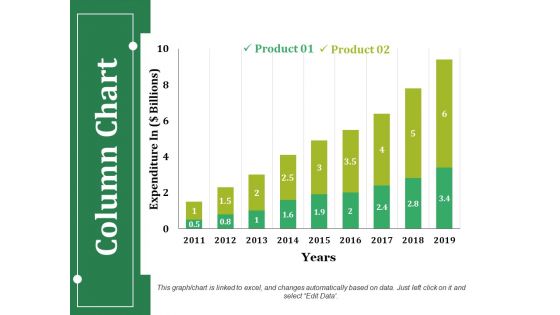
Column Chart Ppt PowerPoint Presentation Infographics Guidelines
This is a column chart ppt powerpoint presentation infographics guidelines. This is a two stage process. The stages in this process are product, expenditure in, years, business, bar graph.

Column Chart Ppt PowerPoint Presentation Layouts Vector
This is a column chart ppt powerpoint presentation layouts vector. This is a two stage process. The stages in this process are product, column chart, bar graph, percentage, finance.
Column Chart Ppt PowerPoint Presentation Icon Show
This is a column chart ppt powerpoint presentation icon show. This is a two stage process. The stages in this process are column chart, product, years, bar graph, growth.
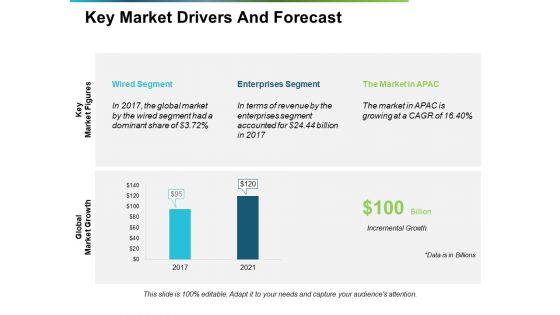
Key Market Drivers And Forecast Ppt PowerPoint Presentation Summary Templates
This is a key market drivers and forecast ppt powerpoint presentation summary templates. This is a two stage process. The stages in this process are key market drivers, forecast, growth, bar graph, business.

Market Drivers Hardware And Software Ppt PowerPoint Presentation Inspiration Graphics Design
This is a market drivers hardware and software ppt powerpoint presentation inspiration graphics design. This is a two stage process. The stages in this process are key market drivers, forecast, growth, bar graph, business.
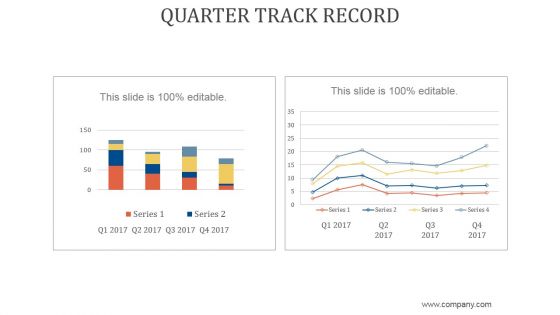
Quarter Track Record Ppt PowerPoint Presentation Samples
This is a quarter track record ppt powerpoint presentation samples. This is a two stage process. The stages in this process are business, strategy, marketing, analysis, growth strategy, bar graph.
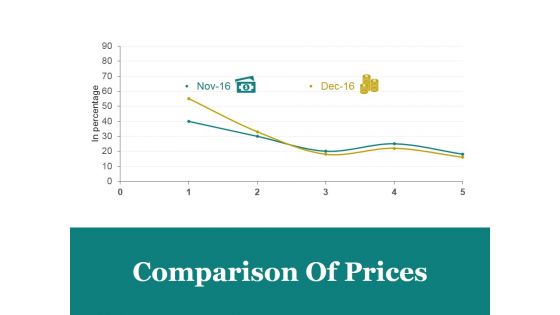
Comparison Of Prices Ppt PowerPoint Presentation Designs Download
This is a comparison of prices ppt powerpoint presentation designs download. This is a two stage process. The stages in this process are comparison of prices, marketing, in percentage, bar graph, business.
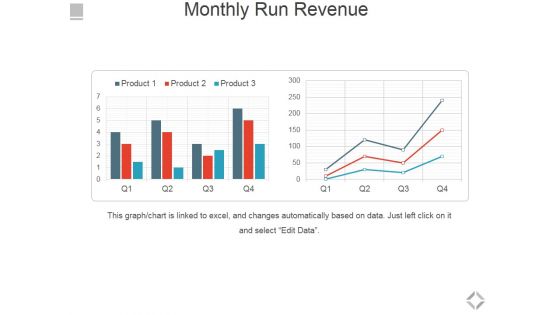
Monthly Run Revenue Ppt PowerPoint Presentation Show Styles
This is a monthly run revenue ppt powerpoint presentation show styles. This is a two stage process. The stages in this process are bar graph, business, marketing, success, growth.
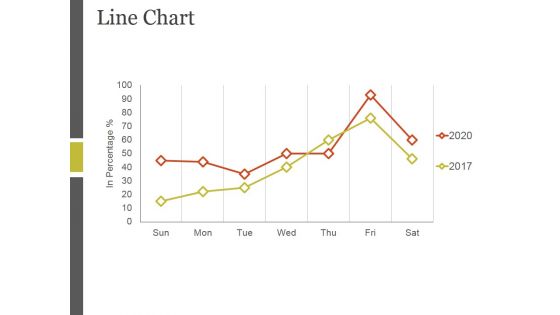
Line Chart Ppt PowerPoint Presentation Ideas Example
This is a line chart ppt powerpoint presentation ideas example. This is a two stage process. The stages in this process are sales in percentage, bar graph, business, marketing, growth.

Area Chart Ppt PowerPoint Presentation Summary Templates
This is a area chart ppt powerpoint presentation summary templates. This is a two stage process. The stages in this process are product, in percentage, bar graph, growth, business.

Clustered Column Ppt PowerPoint Presentation Inspiration Pictures
This is a clustered column ppt powerpoint presentation inspiration pictures. This is a two stage process. The stages in this process are clustered bar, product, planning, business, in price.

New Year Business Fortune Shapes PowerPoint Backgrounds And Templates 1210
Microsoft PowerPoint Template and Background with Two fortune cookies on a red background Business prospects improve in the New Year along with a bar chart showing a positive trend
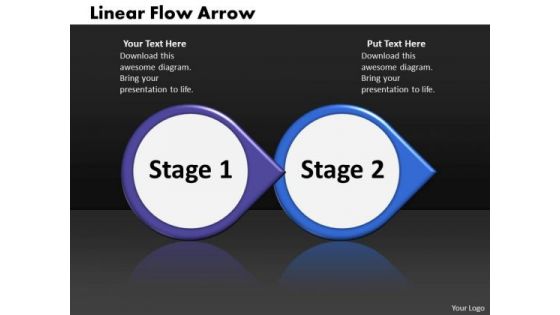
Ppt Linear Flow Arrow Business 2 State PowerPoint Presentation Diagram Templates
PPT linear flow arrow Business 2 state powerpoint presentation diagram Templates-This PPT shows Circular Arrows diagram can be used to show relationships between two parts of an overall concept.-PPT linear flow arrow Business 2 state powerpoint presentation diagram Templates-Abstract, Arrow, Arrow Chart, Business, Design, Development, Diagram, Direction, Element, Flow, Flow Chart, Flow Diagram, Flowchart, Graph, Linear, Management, Model, Motion, Organization, Plan, Process, Process Arrows, Process Chart, Process Diagram, Process Flow, Program, Section, Segment, Set, Sign, Solution, Strategy, Symbol, Technology

Internal And External Logistics Management Procedure Receiving Real Time Information Background PDF
This slide covers the bar coded information which helps to check the detailed receiving and ensures that the inbound process is running smoothly. Presenting internal and external logistics management procedure receiving real time information background pdf to provide visual cues and insights. Share and navigate important information on two stages that need your due attention. This template can be used to pitch topics like barcoding is specifically concatenation, two ways of detail receiving. In addtion, this PPT design contains high resolution images, graphics, etc, that are easily editable and available for immediate download.
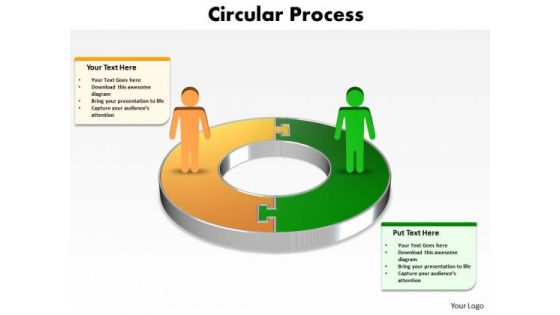
Ppt Busines Men Silhouettes Standing On 3d Circular PowerPoint Templates
PPT busines men silhouettes standing on 3d circular PowerPoint Templates-This PowerPoint Diagram signifies the two approaches opposite to each other explained by two different persons. This Business oriented Diagram will be very helpful for comparing different approaches. -PPT busines men silhouettes standing on 3d circular PowerPoint Templates-Arrow, Business, Challenge, Character, Circle, Circular, Concept, Connected, Connection, Design, Element, Expression, Feeling, Figure, Fit, Game, Gesture, Gold, Green, Hold, Icon, Isolated, Metaphor, Motivate, Motivation, Object, Office, Over, Partner, Partnership, Piece, Pose, Presentation, Problem, Process, Puzzle, Recycle, Recycling, Sign, Solution, Symbol, Team, Teamwork
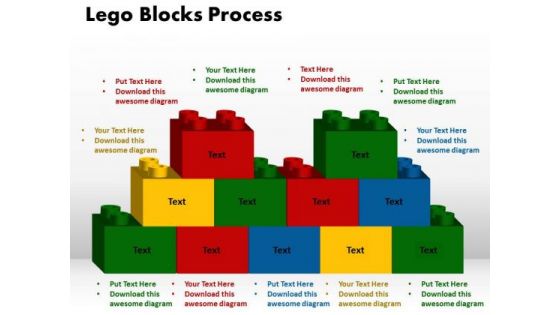
PowerPoint Theme Lego Blocks Process Growth Ppt Slides
PowerPoint Theme Lego Blocks Process Growth PPT Slides-This PowerPoint Diagram Consists of 11 Lego Bricks, Five Bricks at the bottom, then four at the middle and then two at the top. It signifies step by step execution of the process. It Portrays the concept of Construction, Manufacturing, Design, Retail Market and Business Consultants.-PowerPoint Theme Lego Blocks Process Growth PPT Slides

PowerPoint Theme Lego Blocks Process Sales Ppt Slide
PowerPoint Theme Lego Blocks Process Sales PPT Slide-This PowerPoint Diagram Consists of 10 Lego Bricks, Four Bricks at the bottom, then three at the middle and then two at the top. It signifies step by step execution of the process.-PowerPoint Theme Lego Blocks Process Sales PPT Slide
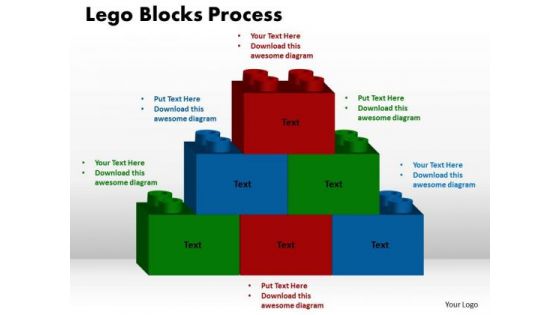
PowerPoint Theme Lego Blocks Process Strategy Ppt Themes
PowerPoint Theme Lego Blocks Process Strategy PPT Themes-This PowerPoint Diagram Consists of 6 Lego Bricks, three Bricks at the bottom, then two at the middle and then one at the top. It signifies step by step execution of the process.-PowerPoint Theme Lego Blocks Process Strategy PPT Themes

PowerPoint Theme Lego Blocks Process Success Ppt Slides
PowerPoint Theme Lego Blocks Process Success PPT Slides-This PowerPoint Diagram Consists of 3 Lego Bricks, two Bricks at the bottom, then one at the top. It signifies step by step execution of the process.-PowerPoint Theme Lego Blocks Process Success PPT Slides
Brick Wall With Lock For Security Vector Icon Ppt PowerPoint Presentation Pictures Deck PDF
Presenting this set of slides with name brick wall with lock for security vector icon ppt powerpoint presentation pictures deck pdf. This is a two stage process. The stages in this process are brick wall with lock for security vector icon. This is a completely editable PowerPoint presentation and is available for immediate download. Download now and impress your audience.
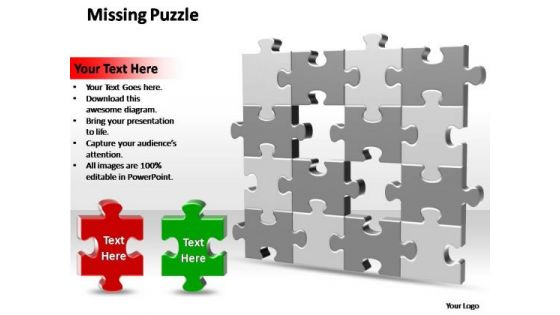
PowerPoint Template Success 2 Missing Puzzle Pieces Ppt Theme
PowerPoint Template Success 2 Missing Puzzle Pieces PPT Theme-This 3D PowerPoint diagram shows two Missing Puzzles from 4x4 Matrix Diagram. There is a lot of space available for writing your text. You can easily edit the size, position, text, color. -PowerPoint Template Success 2 Missing Puzzle Pieces PPT Theme

PowerPoint Templates Image 2 Missing Puzzle Pieces Ppt Designs
PowerPoint Templates Image 2 Missing Puzzle Pieces PPT Designs-This 3D PowerPoint diagram shows two Missing Puzzles from 4x4 Matrix Diagram. There is a lot of space available for writing your text. You can easily edit the size, position, text, color. -PowerPoint Templates Image 2 Missing Puzzle Pieces PPT Designs
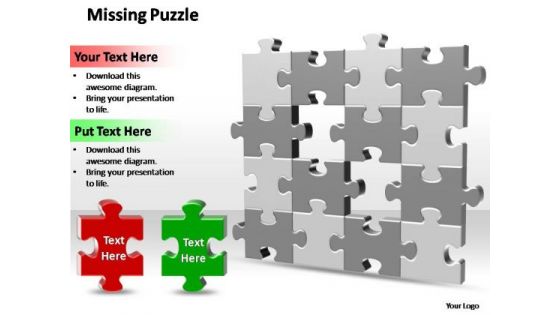
PowerPoint Themes Process 2 Missing Puzzle Pieces Ppt Slide
PowerPoint Themes Process 2 Missing Puzzle Pieces PPT Slide-This 3D PowerPoint diagram shows two Missing Puzzles from 4x4 Matrix Diagram. There is a lot of space available for writing your text. You can easily edit the size, position, text, color. -PowerPoint Themes Process 2 Missing Puzzle Pieces PPT Slide
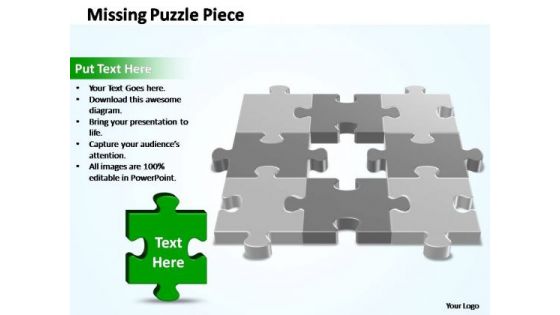
PowerPoint Slides Business 3d 3x3 Missing Puzzle Piece Ppt Process
PowerPoint Slides Business 3D 3X3 Missing Puzzle Piece PPT Process-This 3D PowerPoint diagram shows two Missing Puzzles from 4x4 Matrix Diagram. There is a lot of space available for writing your text. You can easily edit the size, position, text, color. -PowerPoint Slides Business 3D 3X3 Missing Puzzle Piece PPT Process
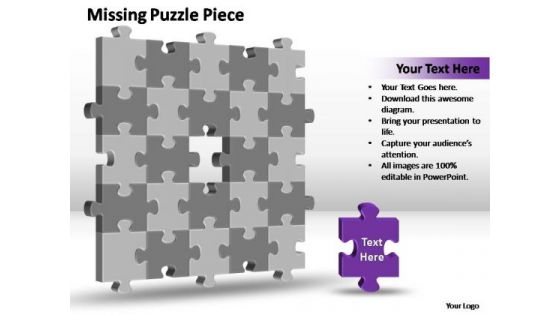
PowerPoint Slides Process 3d 5x5 Missing Puzzle Piece Ppt Theme
PowerPoint Slides Process 3D 5X5 Missing Puzzle Piece PPT Theme-This 3D PowerPoint diagram shows two Missing Puzzles from 4x4 Matrix Diagram. There is a lot of space available for writing your text. You can easily edit the size, position, text, color. -PowerPoint Slides Process 3D 5X5 Missing Puzzle Piece PPT Theme

Stock Photo American Chinese Flag Puzzle Pieces PowerPoint Slide
Display the concept of partnership in between America and China with this exclusive image. This image slide contains the graphic of puzzles pieces with America and China countries flag design. Use this image to display political relations between these two countries,

Puzzle Pieces Abstract Image Ppt PowerPoint Presentation Show Design Templates
Presenting this set of slides with name puzzle pieces abstract image ppt powerpoint presentation show design templates. This is a two stage process. The stages in this process are puzzle pieces abstract image. This is a completely editable PowerPoint presentation and is available for immediate download. Download now and impress your audience.

PowerPoint Backgrounds Editable 9x9 Missing Puzzle Piece Template Ppt Themes
PowerPoint Backgrounds Editable 9X9 Missing Puzzle Piece Template PPT Themes-This 3D PowerPoint diagram shows two Missing Puzzles from 9x9 Matrix Diagram. This Business PowerPoint Template has a lot of space for writing your text. You can easily edit the size, position, text, color. -PowerPoint Backgrounds Editable 9X9 Missing Puzzle Piece Template PPT Themes
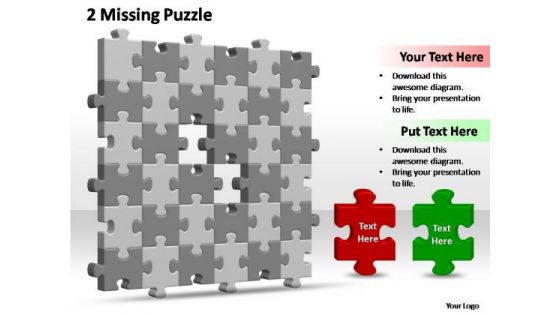
PowerPoint Slide Image 6x6 Missing Puzzle Piece Template Ppt Designs
PowerPoint Slide Image 6X6 Missing Puzzle Piece Template PPT Designs-This 3D PowerPoint diagram shows two Missing Puzzles from 6x6 Matrix Diagram. This Business PowerPoint Template has a lot of space for writing your text. You can easily edit the size, position, text, color. -PowerPoint Slide Image 6X6 Missing Puzzle Piece Template PPT Designs

 Home
Home