AI PPT Maker
Templates
PPT Bundles
Design Services
Business PPTs
Business Plan
Management
Strategy
Introduction PPT
Roadmap
Self Introduction
Timelines
Process
Marketing
Agenda
Technology
Medical
Startup Business Plan
Cyber Security
Dashboards
SWOT
Proposals
Education
Pitch Deck
Digital Marketing
KPIs
Project Management
Product Management
Artificial Intelligence
Target Market
Communication
Supply Chain
Google Slides
Research Services
 One Pagers
All Categories
-
Home
- Customer Favorites
- Two Phases
Two Phases
Retail Shop With Pie Chart Vector Icon Ppt PowerPoint Presentation Slides Portfolio PDF
Presenting this set of slides with name retail shop with pie chart vector icon ppt powerpoint presentation slides portfolio pdf. This is a three stage process. The stages in this process are retail shop with pie chart vector icon. This is a completely editable PowerPoint presentation and is available for immediate download. Download now and impress your audience.
Pie Chart Showing Business Statistics Vector Icon Ppt PowerPoint Presentation Infographics Design Ideas PDF
Presenting this set of slides with name pie chart showing business statistics vector icon ppt powerpoint presentation infographics design ideas pdf. This is a three stage process. The stages in this process are pie chart showing business statistics vector icon. This is a completely editable PowerPoint presentation and is available for immediate download. Download now and impress your audience.
Pie Chart With Magnifying Glass Vector Icon Ppt PowerPoint Presentation File Summary PDF
Presenting this set of slides with name pie chart with magnifying glass vector icon ppt powerpoint presentation file summary pdf. This is a three stage process. The stages in this process are pie chart with magnifying glass vector icon. This is a completely editable PowerPoint presentation and is available for immediate download. Download now and impress your audience.
Trading And Investment Business Chart Vector Icon Ppt PowerPoint Presentation Portfolio Visuals PDF
Presenting this set of slides with name trading and investment business chart vector icon ppt powerpoint presentation portfolio visuals pdf. This is a three stage process. The stages in this process are trading and investment business chart vector icon. This is a completely editable PowerPoint presentation and is available for immediate download. Download now and impress your audience.

Data Analysis With Bar Chart In Magnifying Glass Vector Icon Ppt PowerPoint Presentation File Model PDF
Presenting this set of slides with name data analysis with bar chart in magnifying glass vector icon ppt powerpoint presentation file model pdf. This is a one stage process. The stages in this process is data analysis with bar chart in magnifying glass vector icon. This is a completely editable PowerPoint presentation and is available for immediate download. Download now and impress your audience.
Workflow Chart In Magnifying Glass Vector Icon Ppt PowerPoint Presentation Gallery Portfolio PDF
Presenting this set of slides with name workflow chart in magnifying glass vector icon ppt powerpoint presentation gallery portfolio pdf. This is a three stage process. The stages in this process are workflow chart in magnifying glass vector icon. This is a completely editable PowerPoint presentation and is available for immediate download. Download now and impress your audience.

ISO Standard Compliances For IT Asset Management Ppt Visuals PDF
This slide shows ISO standards that are established for IT asset management and followed by organization to meet compliance regulations. It provides information for standards such as 19770-1, 19770-2, 19770-3, 19770-4, 19770-5. Presenting ISO Standard Compliances For IT Asset Management Ppt Visuals PDF to dispense important information. This template comprises five stages. It also presents valuable insights into the topics including Satisfy Corporate Governance, Provide Support, IT Service. This is a completely customizable PowerPoint theme that can be put to use immediately. So, download it and address the topic impactfully.

Banking Solutions Company Overview Capital Adequacy Ratio Diagrams PDF
The slide highlights the capital adequacy ratio depicting for the time period of five years from 2018 to 2022. It depicts tier 1, tier 2 and common equity tier 1 ratios with key insights. Deliver an awe inspiring pitch with this creative Banking Solutions Company Overview Capital Adequacy Ratio Diagrams PDF bundle. Topics like Capital Adequacy Ratio, Minimum Requirement, Capital Adequacy Ratio can be discussed with this completely editable template. It is available for immediate download depending on the needs and requirements of the user.

Clustered Combo Chart Ppt PowerPoint Presentation Show
This is a clustered combo chart ppt powerpoint presentation show. This is a eigth stage process. The stages in this process are clustered combo chart, finance, marketing, strategy, investment, business.

Bar Chart Ppt PowerPoint Presentation Slide Download
This is a bar chart ppt powerpoint presentation slide download. This is a three stage process. The stages in this process are chart, in years, unit count, business, marketing.

Combo Chart Ppt PowerPoint Presentation Inspiration Vector
This is a combo chart ppt powerpoint presentation inspiration vector. This is a three stage process. The stages in this process are combo chart, finance, marketing, strategy, analysis, business.
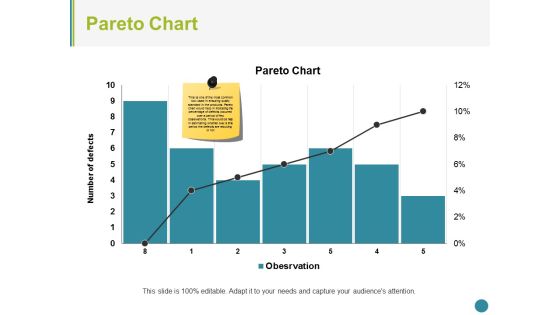
Pareto Chart Ppt PowerPoint Presentation Summary Structure
This is a pareto chart ppt powerpoint presentation summary structure. This is a seven stage process. The stages in this process are pareto chart, finance, marketing, strategy, analysis, business.

Combo Chart Ppt PowerPoint Presentation Infographics Sample
This is a combo chart ppt powerpoint presentation infographics sample. This is a three stage process. The stages in this process are combo chart, finance, analysis, marketing, strategy, business.

Scatter Bubble Chart Ppt PowerPoint Presentation Professional
This is a scatter bubble chart ppt powerpoint presentation professional. This is a three stage process. The stages in this process are scatter bubble chart, product, in price, percentage, business.

Business Target Achievement Hexagon Chart Powerpoint Slides
This PowerPoint template has been designed with graphics of hexagon chart. You may use this PPT slide to display strategy for target achievement. Impress your audiences by using this PPT slide.
Investment Fund Evaluation With Dollar Symbol And Pie Chart Vector Icon Ppt PowerPoint Presentation Icon Files PDF
Presenting this set of slides with name investment fund evaluation with dollar symbol and pie chart vector icon ppt powerpoint presentation icon files pdf. This is a three stage process. The stages in this process are investment fund evaluation with dollar symbol and pie chart vector icon. This is a completely editable PowerPoint presentation and is available for immediate download. Download now and impress your audience.
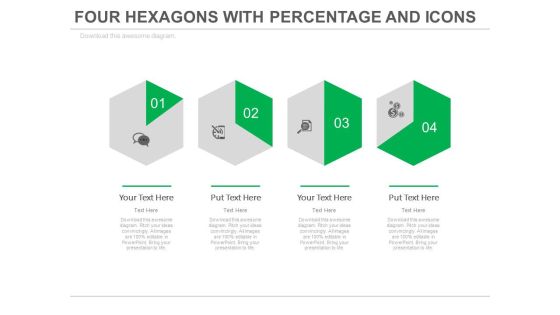
Four Steps Of Financial Growth Analysis Powerpoint Slides
This PowerPoint template with multiple Hexagons can be creatively used to present a timeline in a visual manner. This slide can also help the audience understand a 6 step process in an easier manner. The icons are totally customizable and can be edited to represent the particular process happening at that stage. It can also be used to represent different times or different activities to be carried out at different times in in a day in an office or an organization (e.g. - Medicine schedule) since the hexagon represents a clock and change of shade moves in a clockwise manner. The diagram can be used to represent a comparison or a report or an analysis of the data.

Right Selection Of Candidate Diagram Powerpoint Template
Deliver amazing presentations with our above template showing blue man is picking up by crane. You may download this PPT slide to display selection of right candidate. Capture the attention of your audience using this PPT diagram slide.

Competitive Analysis Template 6 Scatter Chart Ppt PowerPoint Presentation Icon Example Topics
This is a competitive analysis template 6 scatter chart ppt powerpoint presentation icon example topics. This is a eight stage process. The stages in this process are users interface, data import, example, pricing, support, update, tutorials, easy to use.

Clustered Bar Chart Yearly Operating Plan Ppt PowerPoint Presentation Styles Icon
This is a clustered bar chart yearly operating plan ppt powerpoint presentation styles icon. This is a four stage process. The stages in this process are business, management, strategy, analysis, marketing.
Gantt Chart For Task Planning And Management Ppt PowerPoint Presentation Icon Mockup
This is a gantt chart for task planning and management ppt powerpoint presentation icon mockup. This is a three stage process. The stages in this process are project management software, project management tools, project management techniques.

Business Trends Bar Chart Vector Icon Ppt PowerPoint Presentation Inspiration Graphic Images PDF
Persuade your audience using this business trends bar chart vector icon ppt powerpoint presentation inspiration graphic images pdf. This PPT design covers three stages, thus making it a great tool to use. It also caters to a variety of topics including business trends bar chart vector icon. Download this PPT design now to present a convincing pitch that not only emphasizes the topic but also showcases your presentation skills.
Pie Chart With Dollar Symbol For Market Share Vector Icon Ppt PowerPoint Presentation File Show PDF
Persuade your audience using this pie chart with dollar symbol for market share vector icon ppt powerpoint presentation file show pdf. This PPT design covers three stages, thus making it a great tool to use. It also caters to a variety of topics including pie chart with dollar symbol for market share vector icon. Download this PPT design now to present a convincing pitch that not only emphasizes the topic but also showcases your presentation skills.
Money Investment Growth Chart Vector Icon Ppt PowerPoint Presentation Slides Influencers PDF
Persuade your audience using this money investment growth chart vector icon ppt powerpoint presentation slides influencers pdf. This PPT design covers three stages, thus making it a great tool to use. It also caters to a variety of topics including money investment growth chart vector icon. Download this PPT design now to present a convincing pitch that not only emphasizes the topic but also showcases your presentation skills.

Business Trend Assessment Chart With Gear Vector Icon Ppt PowerPoint Presentation Styles Vector PDF
Persuade your audience using this business trend assessment chart with gear vector icon ppt powerpoint presentation styles vector pdf. This PPT design covers three stages, thus making it a great tool to use. It also caters to a variety of topics including business trend assessment chart with gear vector icon. Download this PPT design now to present a convincing pitch that not only emphasizes the topic but also showcases your presentation skills.
Three Column Chart With Various Solutions And Icons Ppt PowerPoint Presentation Infographic Template Graphics Design PDF
Pitch your topic with ease and precision using this three column chart with various solutions and icons ppt powerpoint presentation infographic template graphics design pdf. This layout presents information on three column chart with various solutions and icons. It is also available for immediate download and adjustment. So, changes can be made in the color, design, graphics or any other component to create a unique layout.
Statistical Assessment Scatter Chart Icon Ppt PowerPoint Presentation Infographic Template PDF
Persuade your audience using this statistical assessment scatter chart icon ppt powerpoint presentation infographic template pdf. This PPT design covers three stages, thus making it a great tool to use. It also caters to a variety of topics including statistical assessment scatter chart icon. Download this PPT design now to present a convincing pitch that not only emphasizes the topic but also showcases your presentation skills.

Business Stakeholder With Finance Chart Vector Icon Ppt PowerPoint Presentation File Portfolio PDF
Persuade your audience using this business stakeholder with finance chart vector icon ppt powerpoint presentation file portfolio pdf. This PPT design covers one stages, thus making it a great tool to use. It also caters to a variety of topics including business stakeholder with finance chart vector icon. Download this PPT design now to present a convincing pitch that not only emphasizes the topic but also showcases your presentation skills.

Business Economics With Currency Sign And Chart Vector Icon Ppt PowerPoint Presentation Gallery Structure PDF
Persuade your audience using this business economics with currency sign and chart vector icon ppt powerpoint presentation gallery structure pdf. This PPT design covers three stages, thus making it a great tool to use. It also caters to a variety of topics including business economics with currency sign and chart vector icon. Download this PPT design now to present a convincing pitch that not only emphasizes the topic but also showcases your presentation skills.
Economics With Business Growth Chart Vector Icon Ppt PowerPoint Presentation File Rules PDF
Persuade your audience using this economics with business growth chart vector icon ppt powerpoint presentation file rules pdf. This PPT design covers three stages, thus making it a great tool to use. It also caters to a variety of topics including economics with business growth chart vector icon. Download this PPT design now to present a convincing pitch that not only emphasizes the topic but also showcases your presentation skills.
Performance Statistics Chart With Magnifying Glass Vector Icon Ppt Show Shapes PDF
Presenting performance statistics chart with magnifying glass vector icon ppt show shapes pdf to provide visual cues and insights. Share and navigate important information on four stages that need your due attention. This template can be used to pitch topics like performance statistics chart with magnifying glass vector icon. In addition, this PPT design contains high-resolution images, graphics, etc, that are easily editable and available for immediate download.
Manager Analyzing Trends From Financial Modelling Chart Vector Icon Portrait PDF
Persuade your audience using this manager analyzing trends from financial modelling chart vector icon portrait pdf. This PPT design covers three stages, thus making it a great tool to use. It also caters to a variety of topics including manager analyzing trends from financial modelling chart vector icon. Download this PPT design now to present a convincing pitch that not only emphasizes the topic but also showcases your presentation skills.

Accounting Ratio Assessment With Growth Chart Icon Ppt PowerPoint Presentation Show Inspiration PDF
Persuade your audience using this Accounting Ratio Assessment With Growth Chart Icon Ppt PowerPoint Presentation Show Inspiration PDF. This PPT design covers three stages, thus making it a great tool to use. It also caters to a variety of topics including Accounting Ratio, Assessment Growth, Chart Icon. Download this PPT design now to present a convincing pitch that not only emphasizes the topic but also showcases your presentation skills.

5 Years Mutual Funds Performance Comparative Analysis Chart Icon Ppt Show Gridlines PDF
Persuade your audience using this 5 Years Mutual Funds Performance Comparative Analysis Chart Icon Ppt Show Gridlines PDF. This PPT design covers three stages, thus making it a great tool to use. It also caters to a variety of topics including 5 Years, Mutual Funds, Performance Comparative, Analysis, Chart Icon. Download this PPT design now to present a convincing pitch that not only emphasizes the topic but also showcases your presentation skills.
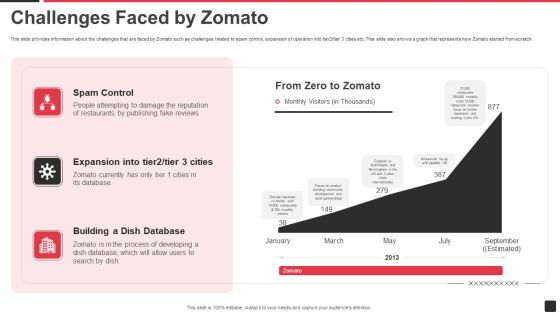
Zomato Venture Capitalist Fundraising Pitch Deck Challenges Faced By Zomato Themes PDF
This slide provides information about the challenges that are faced by Zomato such as challenges related to spam control, expansion of operation into tier2 or tier 3 cities etc. This slide also shows a graph that represents how Zomato started from scratch. Deliver an awe inspiring pitch with this creative zomato venture capitalist fundraising pitch deck challenges faced by zomato themes pdf bundle. Topics like spam control, expansion into tier2 or tier 3 cities, building a dish database can be discussed with this completely editable template. It is available for immediate download depending on the needs and requirements of the user.

Big Data Business Benefits Pie Charts Ppt PowerPoint Presentation Backgrounds
This is a big data business benefits pie charts ppt powerpoint presentation backgrounds. This is a four stage process. The stages in this process are business, marketing, icons, strategy, management.

Pie Chart Ppt PowerPoint Presentation Template
This is a pie chart ppt powerpoint presentation template. This is a three stage process. The stages in this process are business, strategy, marketing, analysis, finance.

Stock Chart Ppt PowerPoint Presentation Information
This is a stock chart ppt powerpoint presentation information. This is a five stage process. The stages in this process are projects, marketing, high, volume, low.
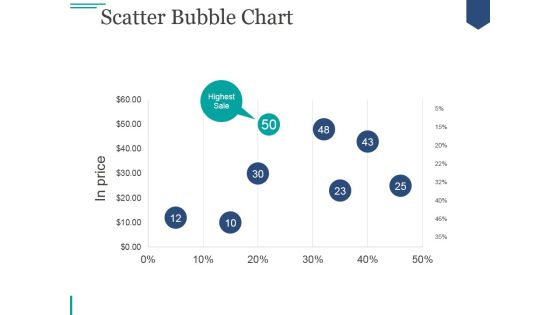
Scatter Bubble Chart Ppt PowerPoint Presentation Ideas
This is a scatter bubble chart ppt powerpoint presentation ideas. This is a five stage process. The stages in this process are highest sale, business, marketing, strategy, price.

Stock Chart Ppt PowerPoint Presentation Professional Maker
This is a stock chart ppt powerpoint presentation professional maker. This is a five stage process. The stages in this process are close, high, volume, low, open.
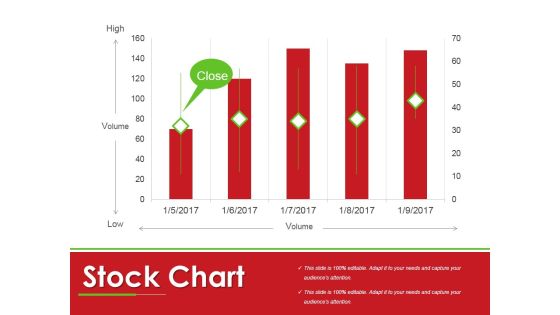
Stock Chart Ppt PowerPoint Presentation Professional Backgrounds
This is a stock chart ppt powerpoint presentation professional backgrounds. This is a five stage process. The stages in this process are business, marketing, graph, management, planning.

Column Chart Ppt PowerPoint Presentation Show Pictures
This is a column chart ppt powerpoint presentation show pictures. This is a six stage process. The stages in this process are business, finance, planning, years, marketing.

Bar Chart Ppt PowerPoint Presentation Model Good
This is a bar chart ppt powerpoint presentation model good. This is a seven stage process. The stages in this process are business, marketing, bar, success, finance.

Bar Chart Ppt PowerPoint Presentation Infographics Skills
This is a bar chart ppt powerpoint presentation infographics skills. This is a seven stage process. The stages in this process are business, marketing, strategy, finance, bar.

Column Chart Ppt PowerPoint Presentation Gallery
This is a column chart ppt powerpoint presentation gallery. This is a six stage process. The stages in this process are business, finance, years, product, graph.

Bar Chart Ppt PowerPoint Presentation Pictures Inspiration
This is a bar chart ppt powerpoint presentation pictures inspiration. This is a seven stage process. The stages in this process are in percentage, business, marketing, finance, graph.

Combo Chart Ppt PowerPoint Presentation Ideas Portrait
This is a combo chart ppt powerpoint presentation ideas portrait. This is a three stage process. The stages in this process are product, business, finance, growth.
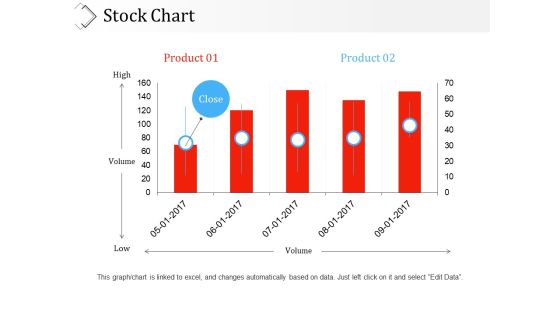
Stock Chart Ppt PowerPoint Presentation Ideas Sample
This is a stock chart ppt powerpoint presentation ideas sample. This is a five stage process. The stages in this process are product, high, low, volume, business.
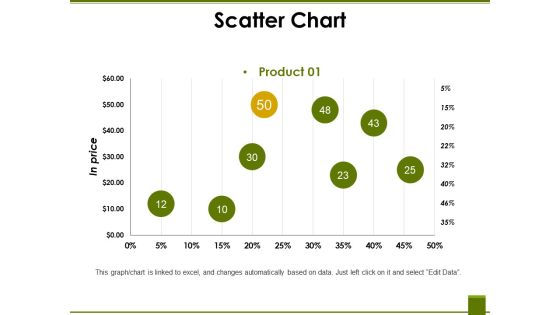
Scatter Chart Ppt PowerPoint Presentation File Display
This is a scatter chart ppt powerpoint presentation file display. This is a eight stage process. The stages in this process are product, business, marketing, finance, in price.
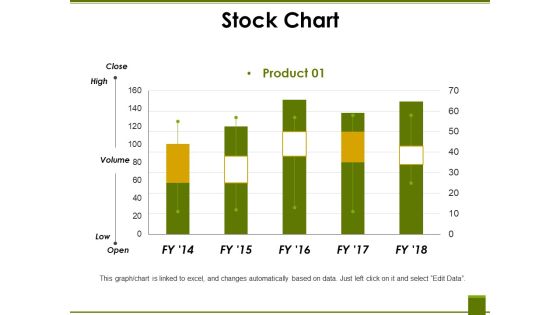
Stock Chart Ppt PowerPoint Presentation Summary Pictures
This is a stock chart ppt powerpoint presentation summary pictures. This is a five stage process. The stages in this process are high, volume, low, product, graph.
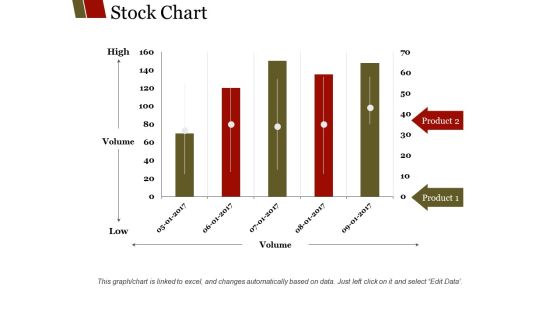
Stock Chart Ppt PowerPoint Presentation Outline Slideshow
This is a stock chart ppt powerpoint presentation outline slideshow. This is a five stage process. The stages in this process are high, volume, low, product, finance.
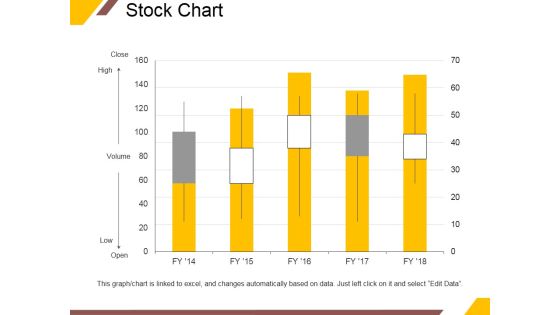
Stock Chart Ppt PowerPoint Presentation Professional Pictures
This is a stock chart ppt powerpoint presentation professional pictures. This is a five stage process. The stages in this process are close, high, volume, low, open.
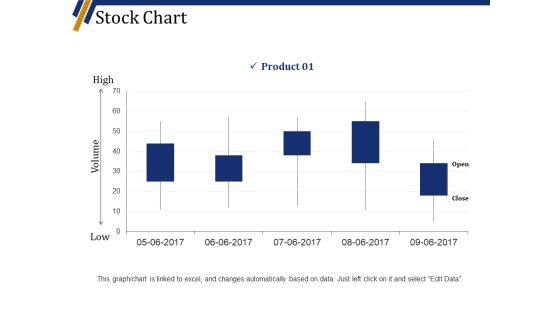
Stock Chart Ppt PowerPoint Presentation Slides Maker
This is a stock chart ppt powerpoint presentation slides maker. This is a five stage process. The stages in this process are high, volume, low, product, business, graph.
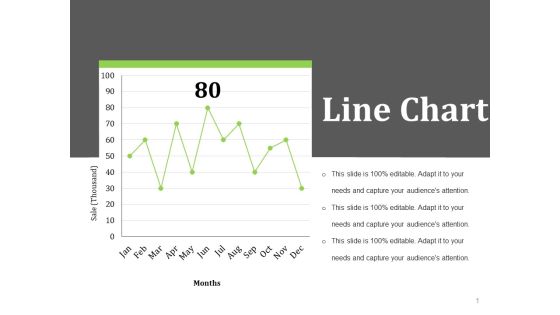
Line Chart Ppt PowerPoint Presentation Slides Template
This is a line chart ppt powerpoint presentation slides template. This is a one stage process. The stages in this process are months, sale thousand, business, marketing, finance.

Pie Chart Ppt PowerPoint Presentation Layouts Topics
This is a pie chart ppt powerpoint presentation layouts topics. This is a three stage process. The stages in this process are pie, process, percentage, finance, business.
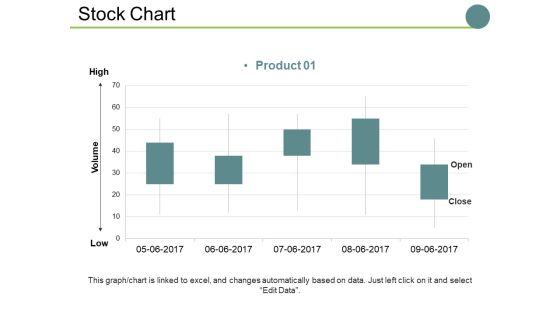
Stock Chart Ppt PowerPoint Presentation Show Sample
This is a stock chart ppt powerpoint presentation show sample. This is a one stage process. The stages in this process are high, volume, low, business, graph, marketing.

Bubble Chart Ppt PowerPoint Presentation Show Graphics
This is a bubble chart ppt powerpoint presentation show graphics. This is a four stage process. The stages in this process are business, marketing, graph, finance, strategy.
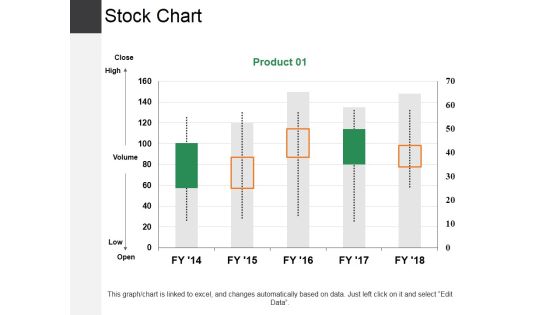
Stock Chart Ppt PowerPoint Presentation Slides Outline
This is a stock chart ppt powerpoint presentation slides outline. This is a one stage process. The stages in this process are high, low, business, marketing, graph.

Stock Chart Ppt PowerPoint Presentation Show Backgrounds
This is a stock chart ppt powerpoint presentation show backgrounds. This is a one stage process. The stages in this process are high, volume, low, business, marketing.

Column Chart Ppt PowerPoint Presentation Show Model
This is a column chart ppt powerpoint presentation show model. This is a six stage process. The stages in this process are business, marketing, bar, planning, strategy.
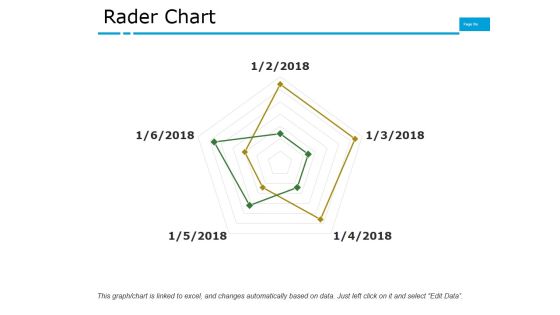
Rader Chart Ppt PowerPoint Presentation Professional Display
This is a rader chart ppt powerpoint presentation professional display. This is a five stage process. The stages in this process are business, marketing, finance, strategy, planning.
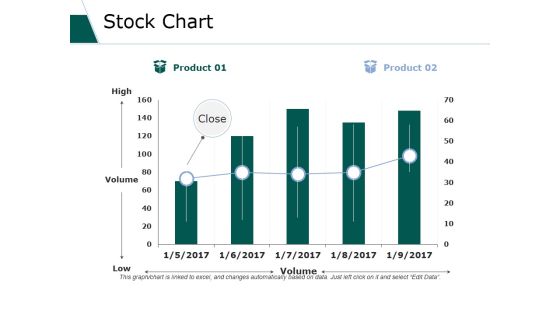
Stock Chart Ppt PowerPoint Presentation Layouts Professional
This is a stock chart ppt powerpoint presentation layouts professional. This is a five stage process. The stages in this process are business, marketing, strategy, planning, finance.

Column Chart Ppt PowerPoint Presentation Styles Picture
This is a column chart ppt powerpoint presentation styles picture. This is a five stage process. The stages in this process are years, business, marketing, graph, finance.
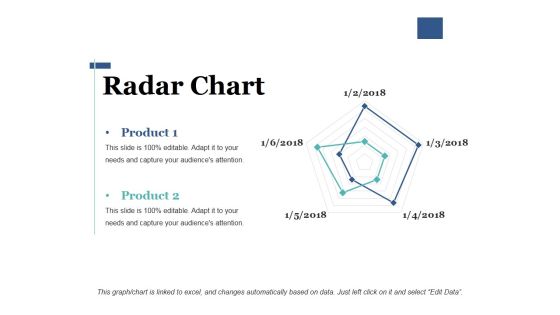
Radar Chart Ppt PowerPoint Presentation Portfolio Elements
This is a radar chart ppt powerpoint presentation portfolio elements. This is a five stage process. The stages in this process are business, strategy, marketing, finance, planning.

Bar Chart Ppt PowerPoint Presentation Show Slides
This is a bar chart ppt powerpoint presentation show slides. This is a three stage process. The stages in this process are business, marketing, strategy, bar, finance.

Column Chart Ppt Powerpoint Presentation Slides Ideas
This is a column chart ppt powerpoint presentation slides ideas. This is a six stage process. The stages in this process are business, finance, analysis, marketing, strategy.

Bar Chart Ppt PowerPoint Presentation Model Professional
This is a bar chart ppt powerpoint presentation model professional. This is a three stage process. The stages in this process are business, marketing, strategy, finance, growth.

Stock Chart Ppt PowerPoint Presentation Pictures Files
This is a stock chart ppt powerpoint presentation pictures files. This is a five stage process. The stages in this process are business, marketing, planning, finance, strategy.

Scatter Chart Ppt PowerPoint Presentation Portfolio Guide
This is a scatter chart ppt powerpoint presentation portfolio guide. This is a one stage process. The stages in this process are finance, marketing, strategy, planning, gears.
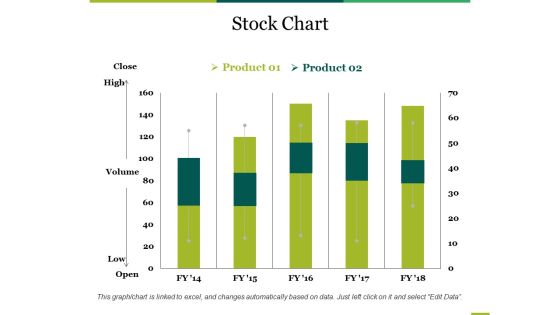
Stock Chart Ppt PowerPoint Presentation Gallery Summary
This is a stock chart ppt powerpoint presentation gallery summary. This is a five stage process. The stages in this process are business, marketing, strategy, finance, planning.

Column Chart Ppt PowerPoint Presentation Design Ideas
This is a column chart ppt powerpoint presentation design ideas. This is a three stage process. The stages in this process are business, marketing, strategy, planning, finance.

Combo Chart Ppt PowerPoint Presentation Layouts Infographics
This is a combo chart ppt powerpoint presentation layouts infographics. This is a three stage process. The stages in this process are business, marketing, strategy, planning, finance.
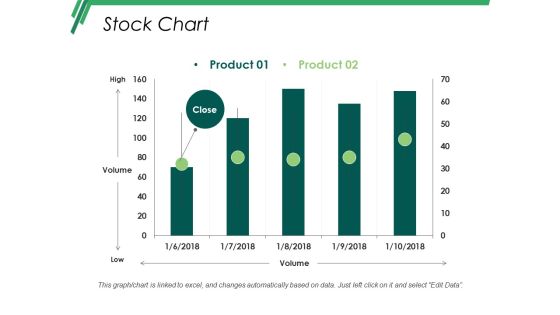
Stock Chart Ppt PowerPoint Presentation Ideas Designs
This is a stock chart ppt powerpoint presentation ideas designs. This is a five stage process. The stages in this process are business, marketing, strategy, finance, analysis.

Combo Chart Ppt PowerPoint Presentation Show Information
This is a combo chart ppt powerpoint presentation show information. This is a three stage process. The stages in this process are business, marketing, strategy, planning, finance.

Bubble Chart Ppt PowerPoint Presentation Professional
This is a bubble chart ppt powerpoint presentation professional. This is a eight stage process. The stages in this process are business, marketing, strategy, planning, finance.
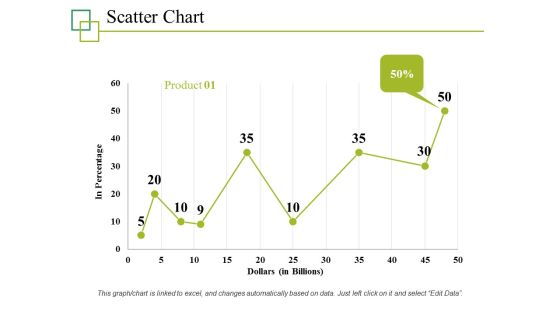
Scatter Chart Ppt PowerPoint Presentation File Graphics
This is a scatter chart ppt powerpoint presentation file graphics. This is a one stage process. The stages in this process are business, marketing, strategy, planning, finance.

Combo Chart Ppt PowerPoint Presentation Show Summary
This is a combo chart ppt powerpoint presentation show summary. This is a three stage process. The stages in this process are bar, marketing, strategy, finance, planning.

Bar Chart Ppt PowerPoint Presentation File Templates
This is a bar chart ppt powerpoint presentation file templates. This is a four stage process. The stages in this process are business, marketing, strategy, finance, planning.

Area Chart Ppt PowerPoint Presentation Styles Ideas
This is a area chart ppt powerpoint presentation styles ideas. This is a three stage process. The stages in this process are percentage, product, business.

Combo Chart Ppt PowerPoint Presentation Model Professional
This is a combo chart ppt powerpoint presentation model professional. This is a three stage process. The stages in this process are finance, marketing, management, investment, analysis.

Bubble Chart Ppt PowerPoint Presentation Styles Show
This is a bubble chart ppt powerpoint presentation styles show. This is a three stage process. The stages in this process are finance, marketing, management, investment, analysis.

Bar Chart Ppt PowerPoint Presentation Professional Examples
This is a bar chart ppt powerpoint presentation professional examples. This is a four stage process. The stages in this process are percentage, marketing, management, product.

Bubble Chart Ppt PowerPoint Presentation Ideas Images
This is a bubble chart ppt powerpoint presentation ideas images. This is a three stage process. The stages in this process are percentage, product, marketing, business.
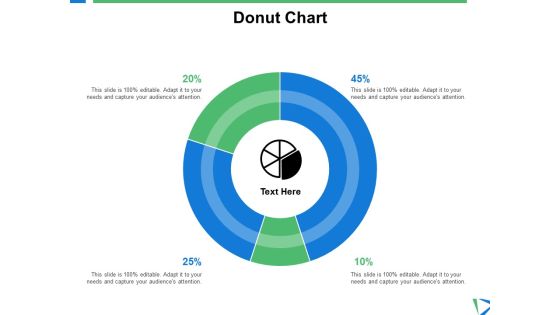
Donut Chart Investment Ppt PowerPoint Presentation Shapes
This is a donut chart investment ppt powerpoint presentation shapes. This is a four stage process. The stages in this process are finance, analysis, business, investment, marketing.

Alphabet Steps For Financial Strategy Analysis Powerpoint Slides
This PowerPoint template has been designed with alphabet steps with icons. This PPT slide may be used to display financial strategy analysis. Make outstanding business presentation with this template.

Bar Graph For Business Growth Steps Powerpoint Slides
This PowerPoint template contains design of bar graph with icons. You may download this slide to display strategy steps for business growth. You can easily customize this template to make it more unique as per your need.

Strategies For Effective Product Price Driven Strategy In Product Development Pictures PDF
This slide represents product price driven strategy. It covers cost plus and value based pricing leading to differentiate brand into high end or low end cost brand. Are you searching for a Strategies For Effective Product Price Driven Strategy In Product Development Pictures PDF that is uncluttered, straightforward, and original Its easy to edit, and you can change the colors to suit your personal or business branding. For a presentation that expresses how much effort youve put in, this template is ideal With all of its features, including tables, diagrams, statistics, and lists, its perfect for a business plan presentation. Make your ideas more appealing with these professional slides. Download Strategies For Effective Product Price Driven Strategy In Product Development Pictures PDF from Slidegeeks today.
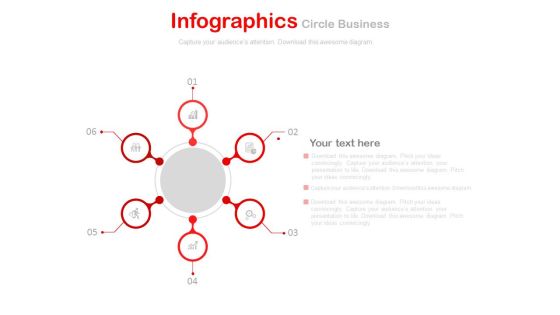
Six Staged Hub And Spokes Diagram Powerpoint Slides
This PowerPoint template has been designed with circular hub and spokes diagram. This PPT slide can be used to display cycle of financial steps. You can download finance PowerPoint template to prepare awesome presentations.

11 Synthesis Brainstorming Venn Diagram Ppt PowerPoint Presentation Designs Download
This is a 11 synthesis brainstorming venn diagram ppt powerpoint presentation designs download. This is a three stage process. The stages in this process are rich stimulus, climate, thinking, action, definition, similar.

Employee Career Planning And Decision Making Procedure Icons PDF
This slide shows three steps for planning career in a systematic way for grabbing job opportunities in market. It include steps such as conducting self assessment, expanding knowledge and taking action etc. Presenting Employee Career Planning And Decision Making Procedure Icons PDF to dispense important information. This templateE2 E5 comprises three stages. It also presents valuable insights into the topics including Conduct Self Assessment, Expand Your Knowledge, Start Taking Action. This is a completely customizable PowerPoint theme that can be put to use immediately. So, download it and address the topic impactfully.
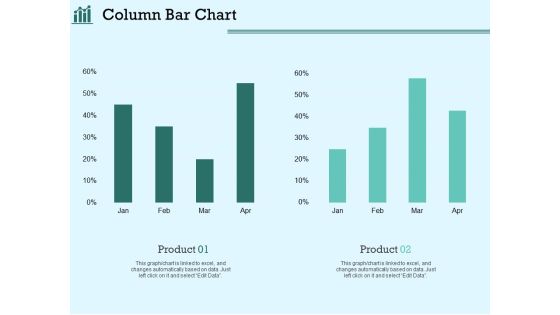
Survey Analysis Gain Marketing Insights Column Bar Chart Template PDF
Presenting this set of slides with name survey analysis gain marketing insights column bar chart template pdf. The topics discussed in these slides are product 1, product 2. This is a completely editable PowerPoint presentation and is available for immediate download. Download now and impress your audience.
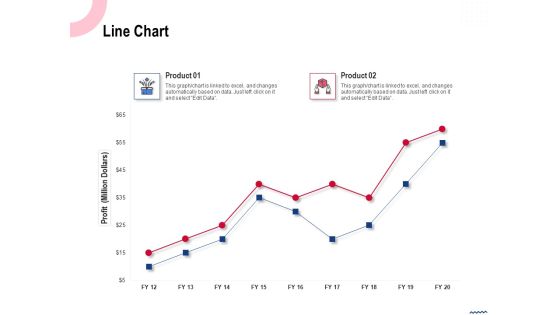
Wireless Phone Information Management Plan Line Chart Slides PDF
Presenting this set of slides with name wireless phone information management plan line chart slides pdf. The topics discussed in these slides are product 1, product 2. This is a completely editable PowerPoint presentation and is available for immediate download. Download now and impress your audience.
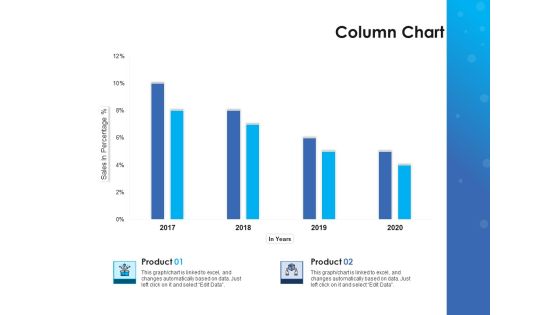
Hoshin Policy Deployment Strategic Planning Column Chart Microsoft PDF
Presenting this set of slides with name hoshin policy deployment strategic planning column chart microsoft pdf. The topics discussed in these slides are product 1, product 2. This is a completely editable PowerPoint presentation and is available for immediate download. Download now and impress your audience.
Half Yearly Plan Proposal Development Roadmap Icons
Presenting our jaw-dropping half yearly plan proposal development roadmap icons. You can alternate the color, font size, font type, and shapes of this PPT layout according to your strategic process. This PPT presentation is compatible with Google Slides and is available in both standard screen and widescreen aspect ratios. You can also download this well-researched PowerPoint template design in different formats like PDF, JPG, and PNG. So utilize this visually-appealing design by clicking the download button given below.
Node Js Computing Half Yearly Roadmap Icons
Introducing our node js computing half yearly roadmap icons. This PPT presentation is Google Slides compatible, therefore, you can share it easily with the collaborators for measuring the progress. Also, the presentation is available in both standard screen and widescreen aspect ratios. So edit the template design by modifying the font size, font type, color, and shapes as per your requirements. As this PPT design is fully editable it can be presented in PDF, JPG and PNG formats.

Cyber Security Half Yearly Strategic Timeline Icons
Presenting our innovatively structured cyber security half yearly strategic timeline icons Template. Showcase your roadmap process in different formats like PDF, PNG, and JPG by clicking the download button below. This PPT design is available in both Standard Screen and Widescreen aspect ratios. It can also be easily personalized and presented with modified font size, font type, color, and shapes to measure your progress in a clear way.
Scatter Chart With Horizontal And Vertical Axis Ppt PowerPoint Presentation Icon Infographics PDF
Persuade your audience using this scatter chart with horizontal and vertical axis ppt powerpoint presentation icon infographics pdf. This PPT design covers three stages, thus making it a great tool to use. It also caters to a variety of topics including scatter chart with horizontal and vertical axis. Download this PPT design now to present a convincing pitch that not only emphasizes the topic but also showcases your presentation skills.

Gantt Chart For Project Management And Process Mapping Ppt PowerPoint Presentation Model Styles
This is a gantt chart for project management and process mapping ppt powerpoint presentation model styles. This is a four stage process. The stages in this process are swim lane diagram, flowchart, management.

Project Management Swim Lane Flow Chart Ppt PowerPoint Presentation Pictures Brochure
This is a project management swim lane flow chart ppt powerpoint presentation pictures brochure. This is a four stage process. The stages in this process are swim lane diagram, flowchart, management.

Ethical Considerations While Using Chatgpt Themes PDF
This slide provides information regarding ethical considerations essential while accessing ChatGPT platforms to ensure responsible usage. Pre-requisites include managing training data biases and handling technology abuse or misuse. Boost your pitch with our creative Ethical Considerations While Using Chatgpt Themes PDF. Deliver an awe-inspiring pitch that will mesmerize everyone. Using these presentation templates you will surely catch everyones attention. You can browse the ppts collection on our website. We have researchers who are experts at creating the right content for the templates. So you do not have to invest time in any additional work. Just grab the template now and use them.

Bar Chart Ppt PowerPoint Presentation Outline Introduction
This is a bar chart ppt powerpoint presentation outline introduction. This is a one stage process. The stages in this process are sales in percentage, product, business, financial years, graph.

Bar Chart Ppt PowerPoint Presentation Layouts Pictures
This is a bar chart ppt powerpoint presentation layouts pictures. This is a three stage process. The stages in this process are bar graph, product, sales in percentage, business, marketing.

Bar Chart Ppt PowerPoint Presentation Outline Guidelines
This is a bar chart ppt powerpoint presentation outline guidelines. This is a four stage process. The stages in this process are product, unit count, in years, graph, finance, business.

Bar Chart Ppt PowerPoint Presentation Styles Outfit
This is a bar chart ppt powerpoint presentation styles outfit. This is a Seven stage process. The stages in this process are sales in percentage, financial years, graph, business.
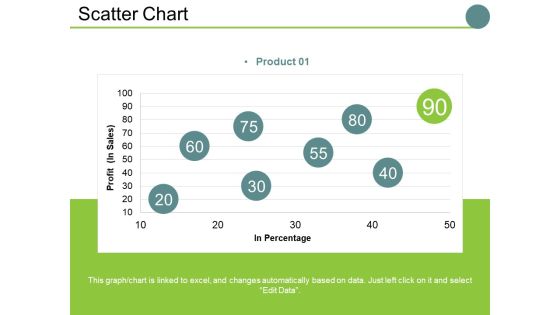
Scatter Chart Ppt PowerPoint Presentation Slides Examples
This is a scatter chart ppt powerpoint presentation slides examples. This is a one stage process. The stages in this process are profit , in percentage, business, marketing, finance, graph.

Bar Chart Ppt PowerPoint Presentation File Slide
This is a bar chart ppt powerpoint presentation file slide. This is a one stage process. The stages in this process are sales in percentage financial years, business, marketing, strategy, graph.

Cloud Network Diagram With Percentage Data Powerpoint Slides
This PowerPoint template contains graphics of cloud network diagram with percentage values. You may download this PPT slide design to display cloud network and financial strategy. You can easily customize this template to make it more unique as per your need.
Icon For Insurance Business Model With Money Benefits And Pie Chart Topics PDF
Persuade your audience using this Icon For Insurance Business Model With Money Benefits And Pie Chart Topics PDF This PPT design covers three stages, thus making it a great tool to use. It also caters to a variety of topics including Icon For Insurance, Business Model, Money Benefits Download this PPT design now to present a convincing pitch that not only emphasizes the topic but also showcases your presentation skills.
Financial Medium Minimum Ppt PowerPoint Presentation Icon Diagrams
This is a financial medium minimum ppt powerpoint presentation icon diagrams. This is a three stage process. The stages in this process are finance, analysis, business, investment, marketing.
Lean Excellence Ppt PowerPoint Presentation Icon Diagrams Cpb
This is a lean excellence ppt powerpoint presentation icon diagrams cpb. This is a three stage process. The stages in this process are lean excellence.
Product Roadmap Template 3 Ppt PowerPoint Presentation Ideas Icon
This is a product roadmap template 2 ppt powerpoint presentation layouts portrait. This is a nine stage process. The stages in this process are marketing, tables, business, planning.

Bubble Chart Ppt PowerPoint Presentation Slides Download
This is a bubble chart ppt powerpoint presentation slides download. This is a four stage process. The stages in this process are business, marketing, bubble chart, finance, product.

Combo Chart Ppt PowerPoint Presentation Pictures Background
This is a combo chart ppt powerpoint presentation pictures background. This is a eight stage process. The stages in this process are combo chart, growth, strategy, analysis, business.

Combo Chart Ppt PowerPoint Presentation Professional Infographics
This is a combo chart ppt powerpoint presentation professional infographics. This is a three stage process. The stages in this process are combo chart, market size, product.

Column Chart Ppt PowerPoint Presentation Summary Samples
This is a column chart ppt powerpoint presentation summary samples. This is a five stage process. The stages in this process are column chart, finance, marketing, strategy, business.

Bubble Chart Ppt PowerPoint Presentation Professional Layouts
This is a bubble chart ppt powerpoint presentation professional layouts. This is a three stage process. The stages in this process are bubble chart, finance, marketing, strategy, business.
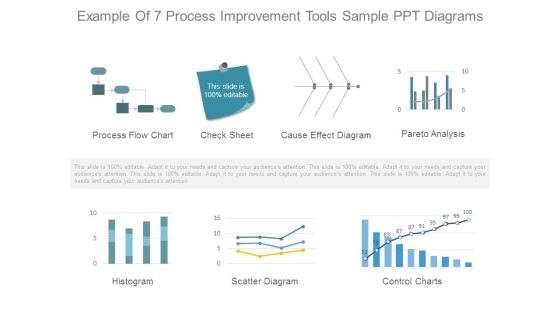
Example Of 7 Process Improvement Tools Sample Ppt Diagrams
This is a example of 7 process improvement tools sample ppt diagrams. This is a seven stage process. The stages in this process are process flow chart, check sheet, cause effect diagram, pareto analysis, histogram, scatter diagram, control charts.
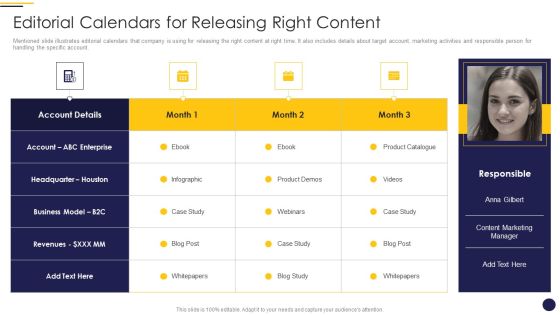
Internet Marketing Playbook Editorial Calendars For Releasing Right Content Portrait PDF
Mentioned slide illustrates editorial calendars that company is using for releasing the right content at right time. It also includes details about target account, marketing activities and responsible person for handling the specific account. Presenting Internet Marketing Playbook Editorial Calendars For Releasing Right Content Portrait PDF to provide visual cues and insights. Share and navigate important information on one stages that need your due attention. This template can be used to pitch topics like Account Details Month, Account ABC Enterprise, Business Model Infographic, Case Study Product. In addtion, this PPT design contains high resolution images, graphics, etc, that are easily editable and available for immediate download.
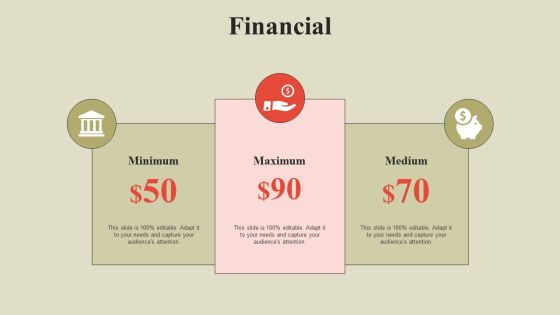
Steps To Effectively Conduct Market Research Financial Graphics PDF
If you are looking for a format to display your unique thoughts, then the professionally designed Steps To Effectively Conduct Market Research Financial Graphics PDF is the one for you. You can use it as a Google Slides template or a PowerPoint template. Incorporate impressive visuals, symbols, images, and other charts. Modify or reorganize the text boxes as you desire. Experiment with shade schemes and font pairings. Alter, share or cooperate with other people on your work. Download Steps To Effectively Conduct Market Research Financial Graphics PDF and find out how to give a successful presentation. Present a perfect display to your team and make your presentation unforgettable.

Business Framework Model Confusion Caused By Multiple Targets 5 Business Cycle Diagram
Document Your Views On Our Business Framework Model Confusion Caused By Multiple Targets 5 Business Cycle Diagram Powerpoint Templates. They Will Create A Strong Impression.
